QUBE HOLDINGS LIMITED - Investor Presentation FY 21 Full Year Results - Bell Direct
←
→
Page content transcription
If your browser does not render page correctly, please read the page content below
QUBE
HOLDINGS
 LIMITED

  Investor
Presentation
FY 21 Full Year
   Results
Disclaimer – Important Notice
The information contained in this Presentation or subsequently provided to the recipient whether orally or in writing by, or on behalf of Qube Holdings Limited (Qube) or any of its directors, officers,
employees, agents, representatives and advisers (the Parties) is provided to the recipient on the terms and conditions set out in this notice.

The information contained in this Presentation has been furnished by the Parties and other sources deemed reliable but no assurance can be given by the Parties as to the accuracy or completeness of this
information.

To the full extent permitted by law:

(a) no representation or warranty (express or implied) is given; and

(b) no responsibility or liability (including in negligence) is accepted,

by the Parties as to the truth, accuracy or completeness of any statement, opinion, forecast, information or other matter (whether express or implied) contained in this Presentation or as to any other matter
concerning them.

To the full extent permitted by law, no responsibility or liability (including in negligence) is accepted by the Parties:

(a) for or in connection with any act or omission, directly or indirectly in reliance upon; and

(b) for any cost, expense, loss or other liability, directly or indirectly, arising from, or in connection with, any omission from or defects in, or any failure to correct any information,

in this Presentation or any other communication (oral or written) about or concerning them.

The delivery of this Presentation does not under any circumstances imply that the affairs or prospects of Qube or any information have been fully or correctly stated in this Presentation or have not changed
since the date at which the information is expressed to be applicable. Except as required by law and the ASX listing rules, no responsibility or liability (including in negligence) is assumed by the Parties for
updating any such information or to inform the recipient of any new information of which the Parties may become aware.

Notwithstanding the above, no condition, warranty or right is excluded if its exclusion would contravene the Competition and Consumer Act 2010 or any other applicable law or cause an exclusion to be void.

The provision of this Presentation is not and should not be considered as a recommendation in relation to an investment in Qube or that an investment in Qube is a suitable investment for the recipient.

References to ‘underlying’ information is to non-IFRS financial information prepared in accordance with ASIC Regulatory Guide 230 (Disclosing non-IFRS financial information) issued in December 2011.
                                                                                                                                                                                                                     2
Non-IFRS financial information has not been subject to audit or review.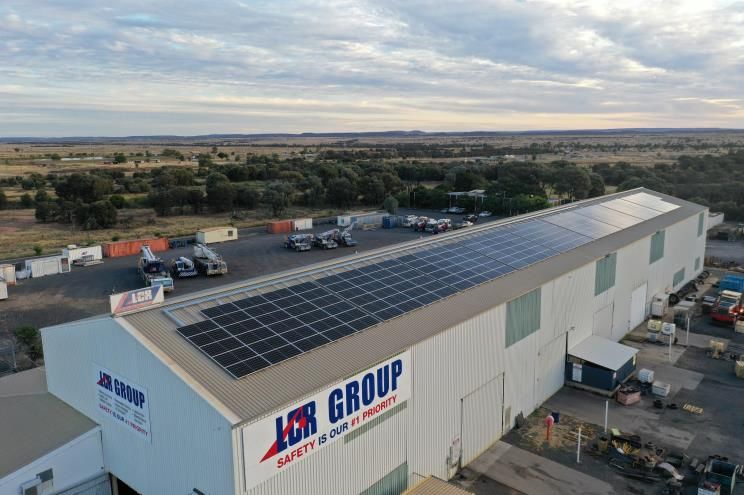
Table of contents
1.   FY 21 Full Year Highlights

2.   Key Financial Information

3.   Moorebank Monetisation Process Update

4.   Qube Post-Monetisation

5.   FY 22 Outlook

6.   Additional Financial Information (Appendices)
                                                     3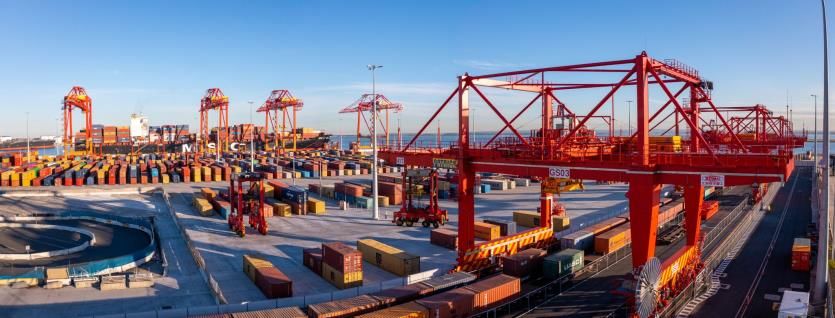
FY 21 Full Year Highlights
Very pleasing financial and safety performance
                                Full year in review                                                                                    Key financial metrics
 •   Strong financial performance with record underlying earnings (NPATA) for Qube
                                                                                                                 +14.5%      Statutory revenue                     +7.9%       Underlying revenue
 •   Reflects growth across most of Qube’s key markets and Qube’s leading market positions                                    $2,177.4 million                                  $2,032.4 million
 •   Very pleasing safety, health and sustainability outcomes with improvements in most key
     metrics
 •   Effectively addressed ongoing operational and safety challenges with COVID-19 and                            -27.1%      Statutory EBITA                                   Underlying EBITA
                                                                                                                                                                   +14.1%
     multiple lockdowns                                                                                                        $156.6 million                                    $182.9 million
 •   Continued investment in complementary acquisitions, equipment, facilities and technology
     to support future earnings growth
 •   Significant progress on the property monetisation process with binding agreements                           +4.7%         Statutory NPAT                                   Underlying NPAT
                                                                                                                                                                  +36.8%
     (subject to conditions) signed for the Moorebank Logistics Park (MLP) warehousing in early                                 $91.6 million                                    $142.5 million
     July 2021 and completion of sale of Minto Properties in September 2020
 •   Fully repaid FY21 JobKeeper payments applied for and received by Qube                                                Statutory NPATA                                 Underlying NPATA
 •   Strong balance sheet with conservative leverage and substantial liquidity
                                                                                                                 +4.0% (NPAT pre-amortisation)*                        (NPAT pre-amortisation)*
                                                                                                                                                                 +31.7%     $159.6 million
                                                                                                                           $108.7 million
 •   The full year dividend has been increased by 15.4% to 6.0 cents per share (fully franked)
     reflecting the strong financial performance and positive outlook
                                                                                                                               Statutory EPSA                                Underlying EPSA
 Note: Statutory results in this presentation are adjusted to include the contribution from                       -8.1%    (EPS pre-amortisation)*                        (EPS pre-amortisation)*
 assets classified as discontinued operations in the statutory financial statements (i.e. earnings
                                                                                                                                                                   +16.7%
                                                                                                                                  5.7 cents                                      8.4 cents
 associated with the MLP assets that are in the process of being sold to a consortium led by
 LOGOS Property Group).                                                                                    *Note: NPATA is NPAT adjusted for Qube’s amortisation and Qube’s share of Patrick’s amortisation.
                                                                                                                  EPSA is NPATA divided by the fully diluted weighted average number of shares outstanding.

The underlying information excludes certain non-cash and non-recurring items in order to more accurately reflect the underlying financial performance of Qube. References to
‘underlying’ information are to non-IFRS financial information prepared in accordance with ASIC Regulatory Guide 230 (Disclosing non-IFRS financial information) issued in                               4
December 2011. Non-IFRS financial information has not been subject to audit or review.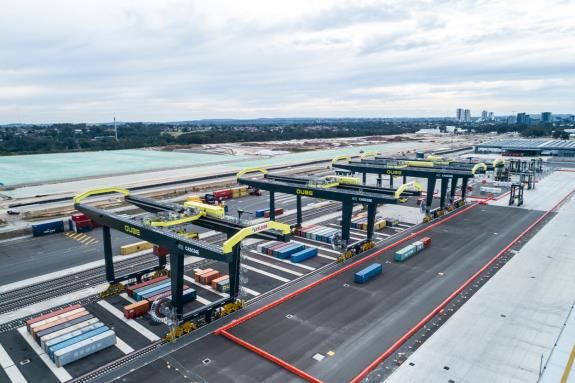
FY 21 Full Year Highlights
Ongoing improvement in Safety and Health outcomes
                                                                                            Safety and Health
         Total Recordable Injury Frequency Rate                               Critical Incident Frequency Rate                                Health and Wellbeing
                        (TRIFR)*                                                            (CIFR)**
20                                                                                                                         •   Successful programs implemented for Mental Health, Diversity and
       16.2                                                       4
                                                                            3.2                                                Wellbeing
15                                                                3
                  9.3                                                                 2.2                                  •   Onboarding of a new Benestar Employee Assistance Program provider
10                           8.9       8.3        9.0                                           1.7
                                                                  2                                       1.5                  to provide employees and their immediate family members with
                                                                                                                               access to enhanced assistance programs with qualified psychologists,
 5                                                                1                                                  0.3       social workers as well as personal and professional coaching and
 0                                                                0                                                            counselling services.
       FY17       FY18      FY19       FY20       FY21                   FY17        FY18      FY19      FY20       FY21
                                                                                                                           •   Introduced additional special paid leave to employees who are
  *Note: TRIFR is the combined number of recordable Return to Work, Medical Treatment Injuries and Lost Time Injuries          supporting charitable and community related causes.
  for every million hours worked
  **Note: CIFR is the number of actual Class 4/5 incidents and the number of potential Class 4/5 incidents per million                                  COVID-19
  hours worked. Class represents the severity level (4 = major, 5 = critical).
                                                                                                                           •   Qube has responded to the global pandemic with health and safety of
  •   Consistent with the goal of Zero Harm, Qube achieved zero
                                                                                                                               its workforce, customers and communities as a first priority
      fatalities in FY 21 and reduced its Lost Time Injury Frequency Rate
      (LTIFR)* from 0.9 to 0.8 per million hours worked                                                                    •   Qube’s employee engagement app (myQube), internal
                                                                                                                               communications and COVIDSafe toolbox talks have ensured we reach
  •   TRIFR increased from 8.3 to 9.0, mainly due to the impact of
                                                                                                                               our people to provide regular communications on the latest health
      consolidating recent acquisition TRIFR data in the period. Qube will
                                                                                                                               orders regarding COVID-19 in our locations of operation and provide
      continue to focus on reducing recordable injuries through
                                                                                                                               vital information regarding COVIDSafe protocols
      increased focus on risk management systems and processes
                                                                                                                           •   Qube has a strong safety and leadership culture and engaged
  •   During the period, CIFR has decreased from 1.5 to 0.3, as a result of
                                                                                                                               workforce, effective crisis management and governance controls as
      Qube’s leading-edge Monitoring Centre which has successfully
                                                                                                                               well as Health and Wellbeing initiatives which enable it to quickly
      avoided truck rollovers whilst improving Qube’s critical risk
                                                                                                                               adapt and introduce measures to stop the spread of the virus.
      verification and inspections.                                                Fleet Monitoring Centre, West Perth

*Note: LTIFR is the Number of Lost Time Injuries for every million hours worked.
                                                                                                                                                                                                5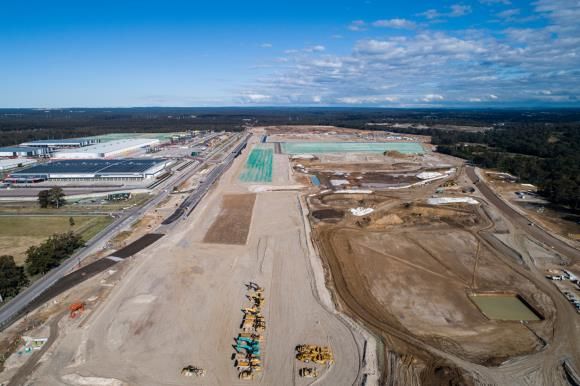
FY 21 Full Year Highlights
Improved sustainability performance
                                                                Sustainability and Environment
 •    In FY 21, Qube has improved its sustainability performance, including achieving the
      following outcomes:
     o Net emissions were steady in FY 21 as compared to FY 20 despite underlying revenue
       increasing during the period. As a result, Qube’s carbon intensity (tCO2 per $ million)
       decreased by 8.6% in FY 21
     o Engaged a consultant to investigate the options available for achieving a Low Carbon
       Future. Based on their findings, Qube will assess the options to understand the
       financial and operational implications. This will enable Qube adopt a longer-term
       carbon goal and sustainable strategy to address a Low Carbon Future
     o Implemented a Modern Slavery framework by developing a Supplier Code of Conduct
       and questionnaire, complemented by an internal Modern Slavery training package for
       managers, supervisors and procurement teams
     o Invested in Qube’s sustainability reporting systems to improve these systems, in
       particular data collection and verification processes across the business. This supports
                                                                                                  Qube (LCR) facility, Blackwater
       reporting against the Sustainable Development Goals
     o Implemented initiatives to reduce emissions with additional expansion of the Euro 5,
       6 truck fleet and the expansion of renewable energy installation. Work will continue
       into FY 22 to further increase the installation of renewable energy across existing
       sites.

                                                                                                                                    6
FY 21 Full Year Highlights
 Record underlying NPATA achieved
                                      Underlying NPATA (+31.7%)                                                                     •   Record underlying earnings (NPATA) delivered by Qube in FY 21 despite
                                                                                                                                        ongoing COVID-19 challenges and some impact from Chinese trade
                                                                                                                     159.6              sanctions
     165
                                                                          (2.7)          (3.9)          10.0                        •   Materially higher contribution from the Operating Division reflecting
     150                                                   16.3
                                             (3.5)                                                                                      high volumes across most activities, particularly motor vehicles (trending
     135                       22.2                                                                                                     back to pre COVID-19 levels in the second half of the year), grain,
                 121.2
     120                                                                                                                                forestry, bulk and containers

     105                                                                                                                            •   Patrick’s profitability benefitted from increased volumes, some
                                                                                                                                        productivity improvement, as well as a full period impact of higher
$ million

            90                                                                                                                          landside charges and increased ancillary charges. This was partly offset
            75                                                                                                                          by costs associated with industrial action and adverse weather
            60                                                                                                                      •   Lower interest costs were the result of lower base rates, the full year
                                                                                                                                        benefit of the FY 20 capital raising and proceeds from the sale of Minto
            45
                                                                                                                                        Properties
            30
                                                                                                                                    •   The Property Division’s reduced contribution compared to the prior
            15                                                                                                                          corresponding period reflected the absence of earnings from Minto
             0                                                                                                                          Properties following its sale in mid- September 2020, increased losses
                 FY 20      Operating Property Patrick***   Other    Corporate Net interest                           FY 21             from Prixcar (Other Associates) due to record low vehicle storage
                            Division* Division**          Associates   costs      costs                                                 volumes, and higher Corporate Costs (mainly attributable to higher D&O
                                                                                                                                        and employment costs).
    *Note: AAT and Quattro were classified under the Operating Division in both FY 21 and the pcp in the chart above for
    comparative purposes. The movement in earnings contribution from the Operating Division in the chart above excludes the
    impact of divisional Associates.
    **Note: The movement in earnings contribution from the Property Division in the chart above excludes the impact of divisional
    Associates.
    ***Note: Qube’s share of Patrick’s underlying NPAT (pre-amortisation) and post tax interest income on shareholder loans.

The underlying information excludes certain non-cash and non-recurring items in order to more accurately reflect the underlying financial performance of Qube. References to
‘underlying’ information are to non-IFRS financial information prepared in accordance with ASIC Regulatory Guide 230 (Disclosing non-IFRS financial information) issued in                                     7
December 2011. Non-IFRS financial information has not been subject to audit or review.
FY 21 Full Year Highlights
Reflecting high volumes across most of Qube’s core markets
12-month rolling container trade growth (TEU) at 4 ports Exports of Australian grains New vehicle sales in Australia
12% 35,000 +43.8% vs +135.3% vs
FY 18 :+8.3% Volume growth vs pcp
FY 21 :11.4% pcp pcp
1,400
10% (2.9x GDP) (9.1x GDP) 30,000
+1.3% vs pcp
8% 1,200
-31.7% vs -7.8% vs pcp
New vehicle sales ('000)
25,000 +9.6% vs pcp
Grain exports (kt)
6% pcp
Qube expected long term growth (3%-4%) 1,000 -13.7% vs pcp
4% 20,000
-37.2% vs 800
2% -7.2% vs
pcp
15,000 pcp
600
0% FY 19 :+1.9%
-2% (0.9x GDP) 10,000 400
-4% FY 20 :-4.5%
5,000 200
(-0.3x GDP*)
-6%
0
Jun-18
Jun-20
Jun-19
Jun-21
Dec-17
Dec-19
Dec-18
Dec-20
Sep-18
Sep-19
Sep-20
Mar-18
Mar-19
Mar-20
Mar-21
0
FY 18 FY 19 FY 20 FY 21
FY 17 FY18 FY19 FY20 FY21
Source: Port Authorities, Australian Bureau of Statistics, FY 22 Federal Budget, Qube analysis. Source: ABARES (June 2021), Qube analysis. Grains Source: Federal Chamber of Automotive Industries, Qube
*Note: Based on forecast real GDP growth of 1.25% in FY 21 (per FY 22 Federal Budget). include barley, corn, grain sorghum, oats, rice and wheat. analysis.
Price index (AUD) – Base metals and bulk commodities 12-month rolling quantity of logs (forestry products) exports from New Zealand
180
23,000,000
160 22,000,000
140 21,000,000
(m3)
120 20,000,000
100 19,000,000
80 2019/20 18,000,000
60
average = 100 17,000,000
Jun-17
Jun-19
Jun-20
Jun-18
Dec-17
Dec-18
Dec-19
Dec-20
Mar-18
Sep-18
Mar-21
Sep-17
Mar-19
Sep-19
Mar-20
Sep-20
Jun-18 Sep-18 Dec-18 Mar-19 Jun-19 Sep-19 Dec-19 Mar-20 Jun-20 Sep-20 Dec-20 Mar-21 Jun-21
Base metals* Bulk commodities**
Source: Reserve Bank of Australia. Source: NZ Ministry of Primary Industries
*Note: Includes aluminium, lead, copper, zinc, nickel. Note: The latest available data is up to March 2021. 8
**Note: Index based on export price movements. Includes iron ore and coal (metallurgical and thermal).FY 21 Full Year Highlights
Focus on Technology and Innovation
Technology and Innovation
• Qube has a demonstrable track record over many years of investing in and leveraging technology to deliver innovative, reliable and safe logistics supply chain solutions to its customers
• Qube’s Group Innovation Committee chaired by the Managing Director brings together senior executives from across the organisation to develop strategies, leverage developed solutions,
determine the investment and resources priorities that will benefit customers, and improve safety and service delivery. This Committee actively considers initiatives ranging from early-
stage concepts through to operations-ready projects
• Qube has made significant investment in information technology in recent years to manage the risks associated with cyber security
• In response to the COVID-19 challenges Qube adopted face recognition technology and developed site access control and body temperature checks interfaces to enhance the functionality
of the system
• Efficiencies are at the core of the operations and as such Qube is developing the next generation of port precinct high productivity vehicles
• Qube is investing in a “Smart-Warehouse” platform that provides the ability to scale robotics and automation in the warehouse space dependent upon the customers requirements
• Qube is in the process of adopting/investing in visual reality learning applications to assist with closing the skills shortage in some regions/sectors
• Sustainability and CO2 reduction initiatives are Qube’s core innovation opportunity areas. Qube is investing in assets and technologies consistent with reducing carbon emissions which
included alternate fuel options (inject technology/diesel alternatives), vehicle enhancements technologies (Smart-Truck) and seeking alternative power sources (battery) for heavy
vehicles.
9FY 21 Full Year Highlights
Indicative Revenue Segmentation – Operating Division (by region)
Operating division revenue by region
FY21 FY20
Others* 2.2% Others* 1.6%
NZ 8.0% NZ 6.1%
NT 1.1%
NT 1.9% QLD 21.9% SA 5.4% QLD 23.9%
SA 5.2%
WA 27.5%
WA 27.8% NSW 18.4%
NSW 17.0%
TAS 1.7% VIC 13.0% TAS 2.4% VIC 15.1%
Note: Revenue contribution from AAT included in the charts in both periods.
Note*: Others comprise Global Forwarding and South East Asia
• The division remained highly diversified by customer, product, service and geography
• In FY 21, the top 10 customers across the division represented approximately 19% of the Operating Division’s total revenue and included mining companies, energy
companies, shipping lines, retailers and manufacturers. No single customer represented more than 2.5% of the total divisional revenue
• From a geographical perspective, Qube is well diversified with Western Australia being the largest single region representing 27.8% of total divisional revenue. The largest
four regions within the Operating Division (being WA,QLD,NSW,VIC) collectively represented around 81.1% of divisional revenue. This balanced outcome reflects the higher
weighting of the Logistics activities to New South Wales, Victoria and Queensland while the Ports & Bulk activities are weighted more heavily in Western Australia and
Queensland.
The underlying information excludes certain non-cash and non-recurring items in order to more accurately reflect the underlying financial performance of Qube. References to ‘underlying’
information are to non-IFRS financial information prepared in accordance with ASIC Regulatory Guide 230 (Disclosing non-IFRS financial information) issued in December 2011. Non-IFRS 10
financial information has not been subject to audit or review.FY 21 Full Year Highlights
Indicative Revenue Segmentation – Logistics
Logistics revenue by region
• Key positive contributors to the Logistics revenue and
FY21 FY20 geographical/industry mix included:
SA Global Forwarding SA Global Forwarding
8.0% 1.6% 8.8% 1.7% o Increased revenue contribution from grain related
QLD QLD activities (NSW & Agriculture) comprising bulk and
WA
23.6% 23.0% containerised haulage, grain storage and loading
10.4% WA (benefitting from the Quattro acquisition in FY 20 as well
10.9%
as a stronger grain harvest generally)
o Increase in shipping/terminal (QLD) related revenue
from container volume growth and new contract wins
VIC
o Increased food processing and manufacturing revenue
22.8% VIC from volume increases and new contract wins across the
NSW 25.9% NSW
29.7%
east coast
33.6%
• Western and South Australian operations provided
another solid performance across all of their capital city
Logistics revenue by industry and regional operations
FY21 Infrastructure and project Shipping/ FY20 Infrastructure and project • Decrease in VIC revenue due to multiple lockdowns and
works 6.4% Terminal works 8.5% Shipping/ temporary closures of some of Qube’s manufacturing
Freight 17.1% Terminal customers’ operations in the first half of the year
forwarders Freight 16.2%
8.3% forwarders • Top 10 Logistics customers represent around 12% of the
8.1% Operating Division’s total revenue and include retailers,
Retail Retail manufacturers, shipping lines, food processors, grain
Manufacturing
12.5% 14.2% traders and container management specialists.
21.7%
Manufacturing
Notes:
21.8%
• To ensure comparability between periods, the FY20 data in
Mining Agriculture this presentation has been adjusted to be consistent with
Mining Agriculture
5.0% 16.2% the FY21 reporting structure.
Food processing 5.7% 14.1%
12.8% Food processing 11.4%
The underlying information excludes certain non-cash and non-recurring items in order to more accurately reflect the underlying financial performance 11
of Qube. References to ‘underlying’ information are to non-IFRS financial information prepared in accordance with ASIC Regulatory Guide 230
(Disclosing non-IFRS financial information) issued in December 2011. Non-IFRS financial information has not been subject to audit or review.FY 21 Full Year Highlights
Indicative Revenue Segmentation – Ports & Bulk
Ports & Bulk revenue by region • Key positive contributors to the Ports & Bulk include:
FY21 South East Asia o Revenue growth in New Zealand reflecting high volumes and
FY20 NZ South East Asia benefit from current and prior year’s acquisitions (forest
2.7% QLD 1.6%
NZ 10.6% QLD
19.5% NT products). The forestry contribution would have been
14.1% 23.4%
2.0% stronger, if not for the trade sanctions from China resulting in
NT SA lower log exports from Australian forestry customers
3.2% 3.4%
o Increase in revenue contribution from WA reflecting higher
NSW
SA contributions from bulk logistics and export port loading
5.8%
3.6% activities relating to iron ore, lithium and other base metals
NSW
6.0% including nickel and copper. This more than offset a reduction
VIC
of some products including coal, lime and bulk scrap exports
6.7%
WA across WA and QLD
WA TAS 40.6% VIC 8.2%
2.9% o Increase in energy related activities driven by higher
41.5%
contribution from Shell (QLD and NT) as well as at BOMC and
TAS 4.2% Qube International (South East Asia). This offset COVID-19
related delays to renewable energy, oil and gas projects
Ports & Bulk revenue by product • COVID-19 also impacted Qube’s LCR operations in Papua New
FY21 Infrastructure Guinea which were temporarily closed for part of the period
Iron Ore FY20 Infrastructure Iron Ore
Other*** 7.3% 9.5% 6.8%
7.7%
7.1% Other base • Top 10 Ports & Bulk customers represent around 18% of the
Other base Other***
7.7%
metals*11.0% Operating Division’s total revenue and include mining
metals* 11.9%
Ancilliary Services 3.7% companies, shipping lines as well as energy and forestry
Ancilliary Services
Lithium products companies.
Facility Operations 3.3% 4.4%
Lithium 4.1%
5.0% Facility Operations Notes:
Renewable Energy 7.5% 3.2% Mineral
Mineral Sands 8.0%
• To ensure comparability between periods, the FY20 data in
Renewable Energy 5.6% this presentation has been adjusted to be consistent with the
Vehicles/ Machinery/ Sands 7.0%
Boats/ WHSS 3.8% FY21 reporting structure.
Vehicles/ Machinery/ Boats/ Coal 6.9%
Coal 5.7% WHSS 3.5%
Gold 0.5% Gold 0.6% Notes:
Forest Products
Lime 2.2% Forest Products Lime 3.8% * “Other base metals” include copper, nickel and zinc.
15.4%
10.6% Manganese 4.4% ** “Bulk Scrap and Others” include cement, frac sands, talc, fertilisers
Bulk Scrap & Others** 7.9% Manganese 4.0% Bulk Scrap & Others** 9.9% and aluminium.
*** “Other” include containers, general cargo, metal products and
The underlying information excludes certain non-cash and non-recurring items in order to more accurately reflect the underlying financial performance sundry income. 12
of Qube. References to ‘underlying’ information are to non-IFRS financial information prepared in accordance with ASIC Regulatory Guide 230
(Disclosing non-IFRS financial information) issued in December 2011. Non-IFRS financial information has not been subject to audit or review.FY 21 Full Year Highlights
Property Division
MLP - Property MLP - Terminals
Development IMEX Terminal
• Precinct infrastructure on Moorebank Precinct East (MPE) was largely completed and precinct infrastructure on
Moorebank Precinct West (MPW) has progressed • The IMEX Terminal has been operating in a start-up manual mode in parallel with the construction of the
automated terminal
• The construction of Warehouse 5 was completed in early Q3 FY 21 and is now occupied by customers of Qube
Logistics • Volumes through the manual IMEX Terminal have been modest, with only around 18,300 TEU through the
terminal during FY 21. A key reason for the low volumes was the recent NSW Government policy to permit
• Works have also continued on the infrastructure to meet the delivery requirements for the new Woolworths higher capacity A-Double vehicles to operate at Port Botany, which has reduced the competitiveness of rail
warehouses relative to road to the Moorebank catchment area
Leasing • The development of the automated IMEX terminal continued during the period, and is expected to be
• Increased warehousing income during the period resulting from: completed and operational in Q3 FY 22. At 30 June 2021, Qube has invested approximately $305 million on the
o Full period contribution from tenants that moved into the MLP during FY 20 leasing part of Warehouse 3 and 4 IMEX Terminal (excluding land, precinct infrastructure and capitalised interest) and expects to spend an
o Partial period contribution from new tenants that moved into the MLP during FY 21 occupying the residual additional $80 million to complete the automation
space available in Warehouse 3 and 4 and the recently completed Warehouse 5.
• Towards the end of FY 21, Qube undertook a revised forecast of the expected volumes through the IMEX
• Active discussions underway (in conjunction with LOGOS) with multiple prospective tenants for the site Terminal which reflects the slower ramp up in volumes compared to Qube’s business case. As a result, the high
fixed costs associated with the automation are not expected to be recovered in the short term, leading to
Fair value gain negative earnings and operating cashflow until volumes reach the necessary scale to generate the target
• Qube recognised a fair value gain on the MLP investment property of $195.6 million (pre-tax) at 30 June 2021. sustainable earnings and positive cashflow
Rail mode share to & from Port Botany • As a result of a slower ramp up in volumes compared to previous expectations and the need to assess IMEX cash
24% Peak market share of 22.2% (Jun-17) flows separately from the broader MLP cash flows due to the monetisation transaction, Qube recognised an
22%
20%
impairment for the IMEX Terminal of $156.2 million (pre-tax) at 30 June 2021. The impairment is non-cash and
18% will not impact the actual operations of the IMEX Terminal nor Qube’s continued belief in the long-term
16% strategic value and expected volumes through the MLP IMEX Terminal
14% Lowest market share of 14.2% (Dec-20)
12%
10% Interstate Terminal
• During the period, minor capex was spent on the Interstate terminal, relating to terminal design.
Monthly market share 12-month rolling average market share
• There is currently a disagreement with MIC regarding the date for completion of Stage 1 of the Interstate
Source: Transport for NSW, Qube analysis. Terminal which is subject to extension for relief events. MIC has given notice that in its view an Event of Default
for failing to complete Stage 1 of the Interstate Terminal by March 2021 has occurred. To resolve this
Minto Properties disagreement, Qube is in active discussions with MIC to agree a plan to complete Stage 1 of the Interstate
Terminal by an agreed date. This is expected to be resolved as part of the overall agreement to secure MIC’s
consent to the LOGOS transaction. These discussions also involve potential changes to the ownership and
• Qube’s investment property in Minto, NSW (Minto Properties) was sold to Charter Hall in mid-September 2020. funding of the Interstate Terminal which could result in Qube owning and funding less than 100% of this asset.
13FY 21 Full Year Highlights
Patrick – Financial Highlights
Distributions to Qube of $120 million • Strong increase in underlying earnings contribution to Qube was underpinned by volume growth, improved
Qube’s share of Dividend $34.2m volume mix, continued diversification of the revenue streams and some improvement in productivity
Underlying revenue across Patrick’s terminals
underlying NPAT
$679.5 million Interest income (pre-tax) $26.3m
+8.8% (100% basis) +47.2% pre-amortisation • Market volume growth was +8.8% (lifts) in FY 21 compared to pcp and were above pre-COVID-19 levels
(50%)*
$50.8 million Shareholder loan repayment $59.5m • Patrick’s volumes (lifts) in FY 21 were +3.3% higher than pcp. During the period, Patrick extended some of
its key contracts until end of CY 23 and secured a number of new services that have entered the market
*Note: Based on Qube’s share of Patrick’s underlying NPAT (pre-amortisation) and post tax interest
• Patrick increased its market share in Fisherman Island and East Swanson Dock although overall national
income on shareholder loan. market share declined slightly during the period to 44% (lifts), mainly due to the impact of protected
industrial action in September and loss of a service impacting the Port Botany market share as well as the
FY 21 volume growth vs pcp Patrick market share loss of market share in Fremantle following rationalisation of services
15.0% 48% • Margins benefitted from:
11.4% 46%
8.8% 46% 45%
10.0% o Increased volumes compared to pcp which generated high incremental earnings given Patrick’s
5.8% 44%
44% 43% relatively high fixed cost base
5.0% 3.3%
42% o Increased storage revenue from higher yard utilisation
0.0% 40%
o Favourable volume mix across terminals and improved productivity levels
TEU growth Lift growth TEU Lift
Market (4 ports) Patrick FY20 FY21 o Full year benefit from the increase in landside and ancillary charges implemented in March 2020 and
partial year benefit of the increases in charges implemented from March 2021
Indicative volume (lift) segmentation - Indicative volume (lift) segmentation - • Negotiations remain ongoing regarding the new Enterprise Bargaining Agreement
FY21 FY20
East • In May 2021, Patrick completed the extension of $555 million of debt facilities by between 2 to 5 years to
Fremantle Fremantle Swanson new maturity dates ranging from March 2024 to March 2027, and upsized its debt facilities by $100 million
East
14.3% 17.7%
Swanson Dock
Fisherman Dock 27.0% • Patrick distributed $120 million to each of its shareholders during the period, comprising dividends,
Island 30.6% Fisherman interest income and repayment of shareholder loans. This was driven by Patrick’s strong operating
20.5% Island cashflow during the period as well the additional debt facilities established in the period which were
Port 17.8% Port applied to a partial repayment of the shareholder loans.
Botany Botany
34.6% 37.6%
The underlying information excludes certain non-cash and non-recurring items in order to more accurately reflect the underlying financial performance of Qube. References to ‘underlying’
information are to non-IFRS financial information prepared in accordance with ASIC Regulatory Guide 230 (Disclosing non-IFRS financial information) issued in December 2011. Non-IFRS 14
financial information has not been subject to audit or review.FY 21 Full Year Highlights
Patrick – Operational Highlights
• Performance improvement across terminals – Crane productivity improved in East Swanson Dock and Fisherman Island, despite disruption from industrial action
• New cranes – Two Liebherr cranes were successfully delivered in Port Botany and Fisherman Island, currently in commissioning and endurance testing phase
• New container weighing system – Was introduced in Fisherman Island during FY 21. Expected to be rolled out across the other terminals in the next 6 to 12 month period and expected to help
drive safety outcomes
• Port Botany Rail Development – Phase 1 of the construction was completed in December 2020 on time and budget. Following a period of commissioning and testing, the automated rail terminal
commenced operations at the end of June with all trains now being serviced by the automated rail terminal and the manual operations ceasing. The Phase 2 civil construction works have now
commenced, and when fully complete in mid 2023 these works will provide a significant increase to rail windows and rail efficiencies at Port Botany
• Navis N4 Terminal Operating System – Project was successfully finalised nationally, including rollout in Port Botany in August 2020 and Fisherman Island in November 2020 with no operational
disruptions associated. The project has already resulted in costs savings in FY 21 from efficiencies and workforce synergies with further savings forecast in FY 22
• Lease at East Swanson Dock and rail project – Lease agreement was finalised in September 2020 securing a long term strategic footprint at Port of Melbourne and the adjoining logistics site at
Coode Road until 2066 where rail capacity will be developed as part of Port of Melbourne’s Port Rail Transformation Project. Construction is due to commence in FY 22.
• Fremantle terminal’s lease and redevelopment – New lease was finalised in January 2021 for an initial 10-year term from January 2021 with an option for the extension at the Fremantle Port
Authority’s (FPA) discretion. Patrick’s development application was approved by FPA, with redevelopment expected to commence in FY 22.
Patrick’s Sydney Rail Operations now handled through the automated AutoRail terminal. Commissioning of new Liebherr crane. 15Key Financial Information
Qube Statutory Results
FY 21 FY 21 FY 20
(excluding (including (including
Discontinued
discontinued discontinued discontinued Change (%)
operations*
operations) operations) operations)
($m) ($m) ($m)
Revenue 1,962.9 214.5 2,177.4 1,902.0 14.5%
EBITDA 181.3 199.2 380.5 429.5 (11.4%)
Depreciation (223.3) (0.6) (223.9) (214.8) (4.2%)
EBITA (42.0) 198.6 156.6 214.7 (27.1%)
Amortisation (10.8) - (10.8) (12.1) 10.7%
EBIT (52.8) 198.6 145.8 202.6 (28.0%)
Net Finance Costs (32.4) (4.9) (37.3) (65.0) 42.6%
Share of Profit of Associates 14.1 - 14.1 (7.1) (298.6%)
Non- Controlling Interest (0.2) - (0.2) 0.9 (122.2%)
Profit After Tax Attributable to Qube (44.0) 135.6 91.6 87.5 4.7%
Profit After Tax Attributable to Qube Pre-Amortisation** (26.9) 135.6 108.7 104.5 4.0%
Diluted Earnings Per Share (cents) (2.3) 7.1 4.8 5.2 (7.7%)
Diluted Earnings Per Share Pre-Amortisation (cents) (1.4) 7.1 5.7 6.2 (8.1%)
Full Year Dividend Per Share (cents) 6.0 - 6.0 5.2 15.4%
EBITDA Margin 9.2% 10.0% 17.5% 22.6% (5.1%)
EBITA Margin -2.1% 10.0% 7.2% 11.3% (4.1%)
*Note: On 5 July 2021, Qube announced that its intention to sell the warehousing components of the Moorebank Logistics Park project to a
consortium led by LOGOS Property Group. As a result, the earnings associated with these assets were classified under discontinued operations
in the FY 21 financial statements. These mainly comprise the fair value gains on the MLP investment property of $195.6 million.
**Note: Profit After Tax Attributable to Qube adjusted for Qube’s amortisation and Qube’s share of Patrick’s amortisation.
16Key Financial Information
Qube Underlying Results
Underlying earnings exclude the following key items which have been
FY 21* FY 20* included in statutory earnings:
Change (%)
($m) ($m)
• Net fair value gains of $202.1 million (pre-tax) relating to Qube’s
investment properties in Moorebank ($195.6 million) and Russell
Park ($6.5 million)
Revenue 2,032.4 1,883.6 7.9%
EBITDA 325.6 290.9 11.9% • Impairment of $217.1 million (pre-tax), mainly relating to the
Depreciation (142.7) (130.6) (9.3%) IMEX Terminal ($156.2 million)
EBITA 182.9 160.3 14.1% • Lease accounting standard (AASB 16) related items which
Amortisation (10.8) (12.1) 10.7% reduced Qube’s statutory NPAT by $32.9 million*
EBIT 172.1 148.2 16.1%
Net Finance Costs (3.5) (17.4) 79.9% • JobKeeper repayment expense of $16.9 million (pre-tax)
Share of Profit of Associates 24.7 11.7 111.1% • Fair value gain on derivatives of $5.6 million (pre-tax)
Non- Controlling Interest (0.2) 0.9 (122.2%)
Profit After Tax Attributable to Qube 142.5 104.2 36.8% *Note: Based on a pre-tax impact of $41.0 million (including $14.0
Profit After Tax Attributable to Qube Pre-Amortisation** 159.6 121.2 31.7% million relating to Qube’s share of Associates NPAT) which is
equivalent to $32.9 million when tax effected at 30%).
Diluted Earnings Per Share (cents) 7.5 6.2 21.0%
Diluted Earnings Per Share Pre-Amortisation (cents) 8.4 7.2 16.7%
Full Year Dividend Per Share (cents) 6.0 5.2 15.4%
EBITDA Margin 16.0% 15.4% 0.6%
EBITA Margin 9.0% 8.5% 0.5%
*Note: The underlying results do not adjust for discontinued operations.
**Note: Profit After Tax Attributable to Qube adjusted for Qube’s amortisation and Qube’s share of Patrick’s amortisation.
The underlying information excludes certain non-cash and non-recurring items in order to more accurately reflect the underlying financial performance of Qube. References to
‘underlying’ information are to non-IFRS financial information prepared in accordance with ASIC Regulatory Guide 230 (Disclosing non-IFRS financial information) issued in 17
December 2011. Non-IFRS financial information has not been subject to audit or review.Key Financial Information
Capital Expenditure
FY 21 capex overview
• Total gross capex of $673.8 million and net capex of around $461.4 million* in the period, including the following items:
o Capex associated with contract wins (BlueScope (due to start in Jan-22), BHP Nickel West and Salt Lake Potash, Atlas, Karara Mining, Ventura Minerals)
o Several acquisitions
o Procurement of equipment across the Operating Division
o Maintenance capex
o Progress with the MLP development including precinct infrastructure on MPW, the construction of Warehouse 5 on MPE and progress with the IMEX automation
*Note: Net of disposal of assets of $212.4 million which mainly include proceeds associated with the sale of Minto Properties.
Gross cash capex by category Gross cash capex by division
400
Maintenance 350
Other 17.6% 300 $118.9m
250
growth Acquisitions
$ million
200
26.3% 11.7%
150 $304.1m
$250.8m
100
50
0
MLP development Operating Division Property Division
44.4%
Maintenance Growth
18Key Financial Information
Capital Expenditure – Acquisitions
Acquisitions expanding Qube’s capabilities Acquisitions expanding Qube’s capabilities and geographical presence
Agrigrain (Sep-20) – Logistics Les Walkden (Mar-21) – Ports
• Acquisition of grain storage and handling equipment and • The business provides timber harvesting, chipping and
properties for grain haulage services in Australia’s Green Triangle region
• Coonamble property abuts the Coonamble railway enabling
efficient rail movement of stock to Port Botany, Port Bluewood (Mar-21) – Bulk
Kembla (Quattro) and Port of Newcastle
• The business provides timber harvesting, chipping and
• Coonamble facility to benefit from the Australian haulage services in the Albany region (WA).
Government’s Inland Rail Project
• These acquisitions allow Qube to expand its supply chain
• This acquisition allows Qube to expand its regional logistics capabilities for the forestry sector, expansion of Qube’s
services with the entry into the agriculture storage and geographical presence and increased product
handling sector diversification.
WWL & PHL (Jan-21) – Ports Acquisition expanding Qube’s geographical presence
MDG Contracting Group’s Tasmanian mining services
• These businesses provide log transport logistics solutions
in the East Coast of the North Island of New Zealand
business (Jun-21) – Ports
• The business provides bulk haulage services to the mining
• This acquisition allows Qube to expand its forestry logistics
sector and also holds capabilities in the delivery of
capability, enabling Qube to provide a complete logistics
contract mining
solution from the forests to the vessels via Qube’s ISO
business marshalling and stevedoring operations
• This acquisition allows Qube to expand its geographical
presence in Tasmania.
Note: Total Enterprise Value of around $95 million for these acquisitions implying an average proforma EV/EBITDA multiple of less than 4.0x (based on Year 1 post acquisition EBITDA).
19Key Financial Information
Balance Sheet & Funding
Key metrics Debt facilities maturity profile at 30 June 2021
Weighted average
1,400
Cash and
maturity of 3.0 years
Net assets Net Debt* Leverage 1,200
attributable to Undrawn Debt 1,000 at 30 June 2021
ratio***
$ million
800 675
Qube Facilities**
600
$3,361.8 million $1,388.4 million $626.2 million 29.2%
400 150
200 305 320
160 240 101
*Note: Excluding lease liabilities. 0 51 38
FY21 FY22 FY23 FY24 FY25 FY26 FY27 FY28 FY29 FY30
**Note: Net of bank guarantees drawn.
***Note: Net debt / (Net debt+ Equity) where net debt excludes lease liabilities. Subordinated Loan Notes CEFC Facliity USPP Bank Facilities
Funding initiatives in FY 21 Total net debt
• During FY 21, Qube repaid $200 million of short term bridge facilities from the proceeds of the
1,800 Total: $1388.4 million
sale of Minto Properties which was completed in mid-September 2020. 1,600 Total: $1193.3 million
1,400
• Qube also extended the maturity of $280 million of bilateral bank facilities with extension of 1,200
an additional $100 million facility for a further two years being well progressed at period end. 1,000
$ million
800 1,514.2
1,417.5
600
• Qube also progressed the MLP monetisation process which is expected to result in Qube Total: $28.4 million
400
receiving net proceeds of c.$1.36 billion on Financial Close (before tax, transaction costs, other 200
adjustments and excluding deferred consideration) 0 154.2
(224.2) (125.8) (125.8)
-200
• Post completion of the MLP monetisation, Qube will be very well positioned to reduce its -400 Jun-20 Jun-21 Jun-21 (proforma)*
debt, pursue accretive growth opportunities and consider potential capital management Debt Cash
initiatives.
*Note: Including proceeds from MLP monetisation to be received on Financial Close (before tax,
transaction costs, other adjustments and excluding deferred consideration) 20Key Financial Information
Cashflow
Change in Net Borrowings for Twelve Months to 30 June 2021
1,600
1,388.4
1,400
35.4 47.0
1,193.3 54.5 Sub Note
1,200 37.1
305.0
Sub Note
1,000 (319.6) 463.5
305.0
$ million
800 (122.8) Senior Debt
Senior Debt (net of cash)
600
(net of cash) 1,083.4
400 888.3
200
0
Net Borrowings Operating Distributions Net cash Net Interest Tax Dividends Other*** Net Borrowings
at Jun 20 Cashflow* Received from capex** Paid Paid Paid*** at Jun 21****
Associates (excl interest
(including interest income from
income from Patrick) Patrick)
Notes:
*Operating cashflow includes operating lease payments which are classified in accordance with AASB 16 in Qube’s statutory cashflow statement as a combination of payments of
interest and principal.
** Net cash capex is net of disposal of assets of $212.4 million mainly comprising the proceeds from the sale of Minto Properties during the period.
*** Other mainly includes $23.7 million in interest rate hedge termination costs as well as $14.8 million of borrowings assumed as part of the WWL/PHL acquisition which were repaid
during the period.
**** Net borrowings exclude capitalised debt establishment costs ($7.4 million) and are net of the value of the derivatives which fully hedged the USD denominated debt ($23.2 million).
21Moorebank Monetisation Process Update
Key Highlights
• Sales price of c.$1.67 billion before tax, transaction costs and other adjustments
• Consideration of c.$1.36 billion payable on financial close and c.$312 million deferred, subject to several completion adjustments including working capital and for
warehouse and precinct infrastructure capital expenditure spent compared to the forecast capex to 30 June 2021 and such further capital expenditure until financial
close
• Part of the deferred amount is paid to fund construction of Stage 1 of the Interstate Terminal and the balance is payable upon receipt of certain planning approvals for
the remainder of the warehousing development
• Qube well positioned to prudently manage the risks associated with the deferred payments and other transaction obligations
• The LOGOS consortium to fund and deliver the balance of development for the MLP Property Assets including funding of the Woolworths warehouse distribution
facilities. LOGOS will also reimburse Qube for capex incurred by Qube relating to the MLP Property Assets from 1 July 2021 until completion of the transaction
• Qube to retain ownership of the intermodal rail terminals
• Transaction documents include alignment principles to align the long-term interests and objectives between the property leasing and rail terminal and logistics activities
• Transaction completion is expected in Q4 CY 21 and is subject to satisfaction of several conditions including FIRB approval, MIC approvals to the change in ownership,
resolution of a number of material issues with MIC and other conditions.
• Given the strategic importance of the MLP to Qube, the transaction will only proceed if those approvals and the satisfaction of those conditions are deemed by the
Board to be in the best interest of Qube shareholders.
22Moorebank Monetisation Process Update
Rationale and Key Benefits
Rationale
• Enables Qube to realise the substantial value that has been created through ownership, development and sizeable investment in the MLP by Qube since its initial
investment in December 2007
• Removes project development risk from Qube and significantly reduces Qube’s future capital requirements
• Takes advantage of favourable demand environment for quality industrial properties at a valuation that appropriately reflects premium future rents that may be realised
at MLP
• Transaction structure provides ongoing alignment between warehouse and logistics activities on-site to support future growth in rail and IMEX revenue for Qube.
Key Benefits
• Returns Qube to a high cash generative, logistics focussed operation with strong market positions and sustainable competitive advantages
• Enables debt reduction and provides substantial capital to deploy into accretive acquisitions and growth capex at higher return metrics than for industrial property
development
• Supports a more stable earnings per share growth profile compared to the high capital, longer return profile associated with MLP
• Provides the capacity for potential capital management initiatives (subject to assessing Qube’s expected funding requirements for short-medium term growth capex).
23Moorebank Monetisation Process Update
Process to completion
Process to completion
• The transaction is currently expected to be completed in Q4 CY 21 subject to satisfaction of several conditions including:
o FIRB approval
o MIC consent (including resolution of a number of material issues)
• Qube, LOGOS and MIC are working constructively to address the consent requirements in a mutually acceptable manner,
and with overall outcomes that Qube believes is in the best interests of its shareholders
• Qube, LOGOS and MIC are finalising appropriate governance arrangements for the ongoing management and
development of the project post completion
• Qube is working actively with LOGOS to secure additional tenants for MLP that meet the parties joint objective of
benefitting from efficient IMEX (or Interstate) terminal activities (and are therefore expected to utilise the rail terminals in
a meaningful respect).
MPW site including future site of the Interstate Terminal
Post completion
• The main ongoing involvement of Qube will be through its ownership and operation of the IMEX and Interstate Terminals,
its warehouse lease (Qube Logistics), and through the operation of the Alignment Deed (which is intended to promote
ongoing alignment between warehouse and logistics activities)
• Qube estimates that its remaining total capital expenditure obligations at MLP will be in the order of $200 million to $300
million. This expenditure mainly comprises completion of the IMEX automation and Stage 1 of the Interstate Terminal
(and assumes that Qube retains responsibility for funding 100% of the Interstate Terminal). Stage 2 of the Interstate
Terminal will be undertaken subject to future demand
• On a pro-forma basis, at completion, Qube’s net debt at 30 June 2021 would be around $28 million*, providing significant
capacity to fund Qube’s remaining MLP capex commitments, continued investment in Qube’s logistics activities and
potential capital management initiatives
• The Property Division will be discontinued. From 1 July 2021, the Terminal activities (plus TQ Holdings and Beveridge) are
being managed and reported within the Operating Division.
IMEX Terminal
*Note: Including proceeds from MLP monetisation to be received on Financial Close (before tax, transaction costs, other adjustments 24
and excluding deferred consideration)Qube Post-Monetisation
Strongly positioned to continue to expand its core logistics business, while retaining exposure
to long-term growth in container volumes at MLP through terminal and logistics activities
Operating Division Patrick (50%)
Qube Logistics & Infrastructure Qube Ports & Bulk
• Qube owns a 50% interest in Patrick, one
• Offers integrated solution suite covering multiple aspects of the supply • Provides broad range of logistics services for the import and export of
of two major established national
chain with a focus on containerised import and export cargo mainly non-containerised freight
operators providing container stevedoring
• Operates nationally across Australia including in all capital city ports • General stevedoring of bulk and break bulk products including vehicles services in the Australian market
• Has an expanding strategic footprint in inland metropolitan and country • Forestry export supply chain services for logs and woodchip • Holds long term lease concessions for and
regional areas with connections to Australian ports operates shipping container terminals in
• Mining and bulk commodities export supply chain services the four largest container ports in
• Includes AAT, a multi-user facility provider to stevedores and focused on Australia
vehicle imports • Energy logistics services including oil, gas and renewables
• Complements Qube’s other logistics
• Includes Moorebank Terminals which comprise the IMEX and Interstate • National operator, with strategic port facility locations across Australia activities
rail terminals located at the Moorebank Logistics Park
• Overseas operations in New Zealand and South East Asia • Other 50% owned by Brookfield and its
• Includes TQ (100%) for development and operation of a fuel storage managed funds
• Holds investments in NSS (50%) and Prixcar (50%) for logistics services to
terminal
the mining and automotive industries
• Includes option for the potential development of an intermodal freight
terminal and other property development activities at Beveridge (Victoria)
25Vision and Strategy Remains Unchanged
Qube’s vision is to be Australia’s leading provider of integrated
logistics solutions focussed on import and export supply chains
Strategy Market Characteristics Highly Diversified Markets
Deliver operating efficiencies and benefits of economies • Attractive long term growth outlooks (ideally • Containers
of scale through: GDP+)
• Motor vehicles
• Investment in infrastructure, facilities, equipment • Fragmentation and/or inefficiencies in the
and technology logistics supply chains • Rural commodities
• Continuous focus on innovation • Impacted by structural change / decline in local • Bulk resources
manufacturing
• Comprehensive integrated supply chain solutions • Energy
through a single service provider • Geographical advantages
• Forestry products
• Rail and road based solutions delivering best modal • Balanced mix between imports and exports
outcome • Diversified within target markets by customer,
service and geography
• Strategic locations at or near ports and other key
infrastructure
The top 10 customers
of the Operating
Division represent
about 19% of total
revenue of the division
26Qube’s Key Strengths
Focused strategy on core markets with favourable attributes where Qube has expertise
Ownership of key infrastructure and logistics assets delivering a sustainable competitive advantage
Highly diversified business including by customer, product, service and geography
Ongoing focus on innovation and investment to deliver superior outcomes
Prudent approach to business investment decisions and conservative approach to funding growth
Experienced Board and Management team with significant relevant industry expertise
Well placed for continued solid growth in cashflow and underlying NPAT (pre-amortisation), subject to
economic and market conditions
27FY 22 Outlook
Guidance
• Overall solid growth expected in underlying earnings reflecting:
o A full period contribution from the FY 21 acquisitions and growth capex
o Partial period contribution from the FY 22 growth capex
Operating
o Organic growth
Division
o Increased start-up losses from the IMEX operations associated with automation costs (including higher depreciation) from Q3 FY 22
• Potential earnings upside from several earnings accretive acquisitions currently under consideration
• From 1 July 2021, the MLP terminal activities, TQ Holdings and Beveridge will be managed by and reported in the Operating Division rather than the Property Division
Property Division • The Property Division is expected to produce an approximately breakeven result, and post-completion of the monetisation process, will be discontinued
• Strong growth is expected in underlying earnings contribution in FY 22 (comprising interest income on shareholder loans and underlying share of profit)
• Results are expected to benefit from market growth, which is expected to be around 2-3% , the full period benefit of increased and new landside charges introduced during FY
21, as well as continued efficiencies and productivity improvements. These positives are expected to offset cost pressures in parts of the business
Patrick
• This outlook assumes that there are no material adverse costs from industrial action or the finalisation of the enterprise agreement
• Key capex commitments in FY 22 will include the redevelopment of Patrick’s Fremantle terminal, capex associated with the rail project in East Swanson Dock as well as
replacement and additions of equipment across Patrick’s four terminals
Corporate costs • Corporate costs (EBIT) are expected to increase in FY 22 mainly due to MLP transition costs and higher insurance costs
• Indicative forecast capex in FY 22 of around $400 million to $500 million (excluding any potential acquisitions, any capex relating to the MLP assets that will be reimbursed by
LOGOS and monetisation proceeds). Major items to include:
o The IMEX automation and the commencement of the development of the Interstate Terminal
o Capex associated with the BHP Nickel West & Salt Lake Potash contracts, completion of the procurement of locomotives and wagons for the BlueScope contract as well as
Capex investment in new facilities and equipment across the Operating Division and maintenance capex
• The actual level of capital expenditure in FY 22 could vary materially (up or down) from this estimate and will depend on finding suitable opportunities that meet Qube’s key
investment criteria
• Post financial year-end, construction activities at MLP have been impacted by the COVID-19 related lockdown in Sydney which may impact the timing for delivery of certain
works and the total capex spend in FY 22
• Subject to no material adverse change to current conditions in Qube’s markets or in domestic or global economic conditions (including any deterioration due to COVID-19 that
impacts Qube’s customers, markets or operations), Qube expects to report a solid increase in underlying NPAT (pre-amortisation) and underlying earnings per share (pre-
Qube Group
amortisation) compared to FY 21
• This guidance is based on an assumed completion of the monetisation process by 31 December 2021 with the proceeds assumed to be used to pay down debt
Monetisation • Subject to the completion of the monetisation, the Board will assess the appropriate use of the monetisation proceeds which is expected to include debt reduction, investment
proceeds in accretive growth opportunities and potential capital management initiatives.
28You can also read