QUEEN CREEK TOWN CENTER PLAN UPDATE - PHASE I MARKET ANALYSIS & ACTION PLAN
←
→
Page content transcription
If your browser does not render page correctly, please read the page content below
July 2017

PHASE I MARKET ANALYSIS & ACTION PLAN

    QUEEN CREEK
    TOWN CENTER PLAN UPDATE
               Prepared by & in Collaboration with:
                              SWABACK PARTNERS
                               COMMUNITY PLANNING

                     GRUEN GRUEN +ASSOCIATES
                          ECONOMIC/MARKET ANALYSIS

                            DIBBLE ENGINEERING
           TRANSPORTATION PLANNING, PARKING ANALYSIS
                              & COSTING PARAMETERS
TABLE OF CONTENTS
MARKET ANALYSIS AND STRATEGIC ACTION PLAN
           FOR QUEEN CREEK TOWN CENTER PLAN UPDATE

                                                A Report to

                               THE TOWN OF QUEEN CREEK

                                                       From

                                   SWABACK PARTNERS
                    Urban Design, Master Planning & Project Management

                          GRUEN GRUEN + ASSOCIATES
      Urban Economists, Market Strategists, and Land Use/Public Policy Analysts

                                                    July 2017

                                                      C1487

Swaback Partners, pllc + Gruen Gruen Associates + Dibble Engineering + DWG        iii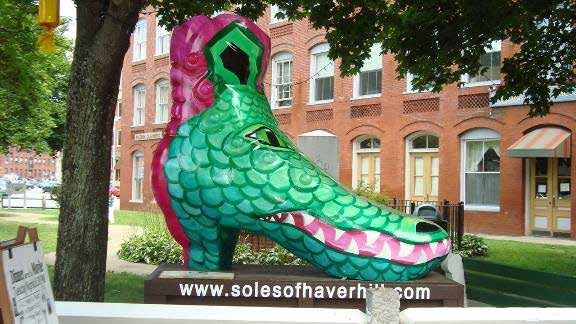
TABLE OF CONTENTS
Chapter												Page

I         INTRODUCTION AND PRINCIPAL FINDINGS AND CONCLUSIONS
      •   INTRODUCTION, PURPOSE, AND BACKGROUND                                1
      •   WORK COMPLETED                                                       2
      •   POPULATION AND HOUSEHOLD GROWTH AND SHIFTS                           2
      •   GROWTH OF RETAIL SUPPLY HAS OCCURRED OUTSIDE OF THE STUDY AREA AND
          IMPLICATIONS FOR DEVELOPMENT OPPORTUNITIES IN THE STUDY AREA         4
      •   PRINCIPAL FINDINGS AND CONCLUSIONS                                   5
      •   STRATEGIC IMPLICATIONS OF RETAIL DEMAND-SUPPLY ANALYSIS –
          “WHAT AND HOW” TO PROGRAM AND BRAND THE STUDY AREA                    9

II        ANALYSIS OF SALES TRENDS
      •   INTRODUCTION                                                         16
      •   TOWN CENTER TAXABLE RETAIL SALES TRENDS                              16

III       STRENGTHS AND WEAKNESSES OF STUDY AREA
      •   INTRODUCTION                                                         19
      •   FACTORS THAT ENCOURAGE DEMAND OR PRIMARY ADVANTAGES                  19
      •   FACTORS THAT DISCOURAGE DEMAND OR PRIMARY DISADVANTAGES              19

IV        POTENTIAL RETAIL SPACE DEMAND IN THE PRIMARY MARKET AREA
      •   INTRODUCTION AND APPROACH                                            22
      •   PRIMARY MARKET AREA                                                  22
      •   ESTIMATE OF RETAIL DEMAND ORIGINATING FROM
          PRIMARY MARKET AREA HOUSEHOLDS                                       23

V         THE ESTIMATED SUPPLY OF RETAIL SPACE AND RELATIONSHIP BETWEEN
          RETAIL SPACE DEMAND AND SUPPLY IN THE PRIMARY MARKET AREA
      •   ESTIMATED SUPPLY OF RETAIL SPACE                                     29
      •   RELATIONSHIP BETWEEN ESTIMATED DEMAND FOR AND
          SUPPLY OF RETAIL SPACE IN THE PRIMARY MARKET AREA                    32

Swaback Partners, pllc + Gruen Gruen Associates + Dibble Engineering + DWG          iv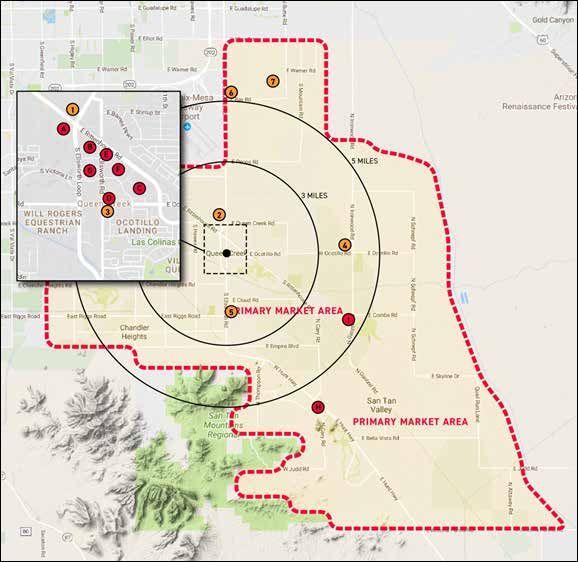
VI        THE DEMAND FOR OFFICE SPACE
      •   OVERVIEW OF MARKET CONDITIONS                                                           35
      •   POSITION IN THE OFFICE MARKET AND DEMANDS SERVED                                        36

VII       THE DEMAND FOR MULTI-FAMILY RESIDENTIAL USES
      •   OVERVIEW OF MARKET CONDITIONS                                                           39

A         APPENDIX
      •   DOWNTOWN HAVERHILL SHOE-LA-BRATION                                                      41
      •   SOURCES                                                                                 44

LIST OF TABLES
      •   I-1 Projected Housing and Population Growth in Queen Creek                               5
      •   II-1 Town Center Taxable Retail Sales Trends                                            16
      •   II-2 Town Center Taxable Retail Sales Per Square Foot Estimate                          17
      •   IV-1 Household and Income Estimates and Projection for Primary Market Area              23
      •   IV-2 Phoenix MSA Average Household Annual
          Expenditure on Retail Goods and Services in 2014-2015                                   24
      •   IV-3 Estimated Retail Demand from Primary Market Area Households                        25
      •   IV-4 Sales Per Square Foot Productivity                                                 26
      •   IV-5 Estimated Supportable Retail Space in Primary Market Area                          27
      •   V-1 Existing Retail Supply Within Town Center and Primary Market Area                   29
      •   V-2 Potential Future Supply of Retail/Commercial Space Within the Primary Market Area   31
      •   V-3 Estimated Balance of Primary Market Area Retail Supply and Demand                   32
      •   VI-1 Queen Creek and Town Center Office Market Condition                                35
      •   VII-1 Queen Creek Multi-Family Market Conditions                                        38

LIST OF MAPS AND FIGURES
      •   MAP I-1: Town Center Study Area                                                          1
      •   FIGURE I-1: Shifts in the Demographic Composition of Queen Creek                         3
      •   MAP IV-1: Primary Market Area                                                           22
      •   MAP V-1: Existing and Planned Retail Supply                                             30

Swaback Partners, pllc + Gruen Gruen Associates + Dibble Engineering + DWG                             v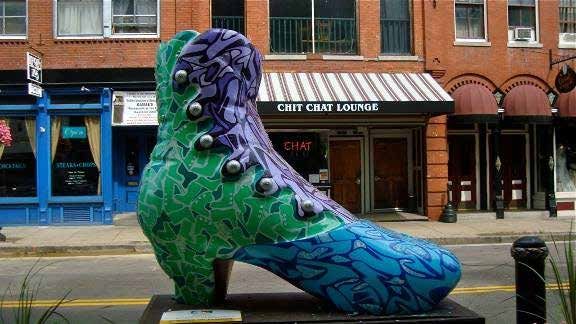
CHAPTER I: Introduction, Principal Findings & Conclusions

                                                            CHAPTER I
                                        Introduction,Principal Findings
                                                         & Conclusions
Swaback Partners, pllc + Gruen Gruen Associates + Dibble Engineering + DWG   6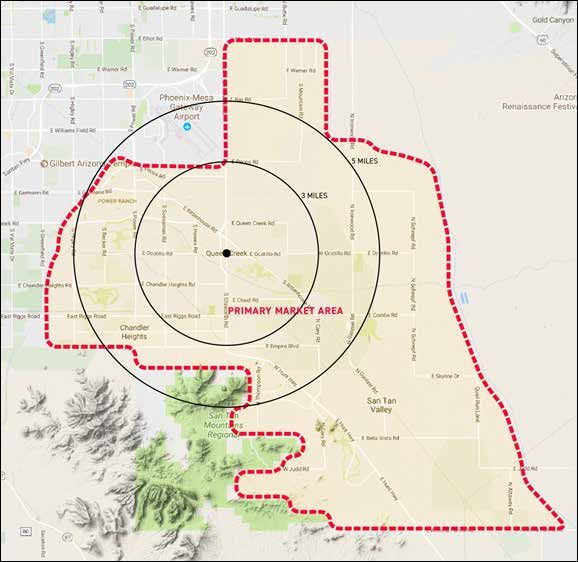
Introduction, Principal Findings & Conclusions
CHAPTER I: INTRODUCTION, PRINCIPAL FINDINGS &
CONCLUSIONS
INTRODUCTION, PURPOSE, AND BACKGROUND
This report summarizes the assessment Gruen Gruen + Associates (“GG+A”) conducted of the Queen Creek
Town Center to provide an information base and strategic framework for the preparation of the Town
Center Plan update.
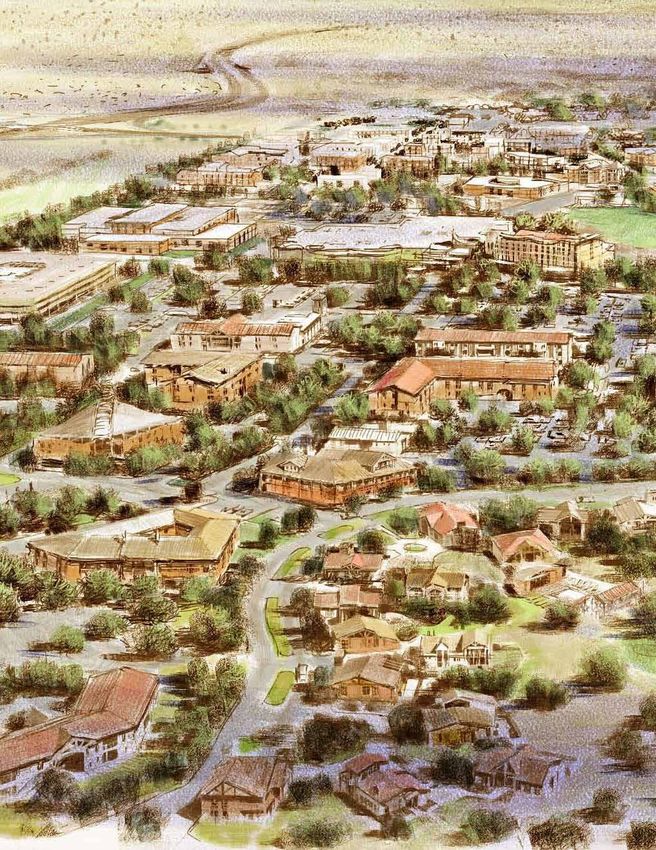
Map I-1 shows the Town Center study area.
MAP I-1: Town Center Study Area
Swaback Partners, pllc + Gruen Gruen Associates + Dibble Engineering + DWG 1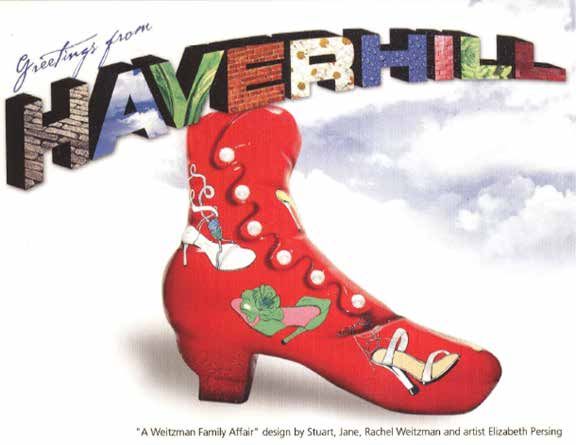
Introduction, Principal Findings & Conclusions

WORK COMPLETED

To accomplish the study objectives, GG+A analyzed a variety of data sources and conducted primary
research, including the following tasks:

    1. Inspected the Town Center, reviewed the current Town Center Plan, and conducted interviews
       with property owners, developers, real estate brokers, office space users, retailers and restaurant
       operators as well as representatives of the Chamber of Commerce, Town staff and officials;
    2. Analyzed sales data and demographic and income characteristics of market area households, and
       prepared purchasing power estimates for retail goods and services;
    3. Converted estimates of purchasing power or retail demand into estimates of the supportable
       amount of on-the-ground retail space;
    4. Obtained estimates of the supply of retail space and identified the relationship between estimated
       retail demand and supply;
    5. Evaluated the potential for office and residential uses; and
    6. Synthesized the results of the primary and secondary research and analysis and field inspections
       in order to reach conclusions about the potential opportunities and constraints affecting demand
       for land uses and activities in the Town Center and to identify strategic action recommendations
       to improve the capacity for serving market opportunities and enhancing the Town Center
       environment.

POPULATION AND HOUSEHOLD GROWTH AND SHIFTS

The Town of Queen Creek has evolved rapidly in the scale and character of development and population
over the past 15 years. At its current size of just under 40,000 residents, Queen Creek is nearly 10 times
larger than it was in 2000. With the addition of more than 9,000 housing units since 2000, Queen Creek’s
household base has grown by more than 700 percent over the past 15 years. Households attracted to new
housing developments in Queen Creek have been primarily younger-age families seeking more space at
comparatively affordable prices; more than one-half of all growth in owner-occupied households over the
past 15 years has been due to householders between the ages of 25 and 40. Householders age 65+ account
for 4.6 percent of growth.

During this period of rapid growth, the Town’s demographic make-up has also shifted. While the overall
age distribution of the community’s population and household base has not changed dramatically, the
income, educational attainment, and racial/ethnic composition of Queen Creek has shifted. Hispanics
comprised 30 percent of the population in 2000 and today comprise less than 18 percent of the population.
Non-Hispanic Blacks and Asians, although still a very small segment of the resident base, represented only
0.6 percent of the Queen Creek population in 2000 and today are estimated to comprise about four percent
of the population. Non-Hispanic Whites, as a share of the total population, have increased from about 68
percent in 2000 to 76 percent by 2015.

Swaback Partners, pllc + Gruen Gruen Associates + Dibble Engineering + DWG                                   2
Introduction, Principal Findings & Conclusions

In 2000, for example, about 17 percent of Queen Creek adults (age 25 or older) held a bachelor’s or
advanced college degree. By 2015, the Census Bureau estimates that the percentage of adults holding a
bachelor’s degree or higher in Queen Creek had grown to nearly 40 percent. Not surprisingly, an increase
in household incomes has also occurred. Adjusted for inflation, the proportion of Queen Creek households
earning more than $100,000 a year now approximates 44 percent (up from about 38 percent in 2000 after
adjusting for inflation) and more than 10 percent of households are estimated to have annual incomes
exceeding $200,000. The average household income on a real (i.e., inflation-adjusted) basis has grown by
about $10,000 or 10 percent over the past 15 years and now is estimated at about $107,000.

Figure I-1 below summarizes some of these shifts over the 2000-2015 period based upon U.S. Census
Bureau estimates.

           FIGURE I-1: Shifts in the Demographic Composition of Queen Creek

Sources: U.S. Census Bureau; Gruen Gruen + Associates.

Swaback Partners, pllc + Gruen Gruen Associates + Dibble Engineering + DWG                             3
Introduction, Principal Findings & Conclusions

GROWTH OF RETAIL SUPPLY HAS OCCURRED OUTSIDE OF THE STUDY AREA
AND IMPLICATIONS FOR DEVELOPMENT OPPORTUNITIES IN THE STUDY AREA

Like many small downtowns, the commercial functions in the study area have been affected by the
development of regional- and community-serving retail centers near the study area as the result of the
creation of a bypass to the formerly main north-south road, Ellsworth Road. The Ellsworth Loop Road has
shifted traffic away from Ellsworth Road to the bypass road. Shopping centers built to the north of the
study area, some of which adjoin the Ellsworth Loop Road include:

    •   Queen Creek Marketplace, southwest corner of Ellsworth Loop Road and Rittenhouse Road, built in
        2007 with 681,500 square feet of space including Super Target;
    •   Cornerstone, northwest corner of Rittenhouse and Ocotillo Roads built in 2008 with 327,500
        square feet of space including Wal-Mart Supercenter; and
    •   QC District, southeast corner of Ellsworth Loop Road and Rittenhouse Road, built in 2016 with
        107,500 square feet of space including Sprouts and HomeGoods.

The three major centers containing 1.1 million square feet of retail and restaurant space built northwest
and northeast of the study area constitute the primary commercial concentration in the community and
surrounding area, serving the day-to-day retail and service needs of the Town of Queen Creek residents and
residents of San Tan Valley (unincorporated Pinal County).

Queen Creek’s retail and commercial base, including to some extent the study area, will benefit from
additional long-term local household and job growth which will induce demand for convenience- and
necessity-goods and services. According to the Maricopa Association of Governments (“MAG”), as
described in Table I-1, the population of the Queen Creek municipal planning area is expected to exceed
80,000 by 2030.

Swaback Partners, pllc + Gruen Gruen Associates + Dibble Engineering + DWG                                4
Introduction, Principal Findings & Conclusions
TABLE I-1
Projected Housing and Population Growth in Queen Creek1
Population Households Housing Units Employment
# # # #
2015 Estimate 45,500 13,200 14,200 9,600
2020 Projection 57,500 17,300 18,200 12,200
2030 Projection 83,000 25,700 27,100 16,400
2040 Projection 92,700 28,900 30,100 20,600
2050 Projection 98,200 30,600 31,400 22,700
Projected Growth 2015-2050 52,700 17,400 17,200 13,100
Projected Annual Growth Rate 2015-2050 2.2 2.4 2.3 2.5
1 Projections for the municipal planning area which is larger than the current incorporated boundary.
Sources: Maricopa Association of Governments, 2016 Socioeconomic Projections;
Gruen Gruen + Associates.
The Queen Creek planning area is projected to add more than 17,000 housing units over the next
approximately 35 years. According to MAG, Queen Creek’s population may approach 100,000 residents by
2050. Employment within the planning area is projected to grow at an annual rate of 2.5 percent over the
next 35 years, increasing from fewer than 10,000 jobs currently to more than 20,000 jobs by 2040.
The MAG projections suggest that Queen Creek is anticipated to remain a bedroom community with a
low jobs-to-housing balance of about 0.7 (that is, 0.7 jobs for every housing unit). One implication of a
relatively low jobs-to-housing balance for the Town Center, especially because Queen Creek contains a large
share of dual-income households, Queen Creek residents may do at least some of their shopping closer to
their sources of employment located outside of Queen Creek.
PRINCIPAL FINDINGS AND CONCLUSIONS
RETAIL SALES TRENDS
Town Center sales exceeded $240 million in 2016 for the three major shopping centers (QC District,
Queen Creek Marketplace, and Cornerstone). In 2012, on an inflation-adjusted basis, Town Center sales
approximated $157 million.
Swaback Partners, pllc + Gruen Gruen Associates + Dibble Engineering + DWG 5Introduction, Principal Findings & Conclusions
FINDINGS AND CONCLUSIONS DRAWN FROM INTERVIEWS
Primary Advantages
• The study area is part of a growth pole of the community, whose population and household base has
increased and is expected to continue to increase significantly;
• The study area is centrally located (although the main north-south roadway bypasses the study
area);
• The unincorporated San Tan Valley areas of Pinal County adjoining Queen Creek do not include
significant shopping and service alternatives and the retail shopping centers to the immediate
north of the study area serve as a source of goods, services, and activities for residents of
unincorporated San Tan Valley areas of Pinal County;
• The presence of the Town Hall provides an employment base and Founders’ Park (which includes a
community center, splash pad, skate park, sports courts, and dog park) across from Town Hall also
generates visitation to the southern end of the study area;
• The study area is perceived as safe and its merchants friendly; and
• From the perspective of tenants and owner-occupants, the relatively low property costs are an
advantage.
Primary Disadvantages
• The high speed, through traffic on the Ellsworth Loop Road discourages visitation to the study area
(the Ellsworth Road section of the study area no longer offers the kind of “billboard effect” due to
diminished traffic);
• Most of the contemporary building space is located north of study area in other parts of the Town
Center;
• The presence of dilapidated residential properties and limited contemporary building space for
private users;
• Lack of freeway visibility and accessibility (particularly discourages attracting office users which
export their services);
• Connectivity between subareas of the Town Center to the residential neighborhoods is limited. The
Town Center is not conducive for strolling and browsing; and
• The study area currently lacks a critical mass of synergistic retail, office, residential, cultural, and
other attractions needed to induce multi-purpose trips from a wide area; and the retail centers to
the north are not well linked or integrated to the study area.
Swaback Partners, pllc + Gruen Gruen Associates + Dibble Engineering + DWG 6Introduction, Principal Findings & Conclusions Retail Market Area Most customers for study area services and activities originate from within Queen Creek and San Tan Valley. RETAIL DEMAND ESTIMATES Demand originating from primary market area households is estimated to be currently capable of supporting approximately 2.6 million square feet of retail and restaurant space assuming a sales level of $325 per square foot. The projected growth in the household base and income in the primary market area is estimated to support nearly 3.8 million square feet of retail/restaurant space by 2030. This equates to an increase of approximately 1.2 million square feet of space. ESTIMATED RETAIL SUPPLY WITHIN PRIMARY MARKET AREA The total estimated existing supply of retail uses in the primary market area approximates 2.3 million square feet of space. No significant retail supply alternatives exist elsewhere within the primary market area. An additional approximately 700,000 square feet of retail space is planned to be developed in the Town Center and primary market area. RELATIONSHIP BETWEEN RETAIL DEMAND AND SUPPLY WITHIN PRIMARY MARKET AREA The comparison of potential retail demand and supply suggests the relationship between demand and supply is the primary market area is relatively balanced. The existing supply of retail space of about 2.3 million square feet is about 329,000 square feet less than the estimated existing primary market area demand potential. By 2030, the supply of retail space is estimated to total approximately 3.0 million square feet. Unmet demand for retail space in 2030 is estimated to increase to approximately 837,000 square feet within the primary market area, ignoring retail space not yet planned that could be developed over the next 13 years in the market area. QUEEN CREEK OFFICE SPACE MARKET The Queen Creek submarket consists of approximately 205,000 square feet of office space with a current vacancy rate of 12.7 percent. Queen’s Creek’s office space inventory makes up only about two percent of the Southeast Valley’s office inventory of nearly 10.5 million square feet of space. Swaback Partners, pllc + Gruen Gruen Associates + Dibble Engineering + DWG 7
Introduction, Principal Findings & Conclusions

Queen Creek’s office space inventory consists of approximately 104,000 square of non-medical office space
and 102,000 square feet of medical office space. The vacancy rate of non-medical office space approximates
a high 23 percent with an average gross rent of $22.45 per square foot. The vacancy rate of medical office
space approximates a low 2.4 percent with an average gross rent of $29.36 per square foot. Given the small
base of office space in Queen Creek, when one or more occupants vacate office space, the vacancy rate can
materially change.

Queen Creek is not a well-established location for “corporate” office uses. Queen Creek does not currently
contain a critical mass of office space users, office space inventory, and set of support services and
amenities that corporate office space users require. It does not have highway accessibility and visibility
frequently preferred by larger space users. In other words, the Town Center does not provide significant
agglomerational advantages for major office space users.

Additional office space demand is likely to be complementary to retail and restaurant uses. By creating
a desirable, vital retail and services environment, the study area will attract additional service and
commercial office-oriented firms seeking the ambiance, proximity to services, and restaurants as well as
convenience to where owners, managers and employees live at prices below conventional suburban office
parks. Some users will originate from those which outgrow their home-based start-up locations. As the
population base of Queen Creek increases, additional demand will arise for service providers. Nearly
one-quarter of Queen Creek’s resident workforce is employed in white-collar professions. These residents
represent sources of labor for office space users or could be sources of demand for office space.

QUEEN CREEK APARTMENT MARKET

The Town of Queen Creek contains two apartment projects (each located in the Town Center outside the
study area). Both apartment projects located in the Town Center were built in 2008. The two projects
contain a total of 440 apartments units. Both projects are well leased. The rental rates, however, are
relatively low at $1.40 per square foot or less per month. The apartment units attract households which
rent on a short term basis while waiting for single-family homes to be built. The apartment units also
attract younger-aged households not yet ready to purchase a single-family home, but who either work in
the area or are from the area and have family and friends nearby.

In addition a townhome rental project with an initial phase of 119 units near the Town Center has just
opened. Avilla Victoria in Queen Creek at Ocotillo Road and Victoria Lane west of Ellsworth Loop Road is
expected to compete with the two apartment projects. The project is similar in monthly rent, although the
new Avilla project has smaller sized-units than the apartment developments and so has a higher per square
foot price (ranging from $1.21 per square foot for the largest sized unit to $1.55 per square foot for the
smallest sized unit type). The project expects to attract younger aged households who for lifestyle reasons
do not want to purchase.

Swaback Partners, pllc + Gruen Gruen Associates + Dibble Engineering + DWG                                   8
Introduction, Principal Findings & Conclusions

STRATEGIC IMPLICATIONS OF RETAIL DEMAND-SUPPLY ANALYSIS –“WHAT AND
HOW” TO PROGRAM AND BRAND THE STUDY AREA

The review of supply-demand conditions and the presence of a significant supply of standard retail center
space near the study area suggest the importance of the study area offering not just goods but services and
experiences that differentiate it from standard shopping areas.

CHARACTERISTICS TO INCORPORATE AND TARGET MARKET

Given the lower rents associated with study area, the presence of the Founders’ Park, and the Town Hall
and ample retail space proximate but not well linked to the study area, the planning and implementation of
the enhancement of the study area should:

    •   incorporate fun, sense of community, and family friendliness and “aha” moments to engage visitors
        in a relaxed and engaging atmosphere not available from the standard retail centers to the north of
        the study area;
    •   instill a sense of place through authenticity, uniqueness, cultural, and recreational activities in a
        pedestrian-oriented setting where community, culture, and commerce can coalesce in a way that
        creates opportunities for a shared sense of memories and experiences;
    •   create a place that is embraced locally (by family households as well as empty-nester or retiree
        households which will tend to have “legs” and appeal to residents of San Tan Valley and other
        audiences beyond Queen Creek (including residents of the East Valley and northern Pinal County);
        and
    •   appeal to the “nest builder” families with children attracted to Queen Creek. Such families
        are frequently time constrained, concerned with the health and safety of their families, seek
        opportunities to do things together, and reward a place with their time where children could learn
        as well as recreate or shop.
Creativity in marketing will be required in order to distinguish the study area as more personal, user-
friendly, and a different place to do business and visit than standard retail shopping areas. Given that
many newer residents do not associate with the study area a shared sense of memories and experiences,
the challenge is for the study area to respond to the increasing emphasis on experiences and requirement
of convenience so that local residents view the study area as a place they will reward with their time and
attention.

Swaback Partners, pllc + Gruen Gruen Associates + Dibble Engineering + DWG                                      9
Introduction, Principal Findings & Conclusions
BUSINESS CANDIDATES AND PROGRAMMING
Opportunities to capture family households include the following types of unique tenancies that could be
candidates for building space in the study area:
• non-chain-like restaurants;
• scrapbooking and/or memory-based shops and knitting store;
• pottery making/painting and other arts and crafts making opportunities;
• programs for children and parents-music, dance, story times, etc.;
• yoga, pilates, and personal sports training;
• candy, cupcake, ice cream, and popsicle shops;
• a quality vintage or consignment clothing with a real point of view;
• a comic book store; and
• vinyl record store.
RESTAURANT ROW
A restaurant row is a key way to distinguish the study area and build a comparative advantage for serving
office space users and residents of multi-family developments and attracting shoppers at the retail centers
immediately north of the study area. A restaurant row needs to be placed in a highly visible location with
landscaping, lighting, and signage techniques that help attract both residents and workers. We use the
term restaurant row because one restaurant by itself cannot attract significant numbers of patrons. A
cluster of restaurants, however, can typically penetrate a deeper market because customers have the added
confidence that if they cannot get into one restaurant or become tired of one restaurant, other options will
be available.
A variety of eating and drinking places should be sought to provide morning-, lunch-, and dinner-time
traffic and support for the other uses. A sit-down coffee house that provides Wi-Fi Internet connectivity
is an example of a use that relates well to a consumer shift to making the most efficient use of time, even
when shopping. A sit-down coffee house would also complement the under construction Old Ellsworth
Brewing Company. A restaurant row would help link the retail centers to the north to the study area.
Encourage the Queen Creek Olive Mill and Schnepf Farms to establish satellite branch locations in the
study area. These iconic destination Queen Creek venues would help positively brand the study area and
generate visitor spillover to adjoining uses and activities.
Swaback Partners, pllc + Gruen Gruen Associates + Dibble Engineering + DWG 10Introduction, Principal Findings & Conclusions AMOUNT OF RESTAURANT AND COMMERCIAL SPACE FOR THE STUDY AREA TO PLAN Although the primary market area is forecast to have an increasing amount of unmet demand for retail space, several larger projects are planned which could include more retail additions than what has been formally identified. Therefore, we recommend the initial development program for the study area include approximately 15,000 to 25,000 square of restaurant space and 20,000 to 30,000 square feet of commercial space for personal service providers (e.g., pilates, yoga, beauty salon, etc.), healthcare services (e.g., dentist, chiropractor, optometrist, etc., ), pet services or supplies, and eating and drinking establishments (e.g., coffee, tea, yogurt, smoothie, ice cream, bakery goods, wine bar, in addition to the brewery under construction). The attraction of unique eating or drinking uses such as the under development Old Ellsworth Brewing Company, for example, could function as a “local destination” use that could help to seed other service, retail and eating and drinking tenants and increase the appeal of the study area as a residential and office location. TYPE AND AMOUNT OF OFFICE SPACE DEMAND LIKELY TO BE CAPTURED IN STUDY AREA The study area will attract service and commercial office-oriented firms seeking lower cost space, the ambiance, proximity to services and restaurants as well as convenience to where they live. Medical space users, and smaller-sized providers of financial services and insurance firms or legal, accounting, engineering, and related professional technical service firms whose principals or managers live in Queen Creek are the most likely candidates. Additional office space demand is likely to be complementary to civic, retail and restaurant uses so that by creating a desirable and vital location the study area will attract additional service and commercial office- oriented uses. Some office space users will originate from those which outgrow their home-based start-up locations. While not likely to be an initial sequence in the development evolution of the study area, based on the forecast population growth and the potential positive spillover demand generated by an enhanced study area, an additional 25,000 to 50,000 square feet of office space should be planned (in addition to the amount of planned retail and commercial space). EVALUATE AND IF FEASIBLE IMPLEMENT CO-WORKING SPACE ENHANCEMENT The interviews indicate Queen Creek contains small home based businesses including independent professionals and remote workers, some of whom would like to obtain small space outside the home on flexible, low cost terms. Queen Creek also attracts a variety of small businesses providing services to the local household and business base, some of whom also want small relatively low cost contemporary space without the financial risk of long lease terms. In addition, some Queen Creek residents are with larger companies that may work from home some of the time and occasionally need meeting space. Queen Creek hosts “Gangplank” a volunteer managed model that currently includes a very small amount of co-working space in the Chamber of Commerce office and limited support services. Swaback Partners, pllc + Gruen Gruen Associates + Dibble Engineering + DWG 11
Introduction, Principal Findings & Conclusions

Evaluate if a larger co-working space with additional services and facilities such as improved broadband
and telecommunication capabilities, video conferencing and expanded service offerings could be feasibly
programmed and operated in the study area. Identify and if found feasible implement an action plan
to organize, fund, provide, and manage support services and dedicated “maker space” for research and
development, small-scale manufacturing and light assembly activities and office space activities (and even
culinary arts) by start-up or early growth businesses. Identify the kind of software (such as Autodesk
Design Suite) and equipment such as laser cutters, plastics and electronics labs, machine shop, wood shop,
metal working shop, welding stations, and waterjet cutter that enrolled businesses would use and which
could also be used for educational purposes- and how to pay for such software and equipment. Investigate
if Rio Salado College and/or Chandler-Gilbert Community College, the Queen Creek Chamber of Commerce,
and other regional economic development and educational institutions would be potential “partners”.
Conduct a survey of Queen Creek residents to ascertain potential demands and preferences for the type of
space and programs and willingness to pay for access.

RESIDENTIAL MARKET
The Town Center is the only location in Queen Creek with existing apartment units. While well occupied,
the rents obtained are too low to support new construction of multi-story urban style multi-family uses.

Queen Creek has a small share of renter households comprising the primary renter age categories with
fewer than 370 households in the 25-34 age cohort, representing only four percent of Queen Creek’s
household base.

The Town Center does not yet have a sufficiently developed and active office base and retail, restaurant,
cultural, and entertainment base to attract empty-nesters looking for a lifestyle change from living in
single-family neighborhoods; or to attract millennials looking to live in higher priced multi-story, urban
style apartments close to shops, restaurants, and offices just outside their front doors.

Neither the interviews nor review of past projects and the primary demographic characteristics of Queen
Creek households suggest near term demand for multi-story apartment product geared to empty nesters
and Generation Y members. This finding is bolstered by the finding that single-family housing for family
households is affordable in Queen Creek.

Potential Future Residential Product Concept
In the future when the Town Center has matured and further developed a critical mass of land uses and
activities, a for-sale urban type townhouse or small lot single-family development may hold potential with
less risk than associated with a larger-scale apartment use. If the Town would accept such a product option
for the Town Center, it would be worthwhile to evaluate locations and product alternatives to accommodate
the development of a for-sale product (of at least 35 units) in a later sequence of land use development
when the Town Center has been further enhanced. A set of focus panels could be held with residents to test
reactions and preferences about product and tenure arrangements.

Swaback Partners, pllc + Gruen Gruen Associates + Dibble Engineering + DWG                                   12
Introduction, Principal Findings & Conclusions

ENCOURAGE COLLABORATION OF LOCAL ENTREPRENEURS WITH LOCAL ECONOMIC
DEVELOPMENT AND EDUCATIONAL INSTITUTIONS

Build-off the Gangplank program by focusing on continued internal collaboration of local entrepreneurs
and policy makers and the Communiversity, as opposed to relying entirely on an “outside-in” strategy
which utilizes the majority of resources to recruit external business activities and employers. Components
include encouraging an entrepreneurial culture by including space and services for small businesses,
including formerly home-based businesses, providing mentoring and training assistance to start-up
businesses, and connecting entrepreneurs to local financing sources and other marketing-related resources.

In conjunction with the Communiversity and Queen Creek Chamber of Commerce, provide training,
information sharing and related assistance to retailers and restaurant operators related to ideas and
techniques for leveraging foot traffic from special events to sales; cross-promotional opportunities; web site
development, maintenance and advertising; window display and merchandising; and related subjects.

CONSIDER REDUCING, ABATING OR DEFERRING FEES TO ATTRACT UNIQUE USES AND
ACTIVITIES

To encourage businesses, especially restaurants or food service concepts and unique retailers and artistic
and cultural activities, to locate in the study area, consider reducing, abating or deferring building permit
fees or other related fees.

HOLD A CONTEST TO ATTRACT UNIQUE AND EXPERIENTIAL CONCEPTS

Hold and publicize a contest to attract independent, unique retail and other experiential concepts to the
study area. Under this approach, aspiring retailers complete applications and business plans, which are
reviewed by a panel of experts, the winners of which are given attractive terms for short-term leases or
“free rent” for a year and reduced or abated municipal fees.

FOCUS PROMOTIONS ON EXISTING RESIDENTS OF QUEEN CREEK AND NEARBY
COMMUNITIES

Municipal communications and cooperative advertising, including coupons about special events, services
and activities available in the study area should be regularly focused on existing residents of Queen Creek
and San Tan Valley.

A bike-a-thon that makes use of Founders’ Park and raises money for local charities or schools, is a type of
event that can differentiate the study area from standard commercial areas and create community cohesion,
while generating spillover to study area merchants and eating and drinking establishments.

Swaback Partners, pllc + Gruen Gruen Associates + Dibble Engineering + DWG                                      13
Introduction, Principal Findings & Conclusions

ENHANCE WAY-FINDING AND SIGNAGE

The study area would benefit from a more exciting and more informative way-finding system. This could
include a design competition for gateway artworks and entrance signs that capture people’s attention as
they approach the southern and northern gateways to the study area. Improved directional and “tenant
directory”-type signage for visitors to the shopping centers to the north of the study area would also help
generate spillover to the study area.

IMPROVE PUBLIC REALM MAINTENANCE AND BRAND THE STUDY AREA WITH AUTHENTIC
FEATURES

The best place-based brand development requires many acts of small execution and attention to details that
visitors and space users will appreciate and notice if the details are “off message”. The public realm in the
study area could be significantly improved. Basic public realm maintenance is a key detail if the envisioned
study area brand promise is to be kept.

An example of community branding and civic participation that represents a potential model includes a
very different place than Queen Creek: Haverhill, which is located by the Merrimack River in northern
Massachusetts. From the 1830s and into the early 20th century, the “Queen Slipper City” served as a center
of women’s shoe manufacturing. This heritage is reflected in the Queen Anne architecture of mill buildings
still present in the Downtown. To simultaneously pay homage to its past, while helping to re-brand
and celebrate the Downtown as a unique and exciting place, the “Soles of Haverhill” committee of Team
Haverhill arranged the creation of 14 six-foot tall decorated fiberglass shoes by various artists, including a
Stuart Weitzman shoe covered with Swarovski crystals. Stuart Weitzman and his family designed this fancy
shoe and came to Haverhill for the unveiling. Images of the shoes, and promotional materials created and
other information is included in Appendix A.

The whimsical art pieces generated significant community participation, publicity, and visitation to
Downtown. One Haverhill civic leader sums up the initiative best: “it’s been an amazing experience in
community energy” and a “lot of fun”. The shoes, which were put in display in prominent locations in the
Downtown, were auctioned off at a gala event with proceeds benefiting community art projects and non-
profit organizations.

The Haverhill example reflects a critical but sometimes overlooked element of community branding:
successful branding requires using some feature authentic to the community and a process that galvanizes
community support and delight.

If the Haverhill example resonates, Queen Creek could consider a similar approach but with a horses
and horseshoe theme that ties to Queen Creek’s Horseshoe Park and Equestrian Centre and western/
agricultural history.

Swaback Partners, pllc + Gruen Gruen Associates + Dibble Engineering + DWG                                    14
CHAPTER II: Analysis of Sales Trends

                                                                     CHAPTER II
                                                         Analysis of Sales Trends

Swaback Partners, pllc + Gruen Gruen Associates + Dibble Engineering + DWG      15
CHAPTER II: Analysis of Sales Trends
CHAPTER II: ANALYSIS OF SALES TRENDS
INTRODUCTION
This chapter begins with a review of the historical retail trends in the Town Center of Queen Creek. The
primary purpose of this analysis is to identify trends or shifts in retail sales’ activity. The Town of Queen
Creek provided the sales data. The sales data only account for three major developments with which the
Town has a development agreement stipulating a higher tax rate (QC District, Cornerstone, and Queen
Creek Marketplace.) A project sales tax surcharge of 0.25 percent is added to each sale or transaction within
these developments. The money collected from this surcharge is put into a special fund to be used only for
key infrastructure, operations and maintenance or other programming or projects within the Town Center,
consistent with the Town Center Plan. These developments include the largest retail centers in Town
Center, and in the Town of Queen Creek.
TOWN CENTER TAXABLE RETAIL SALES TRENDS
Table II-1 summarizes Town Center taxable retail sales trends from 2012 through 2016. Total retail sales
(adjusted for inflation) increased by $84 million, from $157 million in 2012 to $241.3 million in 2016. This
equates to a high annual growth rate of 11.4 percent.
TABLE II-1
Town Center Taxable Retail Sales Trends1
Retail Restaurants and Bars TOTAL
$ $ $
2012 141,377,200 15,546,700 156,923,900
2013 158,204,300 14,602,300 172,806,600
2014 165,768,458 17,308,300 183,076,800
2015 176,924,900 20,292,500 197,217,400
2016 205,652,000 35,638,600 241,290,600
Change 2012-2016 64,274,800 20,091,900 84,366,700
Change 2012-2016 (%) 45.5 129.2 53.8
1 Figures are rounded and based on calendar year. Sales adjusted to current 2016 dollars based on the
Consumer Price Index for all urban consumers in the U.S. Includes sales from QC District, Cornerstone,
and Queen Creek Marketplace.
Sources: Town of Queen Creek; Gruen Gruen + Associates.
Between 2012 and 2016, annual taxable sales grew in the Town’s three major retail developments increased
by $84.4 million. Total taxable sales increased from nearly $157 million in 2012 to over $241 million in
2016. The increased sales grew by about 54 percent. The majority of taxable sales are from retail sales.
Restaurant and bar sales increased by 129 percent, growing by $20.1 million from over $15.5 million in
2012 to over $35 million in 2016. Restaurant and bar sales account for 15 percent of total sales in 2016, up
from a 10 percent share of total sales in 2012.
Swaback Partners, pllc + Gruen Gruen Associates + Dibble Engineering + DWG 16CHAPTER II: Analysis of Sales Trends
Table II-2 summarizes an estimate of taxable sales-per-square-foot over time for the three shopping centers
included in the Town Center estimate.
TABLE II-2
Town Center Taxable Retail Sales Per Square Foot Estimate1
Estimated Sales
Occupied Retail Total Taxable Per Square Foot
Space2 Sales $
# Square Feet $
2012 824,990 156,923,900 190.21
2016 1,032,352 241,290,600 233.73
Change 2012-2016 207,362 84,366,700 43.52
1 Sales adjusted to current 2016 dollars based on the Consumer Price Index for all urban consumers in the
U.S. Includes sales from QC District, Cornerstone, and Queen Creek Marketplace.
2 Average annual amount of occupied space.
Sources: Town of Queen Creek; CoStar; Gruen Gruen + Associates.
Taxable sales approximated $234 per square foot of occupied retail space in 2016 (based on CoStar
estimates). The QC District shopping center opened in the second quarter of 2016 and included about
106,000 square feet of occupied retail space by the year’s end. Taxable sales per square foot have grown
over time. In 2012, taxable sales approximated $190 per occupied square foot for the QC Marketplace and
Cornerstone projects located in the Town Center.
The addition of retail space inventory over time combined with positive sales-per-square-foot growth
suggests that additions to the retail space supply and new store openings have attracted net new sales to
the location rather than siphoning or cannibalizing sales from adjacent stores and centers. However, the
sales per square foot levels are relatively low and suggest sales will need to increase as the household base
of Queen Creek expands for the centers to be high performing and continue to obtain high rents.
Swaback Partners, pllc + Gruen Gruen Associates + Dibble Engineering + DWG 17CHAPTER III: Strengths & Weaknesses of Study Area
CHAPTER III
Strenghts & Weaknesses of
Study Area
Swaback Partners, pllc + Gruen Gruen Associates + Dibble Engineering + DWG 18CHAPTER III: Strengths & Weaknesses of Study Area
CHAPTER III: STRENGTHS AND WEAKNESSES OF STUDY AREA
INTRODUCTION
Based on our inspections of the study area, the interviews, and analysis of secondary data, this chapter
summarizes the factors that encourage demand or primary advantages of the study area. This chapter also
reviews the constraints or primary disadvantages on serving potential demands.
FACTORS THAT ENCOURAGE DEMAND OR PRIMARY ADVANTAGES
The site inspections and interviews suggest the factors that encourage demand or constitute primary
advantages for the study area include following:
• The study area is part of a growth pole of a community, whose population and household base has
increased and is expected to continue to increase significantly;
• The study area is centrally located (although the main north-south roadway bypasses the study
area);
• The unincorporated San Tan Valley areas of Pinal County adjoining Queen Creek do not include
significant shopping and service alternatives and the retail shopping centers to the immediate
north of the study area serve as a source of goods, services, and activities for residents of
unincorporated San Tan Valley areas of Pinal County;
• The presence of the Town Hall provides an employment base and Founders’ Park across from the
Town Hall also generates visitation to the study area;
• The study area is perceived as safe and its merchants friendly; and
• From the perspective of tenants and owner-occupants, the relatively low property costs are an
advantage.
FACTORS THAT DISCOURAGE DEMAND OR PRIMARY DISADVANTAGES
The following factors discourage the attraction of demand or represent primary disadvantages:
• The high speed, through traffic on the Ellsworth Loop Road discourages visitation to the study area
(the Ellsworth Road section of the study area no longer offers the kind of “billboard effect” due to
diminished traffic);
• Most of the contemporary building space is located north of study area in other parts of the Town
Center;
Swaback Partners, pllc + Gruen Gruen Associates + Dibble Engineering + DWG 19CHAPTER III: Strengths & Weaknesses of Study Area
• The presence of dilapidated residential properties and limited contemporary building space for
private users;
• Lack of freeway visibility and accessibility (particularly discourages the attraction of office users
which export their services);
• Connectivity between subareas of the Town Center to the residential neighborhoods is limited. The
Town Center is not conducive for strolling and browsing; and
• The study area currently lacks a critical mass of synergistic retail, office, residential, cultural, and
other attractions needed to induce multi-purpose trips from a wide area; and the retail centers to
the north are not well linked or integrated to the study area.
Swaback Partners, pllc + Gruen Gruen Associates + Dibble Engineering + DWG 20CHAPTER IV: Potential Retail Space Demand
CHAPTER IV
Potential Retail Space Demand
in the Primary Market Area
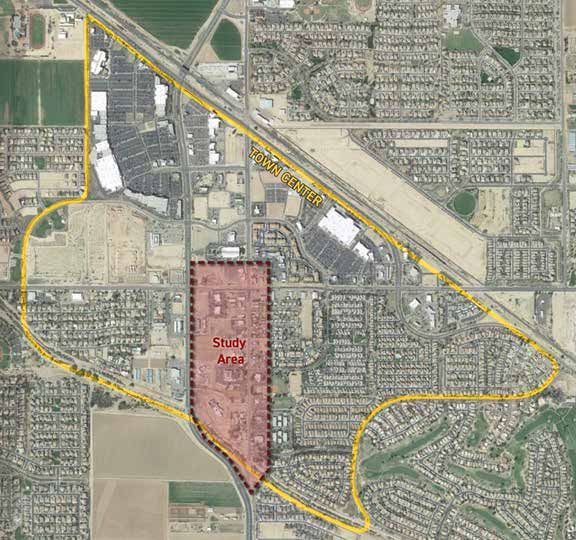
Swaback Partners, pllc + Gruen Gruen Associates + Dibble Engineering + DWG 21CHAPTER IV: Potential Retail Space Demand CHAPTER IV: POTENTIAL RETAIL SPACE DEMAND IN THE PRIMARY MARKET AREA INTRODUCTION AND APPROACH For the primary market area defined (and described in the next section of Chapter IV) as the result of the interviews and review of retail supply and roadways, GG+A obtained and analyzed demographic and household income data to estimate total retail demand originating from primary market area households. We also identified the amount of retail space that currently exists within and near the primary market area. We compared the relationship between potential retail demand and supply to assess the relative intensity of competition for the expenditures of market area households and to identify whether additional retail space can be supported. PRIMARY MARKET AREA Map IV-1 describes the primary market area; that is the area from which most customers are likely to be attracted to retail and restaurant space in the Town Center. The primary market area is bounded to the north by Pecos Road (the south side of Phoenix-Mesa Gateway Airport) and Elliot Road, the Roosevelt Canal to the west, the San Tan Mountains to the southwest, East Arizona Farms Road and the San Tan Mountains to the south; and the canal at the foothills of Superstition Mountains to the east. The primary market area definition includes the Eastmark and Cadence master-planned communities in Mesa. To date, the Eastmark community includes 3,500 homes. MAP IV-1: Primary Market Area Swaback Partners, pllc + Gruen Gruen Associates + Dibble Engineering + DWG 22
CHAPTER IV: Potential Retail Space Demand

ESTIMATE OF RETAIL DEMAND ORIGINATING FROM PRIMARY MARKET AREA
HOUSEHOLDS

ESTIMATE OF TOTAL AVAILABLE HOUSEHOLD INCOME

Table IV-1 presents an estimate and future projection of population, households, average household
income, and total available income for the primary market area. The estimates are based on 2016 MAG
socioeconomic projections (to 2030) for traffic analysis zones comprising the primary market area. We
assume that future new households will possess similar incomes to existing households.

                                   TABLE IV-1
       Household and Income Estimates and Projection for Primary Market Area
                                   2015                  2020                2030           Projected
                                   Estimate              Projection          Projection     Growth
                                                                                            2015-2030
Population                      186,194           215,491                    266,623        80,429
Households                      56,955            66,580                     83,042         26,087
Average Household Income1 $75,000                 $75,000                    $75,000        NA
Total Available Income          $4,271,625,000    $4,993,500,000             $6,228,150,000 $1,956,525,000
1 Projection assumes no real income growth over time.

Sources: Maricopa Association of Governments, 2016 Socioeconomic Projections; Applied Geographic
Solutions; Gruen Gruen + Associates.

According to MAG estimates, the primary market area is estimated to contain approximately 186,000
residents and 57,000 households. Based on secondary data from demographic information vendor Applied
Geographic Solutions, average household income in the primary trade area currently approximates $75,000
(households outside of Queen Creek in the primary trade area tend to have lower incomes than Queen
Creek households). By 2030, the primary trade area is projected to grow to 267,000 people and about
83,000 households, representing a relatively high average annual growth rate of approximately 2.5 percent
over the 2015-2030 period. Total available household income is accordingly projected to increase by about
$2.0 billion, from approximately $4.3 billion in 2015 to $6.2 billion by 2030.

EXPENDITURE RATE ON RETAIL GOODS AND SERVICES

In order to estimate the potential purchasing power associated with primary market area households,
GG+A reviewed the 2014-2015 Bureau of Labor Statistics Consumer Expenditure Survey (“CES”) for
the Phoenix Metropolitan Statistical Area (“MSA”). We also reviewed relevant past GG+A research on
consumer expenditures on retail goods and services. As shown on Table IV-2, the 2014-2015 BLS Consumer
Expenditure Survey indicates that all Phoenix MSA households expend approximately 21 percent of their
before-tax income on retail goods and services.

Swaback Partners, pllc + Gruen Gruen Associates + Dibble Engineering + DWG                               23
CHAPTER IV: Potential Retail Space Demand
TABLE IV-2
Phoenix MSA Average Household Annual
Expenditure on Retail Goods and Services in 2014-2015
Average Annual Share of Before-Tax
Household Average Household
Expenditure Income1
Good/Service $ %
Food at Home 4,370 6.1
Food Away from Home 2,798 3.9
Alcoholic Beverages 611 0.8
Housekeeping Supplies 519 0.7
Household Furnishings & Equipment 1,434 2.0
Apparel and Services 1,848 2.6
Entertainment2 2,756 3.8
Personal Care Products and Services 712 1.0
Reading 116 0.2
Tobacco Products 278 0.4
TOTAL 15,442 21.4
1 Phoenix-Mesa MSA average households income was $72,130 reported in the 2014-2015 Consumer
Expenditure Survey.
2 Includes a variety of discretionary goods and entertainment activities, such as sporting goods, pet
supplies, personal electronics, fees and admissions to movie theatres, etc.
Sources: Bureau of Labor Statistics, Consumer Expenditure Survey, 2014-2015; Gruen Gruen +
Associates.
The 2014-2015 BLS Consumer Expenditure Survey for the Phoenix MSA indicates that Phoenix region
households expend approximately 21 percent of their before-tax income or $15,400 on retail goods
and services. The largest share of household income is spent on food which includes food away from
home. Food, drinking, and dining-related expenditures accounted for a total of 11 percent of before-tax
household income in 2014-2015. Household furnishings and apparel expenditures comprise approximately
4.6 percent of before-tax household income. Expenditures for necessity-type goods and services such as
personal care products and housekeeping supplies represented about two percent of before-tax income in
2014-2015. Entertainment expenditures made up 3.8 percent of before-tax income.
Swaback Partners, pllc + Gruen Gruen Associates + Dibble Engineering + DWG 24CHAPTER IV: Potential Retail Space Demand
ESTIMATED EXPENDITURE POTENTIAL OF PRIMARY MARKET AREA HOUSEHOLDS
To estimate the purchasing power or expenditure potential within the primary market area of the Town
Center, we assume that approximately 20 percent of total household income is spent on retail goods and
services on the types of goods and services offered in the Town Center. Accordingly, Table IV-3 presents
estimates of potential retail demand within the primary market area.
TABLE IV-3
Estimated Retail Demand from Primary Market Area Households
2015 2020 2030 Projected Growth
Estimate Projection Projection 2015-2030
Total Available Income $4,271,625,000 $4,993,500,000 $6,228,150,000 $1,956,525,000
Estimated Retail Expenditure $854,325,000 $998,700,000 $1,245,630,000 $391,305,000
Potential
1 At 20 percent of before-tax available household income.
Sources: Maricopa Association of Governments, 2016 Socioeconomic Projections; Applied Geographic
Solutions; Bureau of Labor Statistics, 2014-2015 Consumer Expenditure Survey; Gruen Gruen + Associates.
Multiplying the total household income within the primary market area of $4.3 billion
by the 20 percent estimated expenditure rate produces an estimate of expenditure potential or retail demand
of approximately $854 million. Expenditure potential within the primary market area is forecast to increase
by about 46 percent or $391 million to just over $1.2 billion by 2030.
ESTIMATED SUPPORTABLE SPACE DEMAND
In order to convert estimates of expenditure potential or purchasing power into estimates of potential
on-the-ground retail space, an assumption must be made about the average sales per square foot tenants
or retailers must generate to viably operate and for landlords to obtain high enough rents to amortize
development costs and provide an acceptable return on investment. The estimates of retail demand reflect
the assumption that a new commercial development would need to generate $300 to $350 per square foot in
sales in order to be financially feasible. Based upon our review of taxable retail sales trends within the Town
Center study area, this sales threshold appears to be higher than existing sales performance. As the centers
become more established and as the market area household base and income increases, the sales productivity
of the centers can be expected to increase.
Swaback Partners, pllc + Gruen Gruen Associates + Dibble Engineering + DWG 25CHAPTER IV: Potential Retail Space Demand
Table IV-4 summarizes the sales per square foot productivity of individual retailers and restaurants which
operate nationally.
TABLE IV-4
Sales Per Square Foot Productivity
Average Store Size Annual Sales Per Square
Store # Square Feet Foot
$
Target 133,671 307
Wal-Mart 99,670 416
Kohls 71,993 229
Dick’s Sporting Goods 49, 533 181
Bed, Bath & Beyond 28283 280
Michaels Stores 18,000 223
Home Depot 104,000 square feet of 370
enclosed building space
plus 24,000 square feet of
garden space
Lowe’s 109,000 293
Costco 144,000 1,104
CVS 8,251 907
Walgreens 14,400 712
DSW 21000 267
TJX Companies 19,456 383
Panera Bread 4,500 567
Sources: Companies 10K Reports; Gruen Gruen +Associates.
Drawn from a review of annual reports the retailers and restaurants file with the Securities and Exchange
Commission, the major big box retail stores generate sales ranging from $181 to $416 per square foot.
Costco generates extremely high sales of over $1,100 per square foot while drug stores Walgreens and
CVS also generate high sale volumes of sales of $712 to $907 per square foot. The fast casual restaurant
Panera Bread generates sales of $567 per square foot. Well performing grocery and drug stores anchored
neighborhood retail centers therefore typically generate sales of $300-$350 per square foot as should
restaurant rows, specialty and lifestyle retail centers.
The sales productivity assumptions are based on a synthesis of (a) our interviews with developers and real
estate brokers, (b) review of secondary data on sales per square foot, and (c) and consideration of sales
levels needed to support varying rental amounts (most retailers and restaurants operators can afford to pay
rents equivalent to five percent to eight percent of sales).
Swaback Partners, pllc + Gruen Gruen Associates + Dibble Engineering + DWG 26CHAPTER IV: Potential Retail Space Demand
Table IV-5 shows that demand originating from primary market area households is estimated to be
currently capable of supporting approximately 2.6 million square feet of retail and restaurant space
assuming a sales level of $325 per square foot.
TABLE IV-5
Estimated Supportable Retail Space in Primary Market Area1
2015 Estimate 2030 Projection
Estimated Potential Retail Expenditures/Demand $854,325,000 $1,245,630,000
Estimated Total Retail Space Demand in Square Feet @ $325 Sales 2,629,000 3,833,000
Per Square Foot2
Forecast Additional Supportable Retail Space in Square Feet --------- 1,204,000
1 Figures have been rounded.
2 Estimated potential retail expenditures are divided by $325 per
square foot to estimate the supportable amount of on-the-ground
retail space.
Source: Gruen Gruen + Associates
The projected growth in the household base and income in the primary market area is estimated to
support nearly 3.8 million square feet of retail/restaurant space by 2030. This equates to an increase of
approximately 1,204,000 square feet of space.
Swaback Partners, pllc + Gruen Gruen Associates + Dibble Engineering + DWG 27You can also read