QUEENSLAND FARMERS' FEDERATION - Queensland ...
←
→
Page content transcription
If your browser does not render page correctly, please read the page content below
QUEENSLAND FARMERS’ FEDERATION
                                                          Primary Producers House, Level 3, 183 North Quay, Brisbane QLD 4000
                                                                              PO Box 12009 George Street, Brisbane QLD 4003
                                                                                           qfarmers@qff.org.au | 07 3837 4720
                                                                                                           ABN 44 055 764 488

                                                          Submission

           20 July 2018

           Energy Queensland
           General Manager Regulation and Pricing
           GPO Box 1461
           BRISBANE QLD 4006

           Via email: tariffs@energyq.com.au

           Dear Sir/Madam

           Re: Energex and Ergon Energy Network Tariffs 2020-25

           The Queensland Farmers’ Federation (QFF) is the united voice of intensive agriculture in Queensland. It
           is a federation that represents the interests of peak state and national agriculture industry
           organisations, which in turn collectively represent more than 13,000 primary producers across the state.
           QFF engages in a broad range of economic, social, environmental and regional issues of strategic
           importance to the productivity, sustainability and growth of the agricultural sector. QFF’s mission is to
           secure a strong and sustainable future for Queensland farmers by representing the common interests of
           our member organisations:
                •   CANEGROWERS
                •   Cotton Australia
                •   Growcom
                •   Nursery & Garden Industry Queensland (NGIQ)
                •   Queensland Chicken Growers Association (QCGA)
                •   Queensland Dairyfarmers’ Organisation (QDO)
                •   Australian Cane Farmers Association (ACFA)
                •   Flower Association
                •   Pork Queensland Inc.
                •   Queensland United Egg Producers (QUEP)
                •   Bundaberg Regional Irrigators Group (BRIG)
                •   Burdekin River Irrigation Area Irrigators Ltd (BRIA)
                •   Central Downs Irrigators Ltd (CDIL)
                •   Pioneer Valley Water Cooperative Ltd (PV Water)
                •   Queensland Chicken Meat Council (QCMC).

             QFF welcomes the opportunity to provide comment on the Energex and Ergon Network Tariffs 2020-
             25 Customer Consultation Paper. QFF provides this submission without prejudice to any additional
             submission provided by our members or individual farmers.

The united voice of intensive agriculture
QFF’s membership across intensive, semi-intensive and irrigated agriculture includes both Small and
Large Business Customers. Most farming enterprises would fall into the Standard Asset Customer (SAC)
which generally includes customers with annual electricity consumption below 4GWh per year, whose
supply arrangements are consistent across the customer group; and where there is no contribution for
their dedicated connection assets. SAC Non-Demand are customers within SAC with consumption less
than 100 MWh per year (in Queensland) and who are on consumption (kWh) tariffs. SAC Demand are
customers within SAC with consumption greater than 100 MWh per year and less than 4 GWh per year
and who are on demand (kW) tariffs.

There are a fewer number of primary agricultural activities which fall into the Connection Asset
Customer which includes customers with electricity consumption greater than 4GWh but less than
40GWh per year at a single connection point; or where demand is greater than or equal to 1 MVA; or
where a customer has a dedicated supply system with significant connection assets or the customer
has contributed to their dedicated connection assets.

Background: Agricultural Tariff Trial
QFF acknowledges the work undertaken by Energy Queensland on the Agricultural Tariff Trial. The trial
included participation at 191 sites (NMI points) including options:
    • Tariff 33;
    • Tariff 24; and
    • ‘Load profile’ group which received ‘smart meters’ to record regular consumption data.

Tariff 33 is an ‘economy tariff’ also called ‘controlled load’ or ‘off peak’ tariff, providing electricity for
up to 18 hours per day at a discounted rate of around 15 per cent.

Tariff 24 is a seasonal time of use demand tariff for small business customers. It provides a continuous
supply of electricity at a flat rate per kilowatt hour (kWh). It also has demand charges, based on the
average kilowatt (kW) demand for electricity between 10am and 8pm weekdays for the four highest
demand days each month. Outside the summer peak period, the minimum chargeable demand under
this tariff is 3kW. Such a tariff could be suitable for farmers who are able to shift most of their
electricity demand outside the peak times of 10am to 8pm, Monday to Friday, as there is no demand
charge applied outside of the peak period, including all day on weekends.

The Load Profile Group received smart meters to permit for regular and detailed consumption data
which would provide a position of informed decision-making when choosing an appropriate electricity
tariff.

The table below summarises the distribution of the agricultural participants:

                                  Trial Group                             TOTAL
                                  Group 1 (T33)                             5
                                  Group 2 (T24)                             4
                                  Group 3 (Load Profile)                   182
                                  TOTAL                                    191

The call for participants for this trial coincided with Cyclone Debbie and with drought declarations
covering nearly 70 per cent of the state, meaning that most farms were eligible for drought electricity
tariffs1. Treasury provided a ‘no worse off guarantee’ for participants on the T24 trial but refused a no-

1The Drought Relief from Electricity Charges Scheme (DRECS) provides relief from supply charges on electricity accounts that
are used to pump water for farm or irrigation purposes. Financial assistance is available in drought-declared areas or if a
property has been individually drought-declared. Farmers can apply for a waiver or reimbursement of supply charges on all
relevant electricity accounts.

Energex and Ergon Energy Network Tariffs 2020-25, July 2018                                                            2 of 9
worse off guarantee for T33 trial participants (the interruptible load tariff), discouraging those farmers
on drought tariffs to participate.
The trial also highlighted some operational matters.
• There were nine, ‘failed meter installs’ which relate to insufficient phone coverage for the
modem to reliably connect (requires adequate Telstra coverage). Regional ‘black spots’ and
poor or intermittent coverage are ongoing state-wide issues.
• Other sites with digital meters installed required EQ to install more powerful antennae to
confirm communications can be suitable. Some of these sites missed the Power of Choice
regulatory change-over deadline of 1 December 2017 and, as such, Ergon Network ceased
being the meter provider. Ergon did provide alternative arrangements for those meter changes
to be undertaken under the new regulatory framework.
• There were 52 NMIs with CT meters. These NMI’s were originally excluded from the trial until
an exemption with regards to changing the meter status was obtained from the energy
regulator.
• The trial required changing billing frequency from quarterly to monthly. This did not suit
several applicants due to cash flow considerations.
• Participants on T24 have, for the most part, been considerably worse off. Some NMIs were
refused participation onto the trial as their usage patterns did not support T24 and were
instead directed to the Load Profile Group.
• The T24 trial has indicated that T24 is unsuitable for farms with large loads during summer
months. For many farming operations, climatic factors during the summer months and crop
needs mean that this tariff is costly during summer. If farmers were able to easily transfer
between tariff options at no cost throughout the year to reflect energy demand, then T24
may constitute part of a suite of tariffs used. However, evidence to date indicates that T24 is
unsuitable for a ‘set and forget’ approach.
QFF strongly supports the accessibility of a controlled load tariff (T31 and T33) for agricultural users.
QFF notes that the current Gazette2 states that:
Interruptible supply tariffs
General:
These tariffs are applicable when electricity supply is:
(a) connected to approved apparatus (e.g. pool pump) via a socket-outlet as approved by the
retailer; or
(b) permanently connected to approved apparatus (e.g. electric hot water system) as approved by
the retailer (but not applicable if provision has been made to supply the apparatus under a different
tariff during the supply interruption period).
The retailer will arrange the provision of load control equipment on a similar basis to provision of
the required revenue metering.
In addition to the general requirements above, this tariff (T33) is also applicable as a primary tariff at
the absolute discretion of the Retailer. It is QFF’s understanding that both T31 and T33 are already
available to agricultural users but that the communication of this opportunity has not occurred.
2 Queensland Government Gazette. Retail Electricity Prices for Contract Standard Customers. 31 May 2018. Vol 378, No.22.
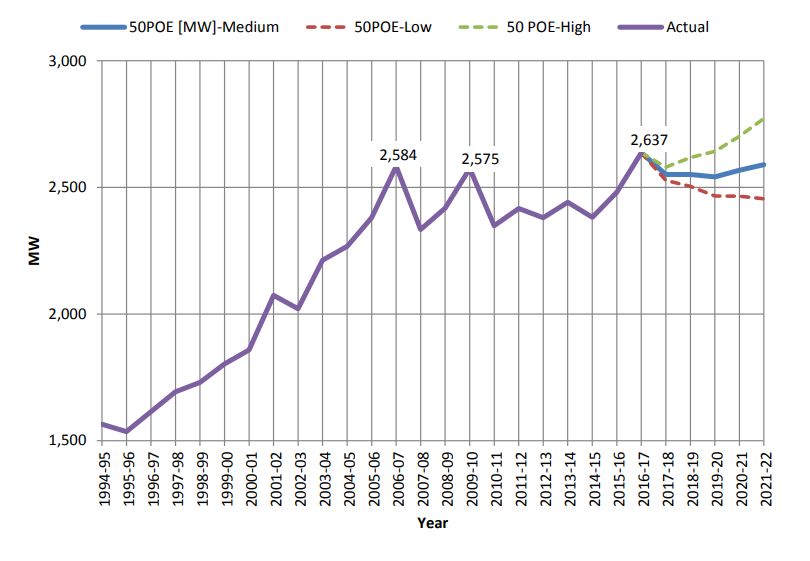
Energex and Ergon Energy Network Tariffs 2020-25, July 2018 3 of 9QFF seeks clarification of the availability of T31 and T33 for agricultural producers and suggests a joint communication campaign on opportunities for Queensland’s intensive agricultural sector. Whilst an interruptible load will not be appropriate for the entirety of the intensive agricultural sector, it will suit many users, particularly with the integration of on-farm embedded generation. The usage rates associated with these tariffs (T31 – 17.433 c/kWh and T33, 21.050 c/kWh) are more financially comparable to non-network alternatives including diesel (around 20 c/kWh) and solar (< 9 c/kWh which includes the cost of the panels on a 15-year service agreement). New technology costs associated with non-network generation solutions including solar, on-farm wind, and battery storage are decreasing exponentially. Electricity costs (tariffs) need to be competitive with these technologies if farmers are to remain grid-connected. Long Run Marginal Cost QFF supports Energy Queensland’s (Energex and Ergon Energy) review of the approach currently used to develop estimates of the Long Run Marginal Cost (LMRC) for the distribution networks. QFF understands that Ergon’s demand charges are based on its LRMCs, which express the costs of satisfying extra demand on the network. If there is spare capacity in the network, satisfying extra demand will incur short-run costs. In the long run, satisfying extra demand requires augmentation of the network capacity. To reflect the long-run or long-term costs, the LRMC consider capital programs and demand forecasts into the future. Ergon uses the annual incremental cost (AIC) approach to calculate the LRMC. The AIC is: present value of growth capital costs plus present value of growth operating costs divided by present value of annual demand growth. Figure 1: The concept of LRMC when applied to pricing (effects of increasing demand on network expansions) If the LRMC are lower than the value consumers place on demand, demand for electricity will increase (expansion will occur). Forecasts of demand into the future will increase, if the same demand growth rate applies. At some point, the extra demand will require network expansions sooner, increasing the present value of growth capital costs. This will increase the LRMC until they match how much consumers value network capacity. Energex and Ergon Energy Network Tariffs 2020-25, July 2018 4 of 9
Conversely, if the LRMC are higher than consumers value electricity, demand will decrease until the
LRMC match demand.

Ergon’s calculation of LRMC
Ergon’s demand charge is based on LRMC derived from the Ergon-proposed, and AER-approved,
forward capital program. QFF is a member of the Regulatory Proposal (RP) and Tariff Structure
Statement (TSS) Working Group and have attended the Deep Dive sessions including those relating to
future forecasts of expenditure.

Ergon has five categories of direct capital costs (Figure 2), which shows the average portions of
approved annual capex between 2015–16 and 2019–20. Ergon’s total average annual capital
expenditure over the 2015–16 to 2019–20 period was forecast to be $572 million.

Ergon attributes a portion of its annual capital expenditure to demand growth, which is then used in
the calculation of LRMC3. Ergon’s apportionment to demand growth is:
     •    100 per cent of augmentation capital expenditure
     •    50 per cent of connection capital expenditure
     •    2.5 per cent of replacement capital expenditure.

Figure 2: Ergon’s direct capital cost distribution4

Using these percentages, Ergon apportions an average of 33 per cent of annual capital expenditure to
demand growth. When these costs are entered into the LRMC formula, Ergon forecasts between 15
and 60 per cent of its allowable revenue can be recovered, based on future demand growth (Table 1
below).

3
    Ergon, Supporting Information—Revised Tariff Structure Statement, 2016.
4
    Electricity Pricing Inquiry, November 2016. | Ergon Energy determination 2015–20.

Energex and Ergon Energy Network Tariffs 2020-25, July 2018                                         5 of 9
Table 1: Ergon’s LRMC estimates5
Distribution system LRMC per kVA of demand LRMC as a portion of
level ($/kVA) allowable revenue
Sub-transmission $19–$22 16%–18%
High voltage bus $66–$78 25%–30%
High voltage line $198–$236 43%–51%
Low voltage bus $246–$294 37%–54%
Low voltage line $308–$368 50%–60%
QFF’s observations on factors that have an impact on Ergon’s LRMC from the current regulatory price
path are that Ergon:
• has spare capacity in its network
• has allocated 100 per cent of augmentation capital expenditure to growth in demand.
As such, QFF questions the validity of the of the LRMC approach to setting the level of demand
charges and, therefore, demand-based revenues.
Spare capacity
Ergon’s annual planning report shows that the total network demand will have low growth up to
2021–22. In Ergon’s medium forecast, demand is projected to decrease until 2019–20, and will
continue to decrease until 2021–22 under the ‘low’ scenario (Figure 3).
Figure 3: Ergon system-wide peak demand growth6
The presence of spare capacity is also shown in components of the network. For example, in the AER
published forecast utilisation of substations in its determination (Figure 4 below) only 20 out of Ergon’s
252 zone substations are forecast to be above 90 per cent capacity by 2020, which is the trigger for
augmentation. Accordingly, 232 zone substations are forecast to be below 90 per cent capacity by
2020.
5 Ergon, Supporting Information—Revised Tariff Structure Statement, 2016.
6 Ergon, Ergon Energy Distribution Annual Planning Report 2017–18 to 2021–22, 2017.
Energex and Ergon Energy Network Tariffs 2020-25, July 2018 6 of 9Figure 4: Zone substation forecast utilisation 2015 to 2020 (without additional augmentation)7 Further analysis of Ergon’s capital program would increase our understanding of the relationship between spare capacity in Ergon’s network and its capital program. QFF therefore suggests clarification of this for Deep Dive (Session 5). Apportionment of capex to demand growth Ergon has allocated 100 per cent of its augmentation to demand growth for its calculation of the LRMC. We note the AER’s determination states: The main driver of augex (augmentation capex) is maximum demand and its effect on network utilisation. It can also be triggered by the need to upgrade the network to comply with quality, safety, reliability and security of supply requirements8. Ergon’s previous submission also discusses network augmentation to allow increases in energy usage. QFF seeks clarification if this will be included in the next submission. QFF also requests that EQ provide historical data of actuals versus estimated LRMC over the previous regulatory periods before providing comment on the proposed approaches to estimating LRMC for 2020-25. Defining Peak Windows QFF supports Energy Queensland’s review of the ‘peak windows’. The intensive agricultural sector has limited ability to ‘shift’ electrical demand to purely meet off-peak price signals. Climatic factors, crop needs, and animal welfare dictate electricity usage and time of use across the sector. Whilst some industries have flexibility to alter patters of use, this is limited by cropping methods as well as supporting infrastructure on-farm (such as balancing storages, diesel pumps etc). The existing empirical literature on the impacts of climate change on the electricity sector has focused on changing electricity consumption patterns. Incorporating impacts on the frequency and intensity of 7 AER, Attachment 6 – Capital expenditure | Ergon Energy determination 2015–20, 2015. 8 AER, Attachment 6 – Capital expenditure | Ergon Energy determination 2015–20, 2015. Energex and Ergon Energy Network Tariffs 2020-25, July 2018 7 of 9
peak load consumption during hot days implies sizable required investments in peak generating
capacity (or major advances in storage technology or the structure of electricity prices), which results
in substantially larger impacts than those from just changes in overall consumption. QFF notes that this
approach has resulted in over-investment in the networks.

It has been suggested that climate change impacts on the electricity sector will account for the
majority of global economic damages by the end of the current century and beyond. The empirical
literature has shown significant increases in climate-driven impacts on overall consumption yet has not
focused on the cost implications of the increased intensity and frequency of extreme events driving
peak demand, which is the highest load observed in a period.

Prior work has examined the relationship between electricity load, the quantity of electricity
demanded, and temperature at the regional and local level. Estimates to date have focused primarily
on aggregate consumption impacts using state-level monthly averages of residential electricity load,
high-frequency data at the single-state or regional level, and residential billing data from electricity
utilities. It is noted that efforts to quantify peak impacts rely on structural models and highly
aggregated consumption data. It will become increasing imperative to forecast beyond the support of
simple temperature distributions, particularly as peak load, at both the daily and annual levels, is
impacted by climate change far more than is average load (consumption).

QFF also notes that electricity cannot currently be cost-effectively stored at scale, hour-to-hour
variability in demand significantly impacts production costs. Queensland has over 1.2GW of committed
large-scale solar PV projects underway with a broader ‘project pipeline’, including an additional
7.5GW. Whilst not all the projects in the pipeline will make it to construction, Queensland is set to
become the solar capital of Australia. Many of these developments are in regional areas, particularly
within agricultural hubs. These facilities produce large volumes of energy which often coincide with
high agricultural demand (e.g. irrigating, cooling produce or animals on hot, sunny days).

QFF suggests investigating the opportunities for supplying excess energy (where generated) to local
agricultural production at cost-effective rates (an ‘excess electron’ tariff).

As a low-end estimate, Powerlink suggests around 10.5GW of available capacity. This compares to
approximately 7.5GW of capacity needed to reach a 50 per cent renewable energy target. However,
there may be situations where generators of all types face localized constraints, due to the load in the
area, generation profile and other issues. Powerlink, and Energy Queensland will aim to minimise
these through a rigorous connection processes and local agricultural demand may provide mutually
beneficial opportunities.

Transitional Tariffs
QFF appreciates that the decision regarding the deadline for transitional and obsolete tariffs (30 June
2020) rests with the State Government rather than Energy Queensland. However, QFF reiterates the
need to extend the transitional timeframes associated with the irrigation tariffs (T62, T65 and T66).
Despite these tariffs being classed as ‘non-cost reflective’, they have risen a minimum of 136 per cent
over the past decade, and for some more than 200 per cent, while CPI has increased by just 24 per
cent over the same period.

Farming businesses already struggling to cope with unsustainable electricity price increases will be
unable to continue operation when this occurs. At the end of 2016, there were about 42,000 regional
businesses currently on eight different tariffs classified as transitional or obsolete. About 17,400 of

Energex and Ergon Energy Network Tariffs 2020-25, July 2018                                         8 of 9
these connections are for farming and irrigation purposes9,10. As far as QFF understands, there have
been no notable changes to these figures with farmers remaining on these tariffs. The prevalence of
drought declarations across the state (including T66 provisions) have also hindered any progression by
farmers to investigate other tariff options; as has the lack of usage data available to them to make an
informed decision on the viability of existing demand and time of use tariffs.

With less than two-years to provide tariff options and insufficient on-farm data, immediate
consideration must be given to extend the 2020 deadline for transitional and obsolete tariffs.

If you have any queries about this submission, please contact Dr Georgina Davis at
georgina@qff.org.au.

Yours sincerely

Travis Tobin
Chief Executive Officer

9 Queensland Productivity Commission. (2016). Electricity Pricing Inquiry 2016. Chapter 10: Rural and Regional Industries –
Transitional and Obsolete Tariffs.
10 Queensland Government (2016), Queensland Government response to the Queensland Productivity Commission Electricity

Pricing Inquiry, November 2016.

Energex and Ergon Energy Network Tariffs 2020-25, July 2018                                                           9 of 9
You can also read