Quick Start Exercises - January 2019 - Granta Design
←
→
Page content transcription
If your browser does not render page correctly, please read the page content below
Quick Start Exercises
January 2019
CES EduPack 2019 Quick start exercises

Contents

1    Introduction................................................................................................................ 3
     1.1     About these exercises ................................................................................................. 3
     1.2     Where to find additional help ..................................................................................... 3

2    Quick start exercises for CES EduPack........................................................................ 4
     2.1     Main tools in CES EduPack .......................................................................................... 4
     2.2     Browsing and Searching .............................................................................................. 5
     2.3     Creating property charts ............................................................................................. 9
     2.4     Filtering and screening .............................................................................................. 13
     2.5     Putting it all together ................................................................................................ 18
     2.6     Process selection ....................................................................................................... 19
     2.7     Performance index finder.......................................................................................... 20
     2.8     Eco Audit Tool ........................................................................................................... 21
     2.9     Synthesizer Tool ........................................................................................................ 26
     2.10    Saving, copying, and report writing .......................................................................... 31

3    Toolbar guide and general information ................................................................... 33
     3.1     Standard toolbar ....................................................................................................... 33
     3.2     Chart Stage toolbar ................................................................................................... 33
     3.3     CES EduPack file types ............................................................................................... 33

4    Contact details ......................................................................................................... 34

© Granta Design 2019                                                                                                                         2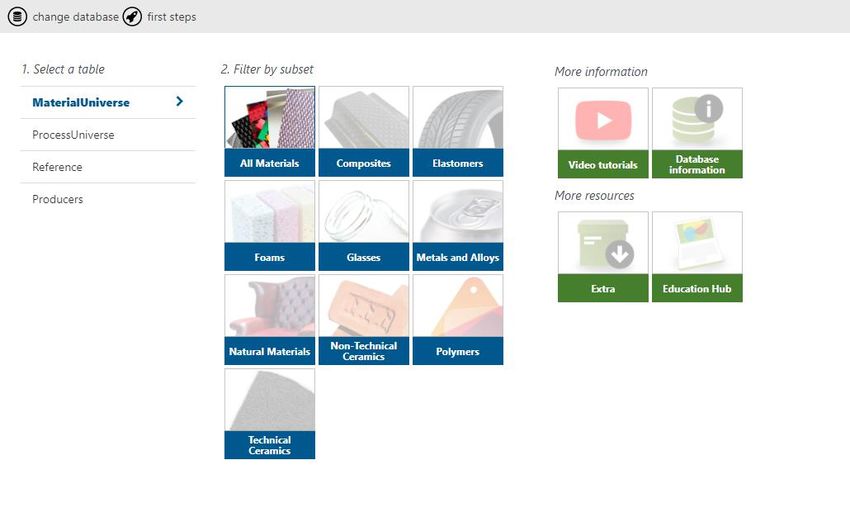
CES EduPack 2019 Quick start exercises
1 Introduction
1.1 About these exercises
These exercises provide an overview of the key tools and features in CES EduPack, and form a set
of tutorials to help you familiarize yourself with the software. You can work through them in order,
or pick and choose relevant ones, to learn about and try out different software features.
1.2 Where to find additional help
Getting started
The Installation Guide is If you have any Or see our FAQs for The Video Tutorials are
the starting point for questions or issues Educators. another way to learn
anyone who has not yet about installation, about the core
installed CES EduPack. you can refer to functionality of the
our Student FAQs. software.
Further learning
The Software Help is accessed The Learn site, accessible from Granta's Education Hub
from the Help menu, or by the main toolbar, provides self- provides teaching and learning
pressing F1. It explains the core study learning resources for resources, including videos,
functionality and tools of the students, including tables of case studies, and extra
software. material indices and glossaries databases. You can register
of materials terms. using your institutional email
address.
© Granta Design 2019 3
CES EduPack 2019 Quick start exercises

2 Quick start exercises for CES EduPack
The exercises in this section give an overview of CES EduPack and will teach you how to use the core
functionality. There is a comprehensive help file within the software that provides further guidance,
as well as containing case studies and tutorials.

2.1 Main tools in CES EduPack
The main tools in CES EduPack are:

         BROWSE                 Explore the database and retrieve records via a hierarchical index or
                                tree.

         SEARCH                 Find information via a full-text search of records.

         SELECT                 The central hub of CES EduPack, used to apply the Rational Material
                                Selection methodology. A powerful selection engine that identifies
                                records that meet an array of design criteria and enables trade-offs
                                between competing objectives.

         CHART                  Create charts and add formatting and labels to illustrate your point.

         ECO AUDIT              Quickly estimate the environmental impact of a product over its
                                entire lifecycle and study What If design scenarios. The enhanced
                                version also accounts for Secondary, Joining, and Finishing processes,
                                and allows you to apply the same What If scenarios to the economic
                                cost.

         SYNTHESIZER TOOL       Predict performance of materials by modelling new hybrid materials,
                                or modelling part cost of a design; and compare these results with
                                existing records.

The following exercises cover the use and functionality of these tools.

© Granta Design 2019                                                                                          4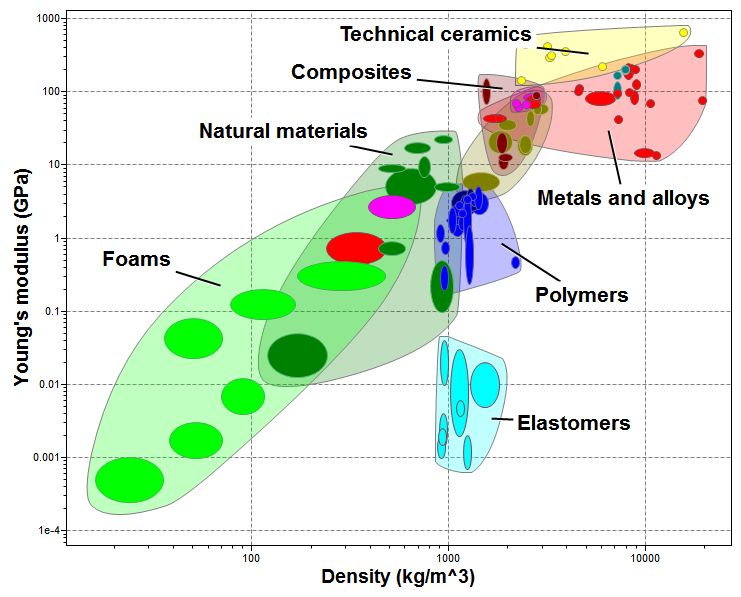
CES EduPack 2019 Quick start exercises

2.2 Browsing and Searching

                  Opening a database
On starting CES EduPack, the Databases window will appear, showing all installed databases. The
following exercises use the MaterialUniverse and ProcessUniverse tables which are found within all
Granta material databases. After clicking on a database name in the Databases window to select it,
the Homepage then opens to show a list of the available tables and a graphic for each subset.

From the homepage you can view more information on the database, select a subset, and access
online resources for students and educators.

    ❖ Select Level 2 Engineering database

          Note: Unless otherwise stated, all exercises and screenshots in this guide were
          produced using Level 2 database. Results and images may differ if you complete
          these exercises using a different database.

    ❖ Read about the available data and applications
        Click Database information to view a detailed description of the database.
        Click Back to return to the homepage.

    ❖ Select a material subset
        Click one of the subset icons, and notice that the Browse panel appears.

© Granta Design 2019                                                                                     5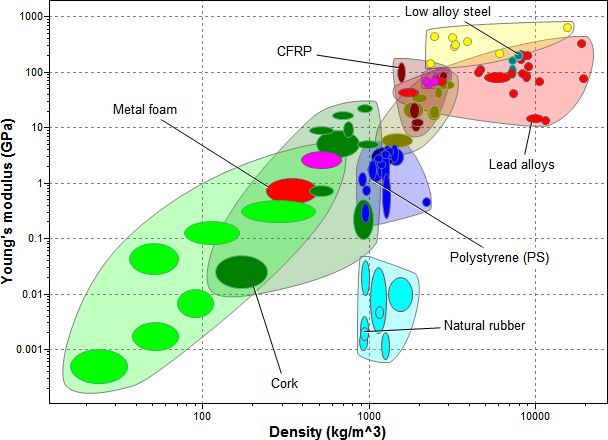
CES EduPack 2019 Quick start exercises

    ❖ Change to the PROCESSUNIVERSE table
        Click ProcessUniverse and notice that the Browse tree in the left panel updates.

    ❖ Close the HOMEPAGE
        Click the cross at the top of the Homepage tab. This page can be reopened at any time by
        clicking Home on the main toolbar.

    ❖ Change to the MATERIALUNIVERSE table
        With the Homepage closed, navigate to different tables using the Table list in the Browse
        panel.

            Browse              Search               Select

          Table:       MaterialUniverse

          Subset:      All materials

                    Browse material records

    ❖ Select the MATERIALUNIVERSE table and the ALL MATERIALS subset

             Browse              Search              Select

          Table:       MaterialUniverse

          Subset:      All materials

                   MaterialUniverse
                     Ceramics and glasses
                     Hybrids: composites, foams...
                     Metals and alloys
                    Polymers and elastomers

    ❖ Find the record for STAINLESS STEEL
        Double-click a folder in the browse tree to view the records and folders below it.

    ❖ Open the FOLDER-LEVEL record for POLYMERS
        Folder-level records provide a general overview of a material family, rather than containing
        data on a specific material. They have their own icon:   .

© Granta Design 2019                                                                                      6
CES EduPack 2019 Quick start exercises
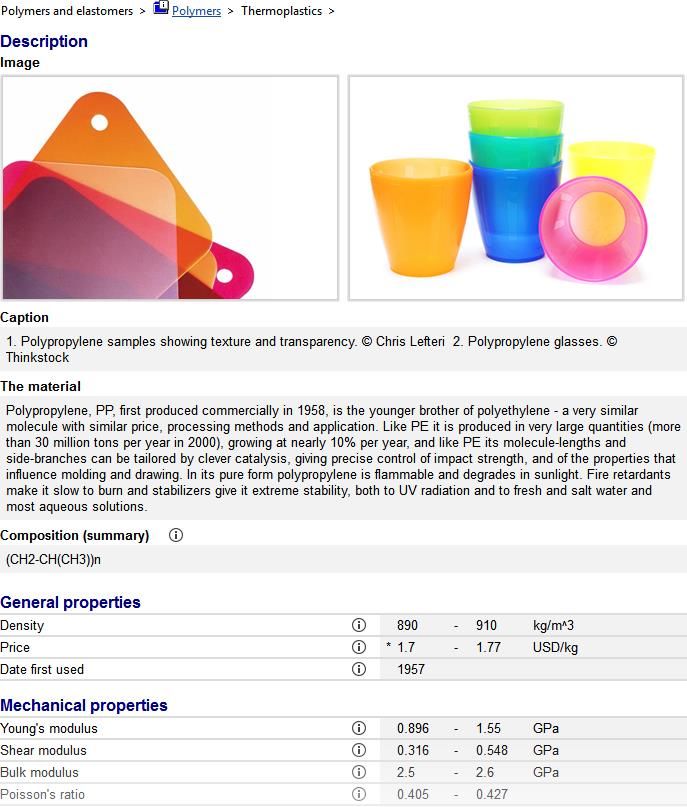
❖ Open the POLYPROPYLENE record
Double-click the record name in the tree to view the datasheet.
Click to view the science note for more information on the property and to drill down to
the underlying science. In Level 3 databases, this will bring up the design note, which provides
background information on properties, test notes, and selection guidelines. From a design
note, there will be a link to the corresponding Science Note.
Right-click the datasheet to see a menu with further actions, for example, locate in Browse
tree, copy the datasheet, print the datasheet, and export the data in an FE package format.
❖ Find processes that can shape POLYPROPYLENE, by clicking the ProcessUniverse link at the
bottom of the datasheet.
Part of the Polypropylene Level 2 datasheet:
© Granta Design 2019 7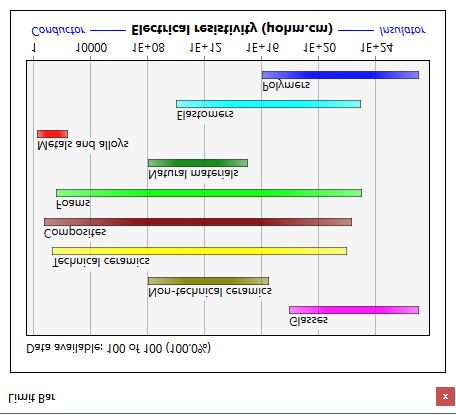
CES EduPack 2019 Quick start exercises

                    Browse process records

    ❖ Browse ProcessUniverse: All Processes

             Browse               Search    Select

          Table:       ProcessUniverse

          Subset:      All processes

                   ProcessUniverse
                     Joining
                     Shaping
                     Surface treatment

    ❖ Find the record for the shaping process INJECTION MOLDING, THERMOPLASTICS

    ❖ Find the record for the surface treatment process VAPOR METALLIZING (PVD)

    ❖ Find the record for the joining process FRICTION WELDING (METALS)

    ❖ Find materials that can be DIE CAST, using the link to the MaterialUniverse at the bottom of
      the datasheet for GRAVITY DIE CASTING

                    Searching

    ❖ Find the material POLYLACTIDE

            Browse                Search   Select

                    Polylactide

    ❖ Find the process VACUUM ASSISTED RTM

    ❖ Find the materials used as CUTTING TOOLS
        The search matches text on a datasheet. For example, a search for cutting tools would return
        all records with the phrase cutting tools in the record description or supporting information.

© Granta Design 2019                                                                                      8
CES EduPack 2019 Quick start exercises
❖ Find the material CONCRETE
The search matches the record's folder name. If the search term appears in a folder name, all
records under that folder will be returned; for example, a search for concrete would return
all records in the folder named Cement and concrete e.g. Plaster of Paris.
❖ Enter the search term ALUM*
Records containing the term Alumina or Aluminum or Alumino are returned.
Advanced searches
The following search operators are available:
AND Finds records containing both the search terms, so steel AND alloy
returns only records containing both the words steel and alloy
OR Finds records containing either search term, so steel OR alloy returns all
records that contain steel, alloy, or both
NOT Finds records containing the first search term, but not the second, so
steel NOT alloy returns only records with the word steel but without the
word alloy
Phrase Search Finds the exact search term, so “steel alloy” will return only records
containing the exact phrase steel alloy
Parentheses Used to group search terms, so iron AND (ore OR cast) will return the
records containing iron and containing either ore, cast, or both
Wildcards Use ? as a wildcard single character, or * as a wildcard representing any
number of characters (cannot be used as the first character in a search
string)
Note: AND operators are automatically added when a search has two or more terms
and no other operators have been entered.
2.3 Creating property charts
Bar charts and bubble charts are a great way to visualize and communicate material properties, as
well as being a key tool to support systematic materials selection.
Create a bar chart
❖ Select MaterialUniverse: All materials
Click Chart/Select, and then select MaterialUniverse: All materials.
❖ Create a bar chart of YOUNG’S MODULUS (E)
Under Selection Stages, click Chart.
Set the y-axis attribute to Young's modulus, and click OK.
For a bar chart in CES EduPack, you do not set an x-axis: leave x-axis attribute set to .
© Granta Design 2019 9CES EduPack 2019 Quick start exercises
Browse Search Select
1. Selection Data
Select from: MaterialUniverse: All materials
2. Selection Stages
Chart Limit Tree
Chart Stage
Y-axis
Attribute: Young s modulus
❖ Explore the chart
Click Zoom in and then drag to zoom in on an area of the chart.
Click Zoom out to zoom out.
Click Autoscale to zoom back to view the whole chart again.
❖ Label records on the chart
Click a record on the chart and then drag to add and position a new data label.
To delete a data label, select it, and press DELETE. To delete all labels in the chart, press
CTRL+A and then press DELETE.
© Granta Design 2019 10CES EduPack 2019 Quick start exercises
Create a bubble chart
❖ Make a bubble chart plotting YOUNG'S MODULUS (E) against DENSITY (ρ)
Under Selection Stages, click Chart.
Set the y-axis to Young’s modulus and set the x-axis to Density.
Leave the Axis Settings as default values to create a log-log plot.
Browse Search Select
1. Selection Data
Select from: MaterialUniverse: All materials
2. Selection Stages
Chart Limit Tree
Chart Stage
X-axis Y-axis
Attribute: Density Attribute: Young s modulus
❖ Display family envelopes
Click to look at how data for a given family of materials cluster together.
❖ Label records on the chart
Hover the cursor over the record bubble to see the record name, and then label some
records (click over a record and drag).
Try adding labels from the Results list: right-click a record in the list, and select Label on the
shortcut menu, then then drag the label where you want it on the chart.
If the new label isn’t visible at the current zoom, click Autoscale to display the whole
chart again.
© Granta Design 2019 11CES EduPack 2019 Quick start exercises
❖ Delete this stage
Select the stage in the Selection Stages list and press DELETE.
© Granta Design 2019 12CES EduPack 2019 Quick start exercises
2.4 Filtering and screening
Selection using a chart stage
When plotted on a Chart Stage, records can also be filtered using the Index line and Box selection
tools.
Browse Search Select
1 Bar chart
1. Selection Data
Box
Select from: MaterialUniverse: All materials selection
Yield strength
2. Selection Stages
Chart Limit Tree
2 Bubble chart
3. Results X out of Y pass Yield strength Index lin e
Material 1
Material 2
Material 3
Material 4
Density
etc.
❖ Create a bar chart of YIELD STRENGTH (σy)
Set the y-axis to Yield strength (elastic limit).
© Granta Design 2019 13CES EduPack 2019 Quick start exercises
❖ Use a Box selection to identify materials with high values of YIELD STRENGTH
Click Box selection , then drag to define the selection box.
❖ Add DENSITY (ρ) to the x-axis
Click Chart Settings then click the X-Axis tab and select Density as the x-axis attribute.
❖ Use an INDEX LINE to identify materials with high values of the specific strength σy / ρ
Click Index and display lines .
Use the default Slope value of 1.
The objective of the line is set to Maximize the index by default, which will result in selection
of materials above the line, for high values of σy / ρ.
Click OK and then click the chart to position the line through a particular point.
Drag the line upwards to refine the selection to fewer materials.
© Granta Design 2019 14CES EduPack 2019 Quick start exercises
❖ Add a Box selection to the chart to identify materials with low DENSITY that maximize the
index.
❖ Rank the results by specific strength (YIELD STRENGTH / DENSITY)
Show: Stage 1: Yield strength v. Density
Rank by: Stage 1: Index value.
Example results: Bamboo, Paper, Foam.
❖ Delete this stage
Select the stage in the Selection Stages list and press DELETE.
© Granta Design 2019 15CES EduPack 2019 Quick start exercises
Selection using a limit stage
Browse Search Select
1. Selection Data
Select from: MaterialUniverse: All materials
Limit Stage
2. Selection Stages
Mechanical properties
Chart Limit Tree
Thermal properties
Min Max
3. Results X out of Y pass Max. service temp. 200 °C
Material 1
Thermal conductivity 25 W/m.°C
Material 2
Material 3
Electrical propertie s
Material 4
etc. Min Max
Electrical resistivity 1e15 μohm.cm
Limit
guidance
❖ Select materials with specific thermal and electrical properties.
Create a new Limit Stage with the following criteria:
MAX. SERVICE TEMPERATURE > 200 °C
THERMAL CONDUCTIVITY > 25 W/m.°C
ELECTRICAL RESISTIVITY > 1e15 μohm.cm
Example results: Aluminum nitride, Alumina, Silicon nitride.
Use the limit bars for guidance on suitable values. Enter the limits – minimum or maximum
as appropriate – and click Apply.
You can change the units on the datasheet by clicking the Units tab under Settings on the
main toolbar.
❖ Filter the results further to select only materials with non-opaque TRANSPARENCY.
Under Optical Properties, in the Transparency list, select Translucent, Transparent, and
Optical quality.
Click Apply.
Example results: Alumina and Silicon nitride.
© Granta Design 2019 16CES EduPack 2019 Quick start exercises
Selection using a tree stage
Using a Tree Selection Stage, you can filter records based on their links to records in other data
tables, or based on the database hierarchy (tree). For example, you can filter records that are linked
to specific process record.
Browse Search Select
1. Selection Data
Select from: MaterialUniverse: All materials
2. Selection Stages
Tree stage for processes
Chart Limit Tree Casting
Joining
Shaping Deformation
Process
Surface Machining
3. Results X out of Y pass treatmen t Molding
Material 1
Material 2
Material 3
Material 4
etc.
❖ Find materials that can be MOLDED
Under Selection Stages, click Tree. In the Tree Stage window, select ProcessUniverse and
navigate to Molding. Select the folder and click Insert, then click OK.
❖ Click Show to view a list of MaterialUniverse records to which this process folder is linked.
Double-click a record name to view its datasheet.
❖ Delete this stage.
❖ Find processes to join FERROUS METALS AND ALLOYS
In the Selection Project panel, under Selection Data, select ProcessUniverse: Joining.
Under Selection Stages, click Tree. In the Tree Stage window, select MaterialUniverse,
expand Metals and alloys, select Ferrous, and then click Insert followed by OK.
Click Show to view the linked records.
❖ Delete this stage.
© Granta Design 2019 17CES EduPack 2019 Quick start exercises
2.5 Putting it all together
Combining filtering and charting tools
Browse Search Select
1. Selection Data
1 Limit stage
Select from: MaterialUniverse: All materials Min Max
Density 2000
Yield strength 60
2. Selection Stages
T-conductivity 10
Chart Limit Tree
2 Tree stage
Casting
3. Results X out of Y pass; ranked by PRICE Forming
Join
Defo rmation
Material 1 Process Shape
Machining
Material 2
Surface
Molding
Material 3
Powder
Material 4
etc.
3 Chart stage
Price
❖ Choose the data table
Select from: MaterialUniverse: All materials.
❖ Select materials with specific physical, mechanical, and thermal properties.
Create a Limit Stage with the following criteria:
DENSITY < 2000 kg/m^3
YIELD STRENGTH (Elastic limit) > 60 MPa
THERMAL CONDUCTIVITY < 10 W/m.°C
❖ Filter the results to find those that can be THERMOFORMED
Create a Tree Stage and insert ProcessUniverse > Shaping > Molding > Thermoplastic molding
> Thermoforming.
❖ Rank the results by PRICE and find the three cheapest materials
Create a Chart Stage with a bar chart of Price on the y-axis. On the Chart Stage, all materials
that fail one or more stages are grayed out. The Results window by default lists the materials
that pass all stages.
In the Rank by menu, select Stage 3: Price.
© Granta Design 2019 18CES EduPack 2019 Quick start exercises
2.6 Process selection
The chart, limit, and tree selection stages can be used to filter ProcessUniverse records in the same
way as with MaterialUniverse.
Select process records
Browse Search Select
1. Selection Data
1 Limit stage
Select from: ProcessUniverse: Shaping
Shape
Dished sheet ✓
2. Selection Stages
Economic compatibility
1 2
Chart Limit Tree Economic b atch s iz e (units) 1000
Physical and quality attributes
Mass range 10 12 kg
Range of s ection thickness 4 4 mm
Process characteristics
Primary sh ap in g processes ✓
2 Tree stage
Ceramics
Hybrid s
Material
Metals Elastomers Thermoplastics
Polymers
Polymers Thermos ets
❖ Select the data table
Select from: ProcessUniverse: Shaping.
❖ Find PRIMARY SHAPING PROCESSES to make a component with specific shape, physical, and
economic properties.
Add a Limit Stage with five criteria:
SHAPE Dished sheet
MASS 10 - 12 kg
SECTION THICKNESS 4 mm
PROCESS CHARACTERISTICS Primary shaping process
ECONOMIC BATCH SIZE > 1000
© Granta Design 2019 19CES EduPack 2019 Quick start exercises
❖ Filter the results to only include THERMOPLASTIC materials
Add a Tree Stage and insert MaterialUniverse > Polymers and Elastomers > Polymers >
Thermoplastics.
Example results: Rotational molding, Compression molding, Thermoforming.
2.7 Performance index finder
The Performance index finder is only available in some advanced editions of CES EduPack.
The Performance index finder is a tool to let you plot performance indices on a chart for a given
design situation, without having to derive an index from first principles.
Selection using the Performance index finder
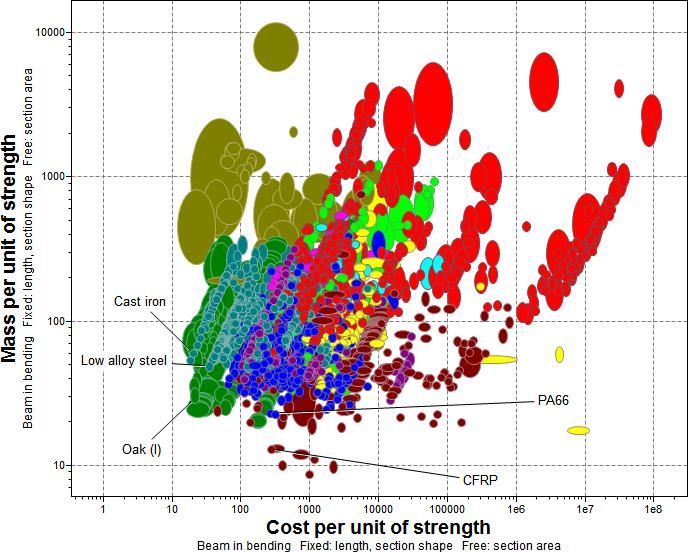
Use the performance index finder to find the materials best suited for a beam loaded in bending, as
part of a low cost, low weight, strength-limited design.
Note: You will need to use a Level 3 database for this exercise.
❖ Select the data table
Select MaterialUniverse: All bulk materials
❖ Create a chart using the Performance index finder
Click Chart, then click Performance Index Finder
❖ Set the COMPONENT DEFINITION for the y-axis
FUNCTION AND LOADING Beam in bending
LIMITING CONSTRAINT Strength
OPTIMIZE Mass
Keep the default values for free and fixed variables, and Axis settings.
❖ Set the COMPONENT DEFINITION for the x-axis
Click the x-axis tab, click Performance index finder. Set the following values:
FUNCTION AND LOADING Beam in bending
LIMITING CONSTRAINT Strength
OPTIMIZE Cost
Keep the default values for free and fixed variables, and Axis settings.
© Granta Design 2019 20CES EduPack 2019 Quick start exercises
❖ View the chart
Click OK to view the chart.
Materials in the bottom-left corner are best suited to a low weight, low cost, strength-limited
design.
2.8 Eco Audit Tool
The Eco Audit Tool is not available in the Bio-Engineering Edition of CES EduPack.
The Eco Audit Tool estimates the energy used and CO2 produced during five key life
phases of a product (material, manufacture, transport, use, and end of life), and
identifies which phase has the dominant contribution. This is the starting point for
eco-aware product design, as it identifies which parameters need to be targeted to reduce the eco-
footprint of the product.
A brand of bottled mineral water is sold in 1 liter PET bottles with polypropylene caps. A bottle
weighs 40 grams; the cap 1 gram. Bottles and caps are molded, filled, and transported 550 km from
the French Alps to England by 14 tonne truck, refrigerated for 2 days and then sold. The overall life of
the bottle is one year.
An example product file for this case study is installed with CES EduPack in the Samples folder, with
the filename Level 2 - Bottle PET.prd.
Note: The Level 3 Eco Design and Level 3 Sustainability databases contain an enhanced
version of the Eco Audit tool that contains warnings about restricted substances, and
options to include cost analysis and a secondary process in the audit. Please read the
software help, or the online teaching resources for information on how to get started
with these advanced features.
© Granta Design 2019 21CES EduPack 2019 Quick start exercises
Product definition
The following example shows how the example product file has been created.
To view an explanation of the calculations used at each stage, click Help in the heading.
1. Material, manufacture, and end of life
Bill of materials (BoM) and primary processing method.
Component Recycled Mass Primary
Qty name Material content (kg) process End of life
100 Bottle PET ... Virgin (0%) 0.04 Polymer moldi Recycle
MaterialUniverse Polymer extrusion Landfill
Virgin (0%)
Ceramics and glasses Polymer molding Combust
Electrical components Downcycle
Hybrids: composites, ... Recycle
Metals and alloys
Re-manufacture
Polymers: plastics, elas
Reuse
Thermoplastics
None
PET
100 Cap PP Virgin (0%) 0.001 Polymer moldi Landfill
100 Dead weight 1 None
2. Transport
Transportation from site of manufacture to point of sale.
Name Transport type Distance (km)
Filling plant to retailer 14 tonne (2 axle) truck 550
Ocean freight
Rail freight
14 tonne truck
(2 axle) truck
Air freight – long haul
...
3. Use
Product Life and Location Use
Product life: 1 years
Country of use: United Kingdom
France
Germany
United
UnitedKingdom
Kingdom
...
© Granta Design 2019 22CES EduPack 2019 Quick start exercises
Static Mode
Energy used to refrigerate product at point of sale (average energy required to refrigerate 100
bottles at 4°C = 0.12kW).
Product uses the following energy:
Energy input and output: Electric to mechanical (electric motors)
Power rating: 0.12 kW
Electric to thermal
Electric to mechanical (electric motors)
Usage: 2 days per year
Electric to chemical (lead acid battery)
...
Usage: 24 hours per day
4. Report
Summary chart enables rapid identification of the dominant life phase. Toggle between views of
energy usage or CO2 footprint.
The chart shows that, in this project, Material is the dominant life phase. Each life phase can be
clicked to show guidance on strategies to reduce its impact.
Detailed report provides a component-by-component breakdown of each life phase, enabling the
main contributors to the dominant life phase to be identified.
© Granta Design 2019 23CES EduPack 2019 Quick start exercises
Compare Eco Audit Projects
❖ Open the Bottle PET - Level 2 product file.
Click Eco Audit, then click Open on the Product Definition tab. Locate the sample product file
Bottle PET - Level 2.prd, located in the Samples folder in your CES EduPack installation folder.
For example:
C:\Program files (x86)\CES EduPack 2019\Samples\eco_audit\en\Level 2 - Bottle PET.prd
❖ Create a copy of this product for comparison
Click Compare with on the Product Definition tab and select Copy of current product.
Eco Audit Project
Product definition
New Open Save Compare with
Copy of current product
New product
Saved product ...
❖ Change the product name to “PET Bottle (Recycled)”
❖ Change the recycled content value for PET to “35%”
Click in the box to manually type in a value.
❖ Generate the SUMMARY CHART
The first life energy (not including EoL potential) is reduced by 12%.
Note: The summary chart can be copied into a document or printed using Copy and
Print at the top of the chart window.
© Granta Design 2019 24CES EduPack 2019 Quick start exercises
Saving and exporting
Eco Audit projects do not form part of a selection project and therefore need to be saved separately.
❖ SAVE the product definition
Eco Audit Project
Product definition Report
New Open Save Compare with
❖ GENERATE the Eco Audit report
Click the Report tab (or click Detailed Report on the Product definition tab).
❖ EXPORT the report as a PDF
You will require a PDF reader such as Adobe Reader to view the exported report.
Eco Audit Project
Product definition Report
New Open Save Compare with
Excel
PDF
Word
© Granta Design 2019 25CES EduPack 2019 Quick start exercises
2.9 Synthesizer Tool
The Synthesizer Tool is only available in some advanced editions of CES EduPack.
The Synthesizer Tool is designed for use in the early stage of product
development. It consists of two types of models: hybrid models, for estimating the
performance of novel materials and structures; and the part cost estimator, for
calculating the cost of a component based on the material and process chain.
Synthesized records produced using the Synthesizer Tool can then be compared with existing records
in the MaterialUniverse database using selection stages.
Hybrid model: sandwich panels model
Hybrid materials and structures combine the benefits of two or more materials to produce new
materials that exhibit unique combinations of properties. For example, both composite materials and
sandwich panels are commonly used to create strong, lightweight structures.
Note: You will need to use a Level 3 database for this exercise.
❖ Make a BUBBLE CHART of YOUNG’S MODULUS (E) against DENSITY (ρ) using
MaterialUniverse: All bulk materials
As in Example 7.
❖ Use the SANDWICH PANELS MODEL to create synthesized records for a family of hybrid
materials
Click Synthesizer on the toolbar (or click Tools > Synthesizer on the menu bar).
Select the Sandwich Panels – Balanced model.
❖ Set the SOURCE RECORD values
FACE-SHEET Aluminum, 6061, wrought, T6
CORE Polymethacrylimide foam (rigid, 0.200)
Click Browse and locate the records in the browse tree.
❖ Keep the default values for MODEL VARIABLES and MODEL PARAMETERS, and set the
following RECORD NAMING values:
FACE-SHEET Al
CORE Rohacell
❖ Create the synthesized records
Click Create and then Finish. The new synthesized records are shown in the Results list and
on the Chart Stage.
© Granta Design 2019 26CES EduPack 2019 Quick start exercises
Note: Click the help icon in the Synthesizer Tool dialog to view further information
about the current model type, including details of the calculations used.
❖ Plot an INDEX LINE corresponding to a lightweight, stiff panel in bending E1/3/ρ
Click Index and display lines, enter a slope value of 3, and select maximize the index.
❖ Add labels to the source records and some of the synthesized records
You can select individual records on the chart and drag to place a label.
You can also add labels from the Results list: select one or more records in the Results list,
right-click and select Label on the shortcut menu, then then drag the labels where you want
them on the chart.
Click the Highlight synthesized records button to help you identify the synthesized
records on the chart.
Use the Zoom controls and to zoom in to the area of interest on the chart.
Synthesized records appear on the Browse tree under My Records and may be edited or deleted in a
similar way to User Defined records.
MaterialUniverse
...
My records
Synthesized
...
20mm core
0.05mm Al face-sheet Add Record
0.0834mm Al face-sheet Edit Record
Delete Record
© Granta Design 2019 27CES EduPack 2019 Quick start exercises
Part cost estimator
The Part Cost Estimator is a synthesizer model that calculates the total cost of a component based on
the material and processing costs.
Note: You will need to use a Level 3 database for this exercise.
❖ Use the Part Cost Estimator to compare the cost of a component manufactured in two
different ways: as an injection molded polymer, and as a rolled and pressed metal.
Start Synthesizer Tool by clicking Synthesizer on the toolbar and in the dialog, select
Cost – Part cost estimator.
❖ Set the COMPONENT DETAILS of the first component:
MATERIAL PP (copolymer, 20% talc)
VALUE OF SCRAP MATERIAL 10%
PART MASS 6.4
PART LENGTH 10
BATCH SIZE 1000 - 1E6
NUMBER OF VALUES 10
Note: For this exercise, the units of part mass and part length do not matter.
❖ Set the PRIMARY SHAPING PROCESS values:
PRIMARY PROCESS Injection molding (thermoplastics)
AVAILABILITY Custom form
PART COMPLEXITY Standard
Use the default values for load factor, overhead rate, and capital write-off time.
❖ Set the RECORD NAMING values:
MATERIAL PP
PRIMARY PROCESS molded
❖ Create the new records.
Click Create. Keep the Part Cost Estimator window open.
❖ Set the COMPONENT DETAILS of the second component.
In the Part Cost Estimator window, click Previous and change the COMPONENT DETAILS for
the material process:
MATERIAL YS170 hot rolled (high strength drawing quality steel)
PART MASS 10
© Granta Design 2019 28CES EduPack 2019 Quick start exercises
Use the default values for scrap material value, part length, batch size, and number of values
(retained from the first material processing chain input).
❖ Set the PRIMARY SHAPING PROCESS values:
PRIMARY PROCESS Hot shape rolling
Use the default values for the other properties.
❖ Set the SECONDARY SHAPING PROCESS.
Select Include secondary process, and enter the following value:
SECONDARY PROCESS Press forming
Use the default values for part complexity, amount of scrap, and scap recycled.
❖ Set the RECORD NAMING values:
MATERIAL Steel
PRIMARY PROCESS rolled
SECONDARY PROCESS pressed
❖ Click Create and then Finish to create the synthesized records and close the Part Cost
Estimator.
Synthesized records created using Part Cost Estimator are appended to the MaterialUniverse
browse tree under My records > Synthesized > Part cost estimator.
❖ Create a bubble chart to compare the two material processing chains.
Select MaterialUniverse: All bulk materials, click Chart, and set the following x- and y-axis
values:
CATEGORY Part cost estimator
X-AXIS ATTRIBUTE Batch size
Y-AXIS ATTRIBUTE Part cost
© Granta Design 2019 29CES EduPack 2019 Quick start exercises
❖ Change the record color for easy comparison of the two processing chains.
Navigate to My records > Synthesized > Part cost estimator. Right-click the PP, molded
subfolder, click Record color, and click a color to change the record color for all records in
that folder.
Browse Search Select
Table: MaterialUniverse
Subset: All materials
MaterialUniverse
Ceramics and glasses
Fibers and particulates
Hybrids: composites, foams...
Magnetic materials
Metals and alloys
Polymers: plastics, elastomers
My records
Synthesizer
Part cost estimator
© Granta Design 2019 30CES EduPack 2019 Quick start exercises
2.10 Saving, copying, and report writing
Adding comments and saving a project
You can add comments to a selection project as a reminder of why you have applied certain
constraints and objectives. Comments are displayed on mouse-over in the selection report, and are
saved in the project file.
Comments can be added to all selection stages in a project.
2. Selection Stages
Chart Limit Tree
Stage
Limit
Stage Settings
Stage
Title Limit
Notes
❖ Click Notes in the stage window heading to open the Stage Settings dialog, then enter
some comments in the Notes box.
❖ Save the project
On the File menu, click Save Project. Give the project a filename and directory location; the
project will be saved with the file extension .ces.
Exporting and copying
Charts, records, and results lists can be copied and pasted into a document in another application
such as Microsoft® Word, Microsoft Excel, Microsoft Powerpoint, or Notepad.
❖ Copy a chart into a document.
To copy a chart to the clipboard: in the chart window, right-click the chart and select Copy on
the shortcut menu, or press CTRL+C.
You can then paste the chart image from your clipboard into the document.
❖ Copy a datasheet into a document.
To copy a datasheet to the clipboard: display the datasheet and then right-click the
datasheet and select Copy on the shortcut menu, or press CTRL+C.
© Granta Design 2019 31CES EduPack 2019 Quick start exercises
You can then paste the data from your clipboard into the document.
❖ Copy results into a document.
To copy results to the clipboard, use SHIFT+click or CTRL+click to highlight the records you
want, then right-click and select Copy on the shortcut menu, or press CTRL+C.
To select all results in the list, right-click and select Select All on the shortcut menu, or press
CTRL+A.
You can then paste the results from your clipboard into the document.
❖ Edit the document you have created.
© Granta Design 2019 32CES EduPack 2019 Quick start exercises
3 Toolbar guide and general information
3.1 Standard toolbar
Estimate the
View database Search the environmental Access learning Change CES EduPack
homepage database impact of products resources settings
Browse the Select records using Model and predict Search Web and Open CES EduPack
database tree design criteria performance of other tools Help
materials
3.2 Chart Stage toolbar
Add an Create curve Highlight
index line Zoom out annotation favorite records
Edit stage Delete all lines Add text Show results from Highlight
properties and boxes label all enabled stages user defined records
Select chart records Zoom to view Show material Highlight
by dragging all records family envelopes synthesized records
Select items and add Zoom in Create arrow Hide failed Find records near
record labels annotation records selected record
3.3 CES EduPack file types
*.gdb Granta Database file
*.ces CES Project file
*.cet Selection Template file
*.frl Favorites file
*.prd Eco Audit Product Definition file
© Granta Design 2019 33CES EduPack 2019 Quick start exercises
4 Contact details
If you have any questions, you can contact us at info@grantadesign.com or at one of the phone
numbers below.
International Headquarters: Tel: +44 (1)1223 518895
Fax: +44 (0)1223 506432
USA Headquarters Toll-free: 1-800-241-1546
Fax: 1-216-274-9812
France Appellez-nous au numéro vert: 08 00 76 12 90
Fax: 01 53 01 69 66
Germany Tel: 089 921 315 230
Granta für Lehre: 0800 182 5026
Fax: 08005 89431 5000
For further details, see the contact details page of the Granta Design website,
www.grantadesign.com.
We welcome feedback on this documentation. Please let us know if anything is unclear, if you spot an error, or have an idea
for new content, by emailing docs@grantadesign.com.
Document version: CES-E19.01
Published: March 2019
© Granta Design 2019 34You can also read