Quick Start Guide for Spectrum 2019 - unaids
←
→
Page content transcription
If your browser does not render page correctly, please read the page content below
Quick Start Guide
  for Spectrum

       2019

      January 2019
Contents
Part I. Overview of estimates and projections tools ................................................3
      A. Purpose of estimation and projection models .................................................. 3
      B. Technical oversight of Spectrum ....................................................................... 3
      C. Process of creating estimates and projections using Spectrum ........................ 3
      D. What are the major changes in the 2019 software........................................... 4
      E. Preparing to develop a Spectrum file ................................................................ 6

Part II. Using the Spectrum Software ......................................................................8
      Step 1. Install the most recent version of Spectrum ............................................. 8
      Step 2. Start Spectrum ........................................................................................... 9
      Step 3. Update the population projection ........................................................... 11
      Step 4. Specify eligibility for treatment ............................................................... 13
      Step 5. Enter program statistics ........................................................................... 15
      Step 6. Restore default values in Advanced options .......................................... 21
      Step 7. Deriving Incidence.................................................................................... 22
      Step 8. EPP Incidence: Configuration ................................................................... 26
      Step 9. Incidence: Entering surveillance and survey data ................................... 36
      Step 10. Incidence: Curve fitting .......................................................................... 43
      Step 11. Case surveillance and vital registration (CSAVR) fitting tool ................. 55
      Step 12. Set the pattern of incidence by sex and age ......................................... 59
      Step 13. Results ................................................................................................... 61
      Step 14. Uncertainty analysis ............................................................................... 64
      Step 15. Save the projection ................................................................................ 66
      Step 16. Comparing projections........................................................................... 66
      Step 17. Creating alternate projections ............................................................... 66

ANNEX 1. Managing Templates ............................................................................ 67

ANNEX 2. Creating a new population projection ................................................... 68

ANNEX 3 Using the Hierarchical Model in EPP ...................................................... 70

                                                                                                                           2
Part I. Overview of estimates and projections tools

A. Purpose of estimation and projection models

A well-planned response to the HIV epidemic requires accurate information about
the disease over time. Mathematical models are often the most appropriate way to
describe the HIV epidemic and the impact of the response because it is impossible to
count the exact number of people living with HIV, people who are newly infected
with HIV or people who have died from AIDS-related causes in any country over
time.

UNAIDS and partners have supported the development of the AIDS Impact Module
in the Spectrum software to assist countries to monitor their HIV epidemic. The
software uses HIV surveillance, survey and program data, combined with
demographic data, to generate historical trends and short-term projections of key
indicators. These indicators, including the number of people living with HIV, the
number of new infections, the number of pregnant women infected with HIV,
mortality due to AIDS and treatment coverage, are useful in assessing epidemic
trends and the overall impact of the response and in planning for future health care
service and pharmaceutical needs.

B. Technical oversight of Spectrum

The UNAIDS Reference Group on Estimates, Modelling and Projections oversees the
development and revision of the Spectrum software. The group is composed of
experts from multiple disciplines and institutions, including epidemiologists,
demographers, clinicians, statisticians, modelers, and program implementers. The
Reference Group meets twice a year to discuss revisions and updates the software
routinely. For more information on the Reference Group go to www.epidem.org

C. Process of creating estimates and projections using Spectrum

Country teams are responsible for creating and updating annual Spectrum files. The
country teams typically consist of individuals from the national programs who have a
strong capacity for epidemiology and modeling. These teams also may include in-
country development partners who work on HIV surveillance. The country teams
work in groups to update the estimates with the country’s most recent surveillance
and program data. UNAIDS and partners support country teams to explain new
features and review and validate program data and outputs.

Countries are expected to refine and share preliminary outputs with other interested
parties in the country for their review. Once the results are finalized, UNAIDS uses
these to inform the regional and global estimates of HIV. Countries are encouraged

                                                                                       3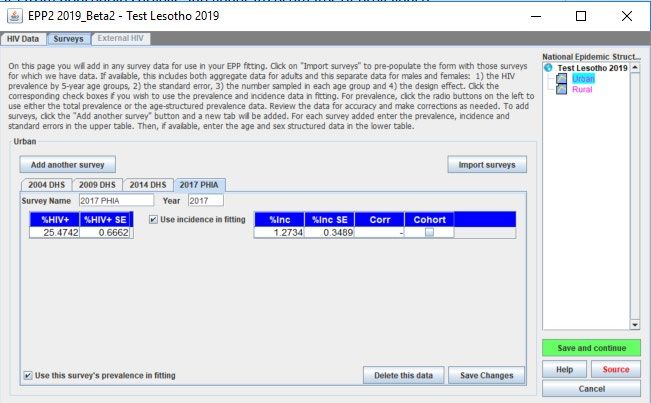
to publish estimates and projections and to communicate the results to all relevant
stakeholders.

D. What are the major changes in the 2019 software
Program statistics
   •   PMTCT: Updates to breastfeeding database to add the latest surveys, Default value
       for retention on ARV at the time of delivery for women on ART before the current
       pregnancy changed from 75% to 80% (the same value as for women starting ART
       during the current pregnancy)
   •   ANC Testing: New screen to enter and review the ANC testing cascade as a check on
       the data being used;
   •   Knowledge of status and viral suppression: New editors to input knowledge of status
       and viral suppression for the HIV testing and treatment cascade and 90-90-90
       displays
   •   EID: Removed the EID input.

Advanced Options
   •   HIV-related fertility reductions: Updates to the default values for the fertility rate
       reduction for HIV+ women and the addition of a procedure to fit the rates to HIV
       prevalence among pregnant women
   •   Pediatric transition parameters: Updates to the age distribution of new ART patients
       using the latest data from IeDEA. The effect of cotrimoxazole on mortality for HIV+
       children on ART is now limited to one year as opposed to the previous assumption of
       a diminishing effect of five years
   •   Adult transition parameters: Updated patterns of mortality on ART from IeDEA and
       ART-CC. This includes a time trend of changes in mortality rates for those on ART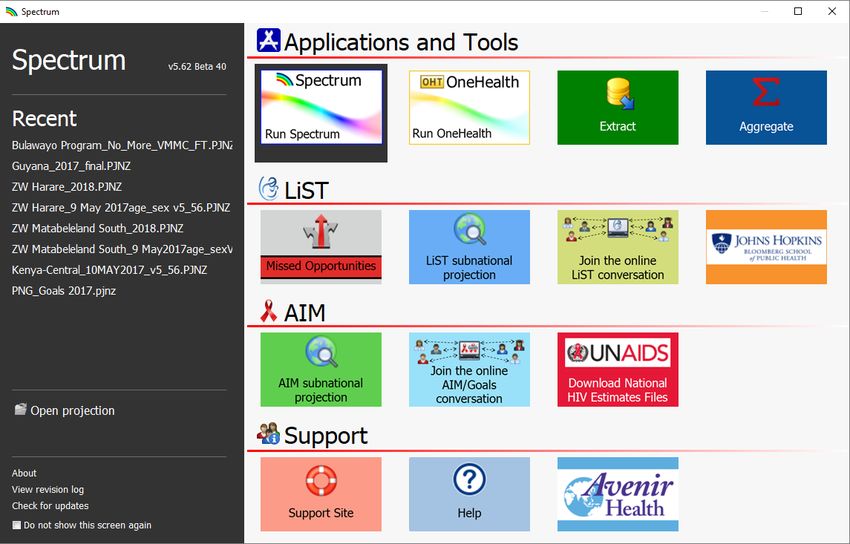
•   Prevalence in pregnant women is calculated and displayed on the Project
       Page graphs
   •   EPP’s models have been updated to include changes in mortality over time
       for those on and off ART and to support Spectrum’s new approaches to
       assigning ART to those in need
   •   The Surveys page has been redesigned and a new surveys database has been
       added to simplify the process of adding surveys to your projection

Case Surveillance and Vital Registration (CSAVR) changes
   •   The CSAVR tool now uses new HIV diagnoses and/or estimated numbers of
       AIDS-related deaths for adults ages 15 years and older only instead of all
       ages.
   •   Data on the estimated numbers of AIDS-related death annually is now the
       preferred data input for CSAVR. Estimates should be based on raw vital
       registration data corrected for incompleteness and junk codes. Data are
       publicly available at the IHME website.
   •   The option of fitting to estimates of people living with HIV has been removed.
   •   A new editor is available to capture the number of HIV positive migrants reported as
       newly diagnosed in the case surveillance system but where the probable country of
       infection is elsewhere. This will allow incidence to be fit to actual new diagnoses
       and prevalence to reflect the number of people living with HIV in the country.
   •   An option to fit HIV incidence using a ‘rlogistic’ function has been added to
       the existing simple and double logistic and spline curve fitting functions. The
       ‘rlogistic’ function uses a transmission model as in the EPP model.
   •   A new assumption about testing rates, which follows a cumulative Gamma
       distribution, is incorporated into the fitting tool. The diagnosis rate is now
       assumed to be proportional to the mortality rate in the absence of
       treatment. This relative diagnosis trend can also be user specified and the
       propensity a model output.
   •   A new method of curve fitting using Bayesian calibration has been adopted.
   •   AIC values are recorded across models in a panel that can help users to select
       the best model.
   •   Uncertainty around incidence is now estimated using a Kernel Hamiltonian
       Monte Carlo approach.

Results
ART: The HIV testing and treatment cascade and 90-90-90 displays have been added
PMTCT: New display on the sources of new child infections and the MTCT rate
Migration: For files that use the external population option there is a new display in
the Demography section that shows net migration by age and sex over time.

Tools
District estimates: A new tool to estimate indicators at district level is being added. It
requires inputs on the mapping of districts to sub-national Spectrum files and
estimates of PLHIV by district (which could come from HIVE or SAE or some other
source) and ART and PMTCT program data by district. The tool uses the distribution

                                                                                          5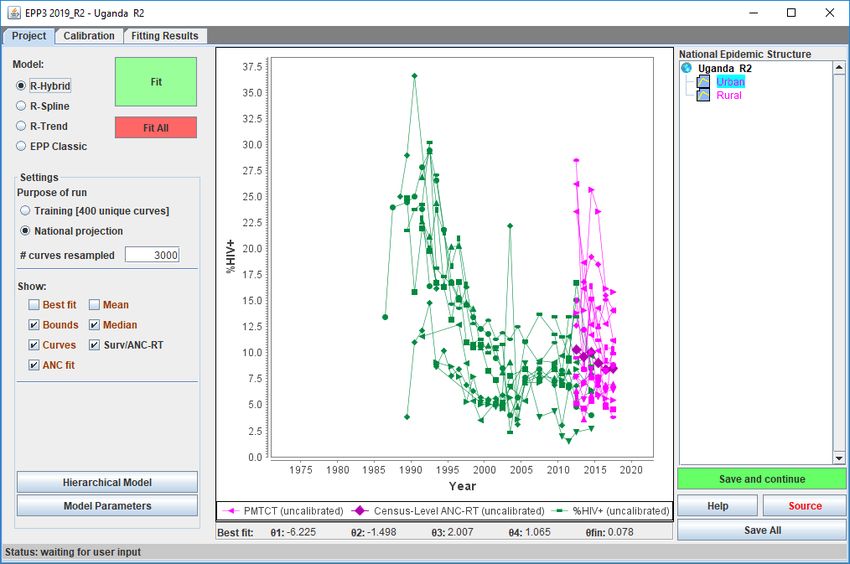
of PLHIV by district to distribute key HIV indictors by district. It will be available for
the January release.
Datapak: A new feature will write a CSV file with results from the district estimates
tool that can be imported directly into the PEPFAR datapak.

E. Preparing to develop a Spectrum file

E1. Choosing a file structure
The Spectrum software is designed to produce estimates and projections for
countries and sub-national regions with either generalized or concentrated
epidemics. The epidemic typology and the amount and type of data available will
determine how Spectrum files will be structured. The most common structures for
each epidemic type are described below:

Generalized Epidemic
Historically, in countries with generalized epidemics, prevalence is usually higher in
urban areas than in rural areas. Therefore, most countries with generalized
epidemics have adopted a model structure that uses two distinct sub-populations
(an urban population and a rural population).

Increasingly, countries with sufficient historical surveillance and program data may
choose to produce estimates at the provincial level to better capture geospatial
variations in the epidemic. In these cases, a country may either choose to create a
single file with multiple geographic subdivisions or they may opt to create separate
files for each geographic subdivision. If separate geographic files are developed, each
file must contain surveillance, program and epidemiologic data specific to the
geographic area.

Concentrated Epidemic
Countries with concentrated epidemics have historically modelled their epidemic by
producing and then combining epidemic curves for key subpopulations most at risk
(e.g., people who inject drugs, gay men and other men who have sex with men,
female sex workers) and the general male and female populations at lower risk.
More recently, countries with strong case reporting and vital registration systems
may use these data instead of serosurvey data to develop a single national set of
estimates.

                                                                                             6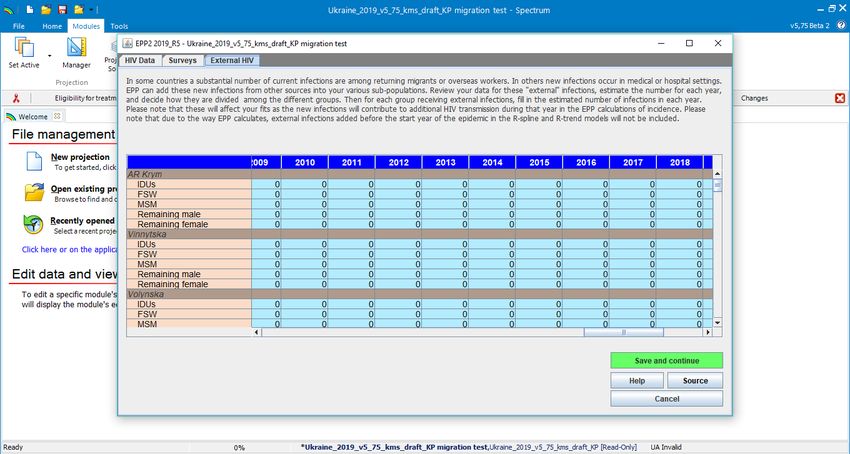
E2. Collating the required data inputs

The accuracy of the estimates and projections depend on the availability and quality
of the data used as inputs to the model. For countries that have conducted routine
surveillance on groups that are most important to the epidemic or that have robust
historical HIV case reporting or vital registration data, they will be able to inform the
model with substantial data and, in turn, produce high quality estimates and
projections. In instances where data are scarce or of poorer quality, the estimates
and projections may not fully describe the HIV epidemic in a country.

To produce a Spectrum model, countries must be able to supply historical program
data about access to antiretroviral treatment among children and adults, the latter
by sex. In addition, trends in the number of pregnant women receiving ARVs for
prophylaxis by regimen must be complete. Other demographic, epidemiological and
clinical information to determine the impact of HIV are optional. Default values for
much of the demographic and epidemiologic information are supplied within the
software and can be updated by the country with local data if available.

Other data requirements or optional data depend on the type of epidemic being
modelled. These data needs are described below.

Generalized Epidemic (high burden epidemics)
In high-burden epidemics, historical data from sentinel surveillance sites at antenatal
clinics (ANC) are required. Beginning in 2017, routine HIV testing data among
pregnant women attending all ANC sites or a subset of these sites also can be used
as an input to the model. Data from population-based surveys continue to be an
important input in calibrating prevalence and incidence levels and trends. Where
sufficient data are available, the estimates can be produced for rural and urban areas
as well as for different sub-national divisions.

Concentrated Epidemic (low level epidemics)
In low-level epidemics, the data that are required for the model depend on the type
of surveillance that countries use to monitor their epidemic. For those countries that
routinely conduct serosurveys among those populations most at risk, estimates of
the population size and prevalence data for each group over time is required. For
example, if a country identifies female sex workers and people who inject drugs as
important at-risk populations, data for those two sub-populations and for the
remaining general population, split into males and females, will be required.
Additionally, HIV outbreaks in hospitals or via medical procedures among paediatric
patients are known in a number of countries. EPP allows for numbers of such cases
to be entered in the Paediatric nosocomial infections window.

If surveillance data among key populations are sparse but case surveillance data are
relatively complete and the quality of data on AIDS-related deaths from the vital
registration system is relatively high, then incidence trends can be estimated from
these data.

                                                                                        7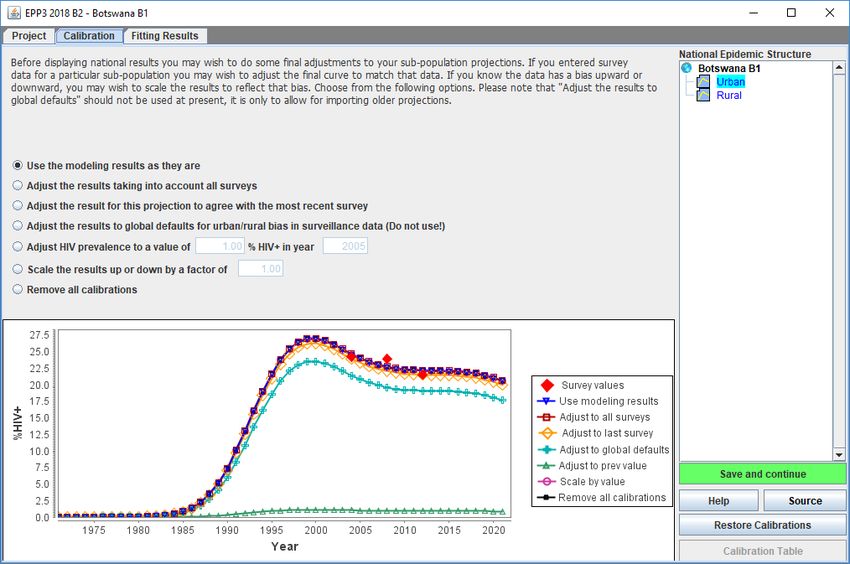
Part II. Using the Spectrum Software
This Quick Start Manual describes how to:
Update a demographic projection using data from the United Nations Population
Division.
Update an HIV estimation and projection file using surveillance and survey data
or case reporting and vital registration data.
Display results from the estimation and projection file
To create a new file as opposed to updating one, please see Annex 2.
Step 1. Install the most recent version of Spectrum
Spectrum can be downloaded from www.avenirhealth.org. Spectrum will run on any
computer running Windows Vista, 7, 8 or 10. It requires about 70MB of hard disk
space.
Once Spectrum is downloaded from the internet, double click on the file named
“SpecInstall.exe”. This will start the installation program. Follow the instructions on
the screen to complete the installation.
If you have trouble installing Spectrum you may not have permission to install
programs on your computer. In that case, contact your IT office to install Spectrum
for you.
After installing Spectrum, check your computer to make sure you have Java version 8
installed on your system. The easiest way to determine which version of Java you
have is to click on the Windows start menu, select ‘All Apps’, click on Java and select
‘About Java’. If you do not have version 8 (or do not have Java), please download or
update the software at www.java.com.
Next make sure that Windows can find Java on your computer. To do this, start
Spectrum and open your country file. Select Modules from the Spectrum menu and
click the AIM icon to display the AIM menu. Select Incidence and Configuration
(EPP). If EPP starts after a few seconds, then you are ready to use EPP. If it does not
start, then you need to tell Windows where to find Java. To do that select File and
Options. Click the box next to Use custom java.exe to add a check mark. Then click
the button Select java.exe. This will open Windows Explorer. You need to indicate
the location of the java.exe file. To find it select the C: drive, then click Program Files
(x86), then Java, then click the folder for the most recent release of Java, then click
bin, and, finally, click java.exe. This location will be saved so that Spectrum will
always be able to find Java. If you update your version of Java, you will need to
repeat this process to ensure Spectrum has the latest Java location
8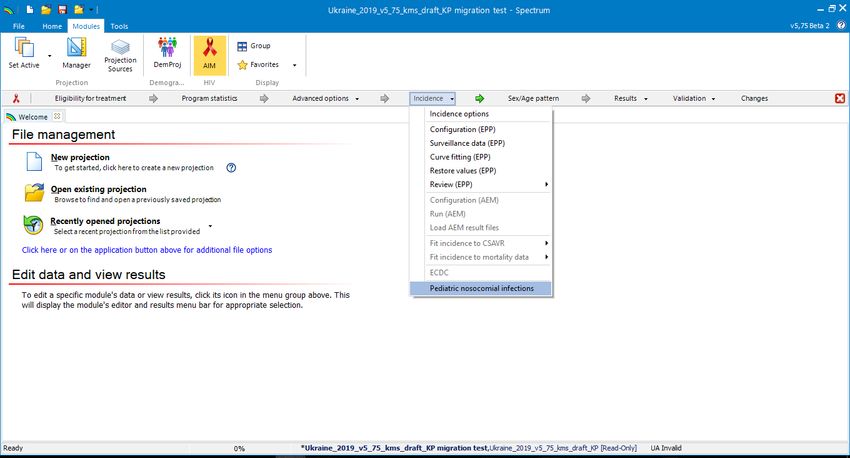
Step 2. Start Spectrum
Start the Spectrum program by selecting it from the Start menu on your computer
(Windows 7 or earlier and Windows 10) or your Start Screen (Windows 8). When the
program starts, you will see the welcome screen below.

From that screen you can run different applications including Spectrum. You can also
open an existing Spectrum file directly.

If you run Spectrum by clicking on the icon, the main Spectrum module will appear.

                                                                                     9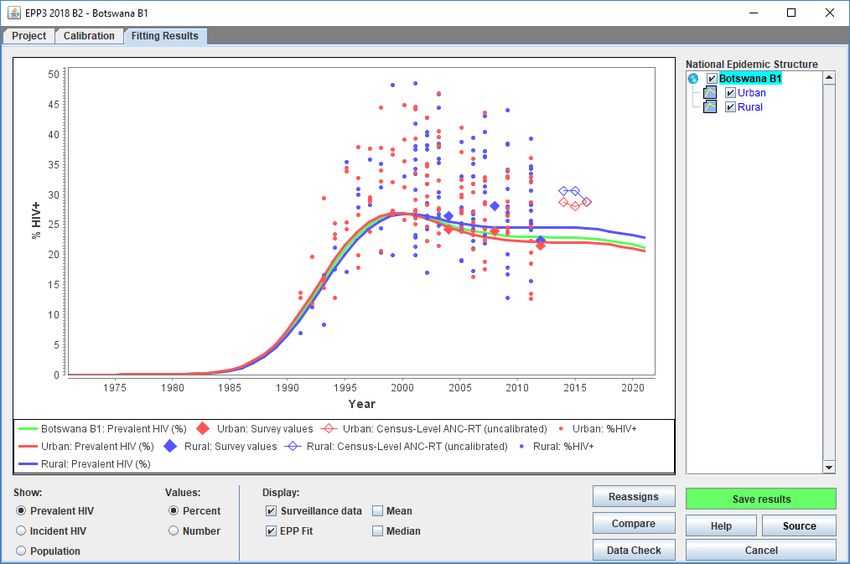
From there, you will be able to select ‘New Projection’, ‘Open existing projection’,
select a ‘Recently opened projection’ or use ‘Spectrum online support’ below the
Getting Started header.

 Choosing Spectrum’s default language
 The first time you run Spectrum after installing it, the display will be in English. You
 can change to another language by selecting the Spectrum File tab, then Options,
 then selecting the language you want to use and finally clicking on Ok. If you select
 a language other than French, you must have the proper fonts or Windows
 version to display the language correctly.

If you have a Spectrum file from previous rounds of estimates, you should start by
opening that file and following the instructions below.

                                                                                       10
Step 3. Update the population projection
When you open a projection you will select the “Manager” icon which will open the
below dialogue box.
A
B
C
11Caution: When to NOT update the demographic data in your projection
You should not update the demographic data in your projections if:
1. You have modified the default demographic data to incorporate country-
specific census data
2. You have created a sub-national projection
If demographic data are updated you will lose the custom data.
Follow the three steps below to update the demographic or HIV data in your
projection:
A. Change the final year to 2025. The first year should be 1970 — before the
start of the HIV epidemic. You can change the start and final year if you wish,
but projections submitted to UNAIDS should use these settings.
For projections using AEM (AIDS Epidemic Model), the first and final year
should be 1975 and 2050 respectively.
B. Click the Default Data button.
Select your country from the list. Also select the geographic level of the file
(country, sub-national, global region, a sample country or none of the above).
Also select the geographic level of the file (country, sub-national, global
region, a sample country or none of the above).
C. Next, click the box next to DemProj to indicate that you want the
demographic data to be updated to value from World Population Prospects
2017. Do not update the AIM data as this will over-write your program data.
When you are done click the OK button.
Finally, save your file under a new name, such as Country_2019.
12Now you can update the AIDS Impact Module within Spectrum. Select Modules from
the Spectrum menu and click the AIM icon to display the AIM menu as shown below.
To produce the projection, you advance through the menus items one-at-a-time:
Eligibility for Treatment, Program statistics, Advanced options, Incidence, Sex/age
pattern, Results, Validation, Changes. The following sections explain each of these
items in detail.
Step 4. Specify eligibility for treatment
Select the Eligibility for treatment menu item to see the editor shown below.
The first tab in this editor describes eligibility for treatment for adults (aged 15
years and older.)
13In the first table, you should specify the eligibility for ART in terms of CD4 count. By
default, eligibility is set to 200 cells/µl until 2009 and to 350 cells/µl for 2010, 500 for
2013 to 2015 and 999 (which corresponds to the 2015 recommendation to “treat all”
people living HIV) from 2016. You should modify these inputs to match your
country’s guidelines.
The second table editor allows you to specify which population groups living with
HIV are eligible for treatment regardless of CD4 count. To specify those populations,
click the check box next to the name and enter the year in which the guidelines were
changed to include that population group. As a final entry for the population, you
should specify the estimated percent of PLHIV in this group as a proportion of all
adult PLHIV. Spectrum supplies default estimates for most countries and will
calculate this estimate for pregnant women directly from the model.
To modify eligibility for treatment for children, click on the Children tab at the top
of the editor.
For children, eligibility has three different criteria:
• By age. Enter the age below which all HIV+ children are eligible or are started
on treatment. By default this is set to 12 months from 2007 to 2009 and to 24
months from 2010 to 2012, 60 months from 2013 to 2015 and 180 months
(to age 15) thereafter. For the Treat All scenario, set the first row to 180
months (15 years).
• CD4 count. The CD4 count for eligibility can be defined by four age groups
and by year. The default values follow WHO guidelines for the corresponding
years.
14• CD4 percent. Eligibility may also be defined in terms of CD4 percent by age.
The default values follow WHO guidelines.
Children are considered eligible for treatment if they meet any one of the three
criteria.
Step 5. Enter program statistics
Click on the Program statistics menu item to see the program data editor. It will look
like this:
In this editor, you will enter or revise PMTCT, ANC and testing, treatment program
and viral suppression data for adults and children using the tabs at the top.
15In the PMTCT, child treatment and Adult ART tabs you may enter data as the number
of people receiving the service or as coverage, the percentage of those in need of
the service who receive it. Normally you will enter or update program statistics for
all historical years (i.e., through 2017) using numbers. For future years (e.g., 2018
through 2022) you may enter either target numbers or percent coverage. Note that
you can enter numbers for some years and coverage for other years but you cannot
have a number and a percent in the same year.
Important: The numbers of people who know their HIV status and who are virally
suppressed are not inputs into the model (i.e., they do not affect the model outputs)
so it is not necessary to enter data for years where none are available or to enter
projected estimates after 2018.
Simplifying data entry in Spectrum
All Spectrum editors have duplicate and interpolate functions to make it easier to
enter all the data required. To use these features just select a range of data with
your mouse and either click the Duplicate or Interpolate buttons or right click with
the mouse and select Duplicate or Interpolate from the menu.
• Duplicate copies the data from the first cell of the range to all the other
cells in the range. It is useful when you want values to remain constant
over time.
• Interpolate calculates intermediary values for the range between the first
and last cell selected. Spectrum will perform a linear interpolation if you
click the Interpolate button. It you right click you will see a menu allowing
you to choose the interpolation method: linear, S-shaped, exponential, and
front loaded.
It is important to note that the grey numbers displaying the estimated number in
need of PMTCT and ART services are based on the last time the projection was run.
Substantial changes to the inputs (surveillance data, eligibility criteria or program
data) will result in a change in these values. You should consider the needs in grey as
indicative values and review them after the whole file has been updated.
Once you have entered the PMTCT and ART program data, you can use the “plot”
feature in Spectrum to visualize these data over time. To access this feature, click on
the Plot Values button on any of the PMTCT, Adult ART and Child Treatment tabs.
For Adult ART and Children treatment plot, a check button in the upper left corner
allows you to plot needs against eligibility.
ANC testing: A new feature added to the program data page in 2019 is the ability to
review the data you have compiled around pregnant women found to be HIV
positive during their routine antenatal care visits. Reviewing those data is critical for
the prevalence curve fitting as well as for estimating the number of births to women
16living with HIV and subsequently new infections among children and children living
with HIV. To complete this tab you need to compile routine testing data from all of
the ANC sites in your country. Enter the data in the tab, use the graphs to look for
discrepancies and use the “Check table values” button to verify that the data meet
logical expectations of the ANC testing cascade.
The purpose of this table is to let users check their ANC data inputs using clinic-
based data and calculate an estimate of prevalence based on the direct ANC visit and
testing data provided. This will be useful for identifying incorrect inputs, diagnosing
regions where testing or reporting coverage is low, or looking for unexpected trends
or patterns that indicate data quality issues.
Rows 2 through 4 require the user to enter data:
• # first ANC visits: the total number of women who have visited ANC clinics at
least once in the area currently being modeled in EPP for the current
pregnancy. Do NOT include repeat visits in this count.
• # receiving at least one HIV test: the total number of women who were
tested at least once during their ANC visits before labor and delivery. This
includes both those testing positive and those testing negative.
• # testing positive at their first HIV test: the number who tested positive at
their first HIV test during this pregnancy. This should not include women who
received multiple tests and were positive only at the second or third test.
• # known to be HIV+ at first ANC visit (including on ART): This is the number
of women who were already known to be positive before the ANC visit and,
as a consequence, are recorded as positive, but did not receive an HIV test.
This should include women who are already on ART.
• % HIV+ (census level ANC-RT): This should be calculated across regions to
calculate a national value. The data should be weighted by the number of
births to women living with HIV in each region.
Progress towards 90-90-90, Knowledge of Status and Viral suppression: In 2019,
progress towards the first and third 90s will be compiled in Spectrum alongside the
numbers of adults and children on treatment. As previously noted, the numbers of
people who know their HIV status and who are virally suppressed are not model
inputs (i.e., they do not affect the model outputs) so it is not necessary to complete
data for years where high-quality data are not available or to enter projected
estimates after 2018.
Knowledge of Status
On the Knowledge of Status tab, first select the source of the data to be entered. You
will see several options for the source of these data:
17For countries using case surveillance data, click on the radio button that says case
reports and then enter in the number of children and adults, by sex, living with HIV
who have been diagnosed (and were known to still be alive at the end of the year)
for 2018. Please also enter and review historical data for the years going back to
2010 where these are available. You may wish to review GAM entries for 2015-2017
(Indicator 1.1) to see what numbers were previously reported. Numbers reported
through Spectrum will replace historical estimates previously submitted in GAM, so
they should be reviewed carefully for their accuracy.
For countries with population-based HIV surveys with or without serology testing,
estimation of trends for the first 90 should be made using the Shiny 90 App. This app
is accessed at: https://shiny.dide.imperial.ac.uk/shiny90/. Follow the instructions in
the App to produce a file containing the estimates of the first 90 since 2010 for
adults by sex. To import the data, click on the Shiny 90 radio button then click on
Load Data. Estimates of the first 90 for adults by sex will appear in the table. Enter
estimates of the number of children who know their status where these are
available. If estimates for children are not available for these years, you should
conservatively enter the number of children on treatment at each year end. If you do
not enter estimates of knowledge of status for children, it will not be possible to
estimate the first 90 for all ages.
For countries with other model-based estimates (e.g., CSAVR, ECDC, other direct
input), the source of the estimates should be selected in the radio button and then
the number of people who know their HIV status by age and sex should be entered.
Similar to the approach for estimating the first 90 using population-based survey
data, if estimates for children are not available, you should conservatively enter the
number of children on treatment for the year. If you do not enter estimates of
knowledge of status for children, it will not be possible to estimate the first 90 for all
ages.
Viral load suppression
On the viral load suppression tab, please select the radio button describing the data
source.
For countries using laboratory, programme or case surveillance data, the number of
people reported annually to have received a viral load test should be entered first. At
the bottom of the table, a percentage will be calculated showing testing coverage
among people on treatment.
18Where testing coverage is >90%, viral suppression data should be entered as equal
to the number suppressed among those tested.
If testing coverage is between 50 and 90%, viral load suppression is calculated as the
proportion suppressed among those tested multiplied by the number of people on
treatment.
If testing coverage is below 50%, data on the numbers of people virally suppressed
should not be entered unless access to testing is found to be unbiased with regard to
geographic location or facility level.
If sex and age disaggregated data are not available, it is possible to assume some
distribution in order to obtain the known overall total. Assumptions used to inform
the age and sex disaggregated data should be included in the source notes. The age
and sex disaggregated estimates should not be approved in the final country sign-off
for the 2019 round of estimates.
Note that when testing coverage is below 90%, the number of people reported to be
suppressed could be greater than the number of people tested because it is assumed
that suppression levels are the same among the untested and tested populations. If
there is evidence that this is not true, please discuss this with the Estimates team at
UNAIDS.
For countries using survey data to report, please remember to extrapolate the
results to the total number of people living with HIV in the country. Also, enter in the
numbers of people with an annual viral load test, even if the results from these tests
are not used to estimate suppression.
Additional tips on entering PMTCT data
To simplify entering ARV Regimen data into the PMTCT table, which has many rows,
you can use the drop-down menu in the upper right of the screen to display (1) just
the rows for numbers or (2) just the rows for percents. You can also select the third
option to display both the numbers and percents.
Just below the rows for the prophylaxis regimens are rows labelled ‘Percent already
on ART retained at delivery’ and ‘Percent starting ART retained at delivery’. These
rows specify the percentage of women who were already on ART at the time they
became pregnant or started ART during the current pregnancy who are still on ART
at the time of delivery. The new default rates, based on a literature review, are 80
percent retained at delivery for those already on ART at the time they became
pregnant and 80 percent for those starting ART during the current pregnancy.
Note that below the table where you enter your PMTCT program data, there are two
additional PMTCT-related data inputs. Countries with data on breastfeeding status
can enter this information by clicking on the Breastfeeding tab. Make sure to review
data for all years and not just for the current year. You can select the Reae Survey
Data button to upload the most recent survey data on breastfeeding in the general
19population. The Abortion button provides countries with the option of entering data
on the percent of HIV-positive pregnant women terminating pregnancies, if this is
known.
Additional tips on entering adult ART data
Most countries should use the default option to enter the number or percent of
people accessing ART. Additional data can be entered where available on the median
CD4 count at ART initiation, the percent of people lost to follow up each year (e.g.,
those who drop out as opposed to die on ART or transfer to another facility) and any
data on the percent who are virally suppressed.
Countries with more detailed information about the CD4 count profile of people
accessing ART may choose to enter ART data as either a percent coverage or a
number.
If a country only has data on the number of people newly initiating ART in the year,
these data can be provided. If additional information on the median CD4 count at
ART initiation or the percent lost to follow up who have dropped out during the year
is available, these should also be included.
Additional tips on entering pediatric ART data
The child ART enter provides two options for entering the number of children on
ART: (1) ART for all children and (2) ART by 5-year age group. Option 1 works as in
previous versions. You enter the total number of children aged 0-14 on ART. The
second option allows you to enter the number of children on ART by five-year age
group. If you have this information, you should use it here to inform the allocation of
ART by age. The choice of entering for all children or by 5-year age group can vary by
year.
When you are finished entering the PMTCT, ANC testing, child treatment data, and
testing and treatment cascade data click the Ok button.
For CSAVR countries: Net migration of PLHIV
Like many other populations, PLHIV acquire infections in one country and then
migrate across borders. Where information is available on new case surveillance
notification forms indicating that the country of acquisition of HIV infection was
outside of the country of current residence, these data can be entered by sex and
age group by year. This allows for people living who acquired HIV infection outside of
the country to be excluded from estimates of incidence inside the country, but
included for the purposes of estimating total PLHIV
20Step 6. Restore default values in Advanced options
The Advanced options menu item allows you to see the default adult and child
parameter values used in the projection. These parameter values are informed by
special studies and surveys from many sites around the world. In most cases the
default values should be used. You should only change them if you have conclusive
evidence for alternative values. The parameter groupings are as follows:
• Pediatric transition parameters: These tabs include assumptions around
progression rates to lower CD4 levels, the distribution of new infections by
CD4 percent, HIV-related mortality for children with and without ART and the
probability of initiating ART by age. Assumptions about the effectiveness of
cotrimoxazole on reducing mortality over time are also included.
• Adult transition parameters. These include the amount of time an average
adult spends in each CD4 category, the distribution of new infections by CD4
category, HIV-related mortality by CD4 category without ART, HIV-related
mortality on ART by CD4 count at the initiation of treatment, including the
option of a scaling factor to adjust annual mortality rates relative to 2012,
and the effects of HIV infection on fertility. Different parameters exist by
region for HIV-related mortality. By selecting the tab for HIV-related mortality
you can select the country’s region to improve the mortality estimates. The
total fertility rate adjustment is also included in this tab. This describes the
assumed difference in fertility among HIV+ women not on ART and HIV-
women.
HIV-related fertility reductions. The HIV-related fertility tab contains the
parameters for estimating births to women living with HIV. Reductions in
fertility by age and CD4 count that allow the model to best fit HIV prevalence
among pregnant women are displayed. Select Calculate 15-19 year olds to
estimate the fertility adjustment for the first age group based on the most
recent surveys. Further adjustment based on local data by selecting Fit Local
Adjustment Factor. If available Read the ANC-RT census data from EPP. This
will copy the aggregated prevalence from pregnant woman. Click on ‘Fit
Fertility Rates’ to fit to those routine data. If the Read ANC-RT data button is
not active, that means that no data are available on HIV prevalence among
pregnant women. If new routine ANC data are being entered into EPP this
step should be repeated after those data have been entered.
• MTCT transmission probabilities: these are the assumptions around the
transmission from mother to children based on the mother’s CD4 level and
different ARV regimens. These probabilities are taken from the literature and
should only be changed in countries with strong evidence for alternative
values. If the values in this table are red, it implies that the values do not
match the current default values.
21• DALYs and Orphans: these pages provide the assumptions around the
calculation of disability adjusted life years and orphans.
• Allocation method for new ART patients: this allows you to change how ART
is allocated to new patients by CD4 category. In Spectrum, ART is allocated to
the eligible population according to their CD4 count and the expected
mortality of those who have not yet started ART. By default, these are
weighed equally. You can test the effects of different allocations on mortality
by changing one of these weights. The other will automatically update so that
both sum to one. You can also choose to assign ART proportion to the
mortality rate, to the number eligible or to those with the lowest CD4 counts
first.
How can I update to the default values for some parameters without losing my
custom values for others?
Custom values are identifiable by their red font (although the red font may also
indicate an out-of-date value). To update all parameters but not lose those that
are customized, the custom values should be saved in a separate excel file first.
Following that, you can press the restore default value and then re-enter the
customized parameters.
Step 7. Deriving Incidence
When you select Incidence option from the incidence menu you will see a drop-
down menu with six different fitting methodology options. The method that was
used in the previous year will be selected by default.
You should review the decision tree below and the quality and quantity of
surveillance data available for your country to make sure you are choosing the best
model for deriving incidence in Spectrum.
22Figure 1: Decision tree on use of estimates tools
For countries that are producing subnational estimates, a decision on which tool to
use should be made for each geographical area.
If you are directly entering annual incidence obtained from another tool, then select
the ‘Direct incidence input’ options and then simply enter the incidence estimates
and click Ok.
For countries that are using EPP, ensure EPP is selected in the drop-down menu,
then choose the age group that best reflects your surveillance data. For most
countries with ANC surveillance or population survey data, this should be adults’
ages 15-49 years. Also, for most countries, the box for EPP prevalence adjustment
should be checked, which allows AIM to adjust for small differences in the
prevalence trend fitted by EPP as compared to the trend fitted by AIM. The
maximum adjustment factor of 10 will allow the resulting prevalence trend to closely
match the prevalence curve from EPP. A lower value of the maximum adjustment
factor will produce a smoother incidence curve but the prevalence trend may differ
from the curve fit in EPP.
23The other options are:
• AEM. This option allows you to use AEM to determine the incidence trend.
Generally, it is used by only a few countries that already have AEM applications.
• CSAVR (Case surveillance and vital registration) fitting tool. This option estimates
incidence by fitting to program estimates of the AIDS deaths, new HIV case reports
and mean CD4 count. This option may be best for countries without good
surveillance data but with good case surveillance on case reports and AIDS deaths
from vital registration systems.
• ECDC model – This option uses the number of new HIV infections estimated from
the ECDC HIV model to calculate incidence. For more information on the ECDC
model, please access: https://ecdc.europa.eu/en/publications-data/hiv-modelling-
tool.
Note: For countries using ECDC model results, to pull in the incidence data, you
should click the ‘Read from database’ button, then select the ECDC output file. This
will have a name such as COUNTRY_Result_main.csv. This file is produced
automatically when you complete a run of the ECDC model. Once you select the file
the number of new infections will be read into Spectrum and displayed in the editor.
Incidence will be calculated and displayed in the second row. You can edit these
numbers if necessary, but normally they would remain as they are read from the file.
Then click the Ok button. The incidence from the ECDC model will then be used in
the Spectrum projections.
Once you have made your selections, click OK and then click on Incidence in the
menu to see the access to the various fitting steps.
For EPP these are Configuration, Surveillance, Curve fitting, Restore values, and
Review required to derive an incidence curve in EPP. Each of these items is discussed
in more detail in steps 9 through 11. For the CSAVR fitting tool, the menu option Fit
Incidence to CSAVR data should be visible. If you are using CSAVR, you should skip to
step 12. If you are using EPP, you should complete steps 9 to 11 and skip step 12
24I’ve selected one of the menu items in EPP – why can’t I see the program?
If you do not have the Java Runtime installed on your system, the first time you go
to run an incidence calculation, you will see the following prompt within Spectrum
to download and install Java before proceeding:
Click on “Download JAVA” and you will be taken to the Java site, where you can
click on “Free Java Download” followed by “Agree and Start Free Download” to
begin the install. When asked if you want to “run or save this file?”, click on “Run”
and follow the prompts to install the software.
As an alternative, you can visit the site java.com and install the Java software
directly from there prior to running Spectrum. To install Java, you must have
administrative rights to your computer. If you cannot successfully add this
program, please contact your IT department.
If you do not see this error message but EPP still does not run, it may be because
you have two versions of Java on your computer, for example Java 7 and Java 8.
EPP will not run if both versions are present. The two options to fix this issue are
the following:
(i) in Spectrum, go to file -> options, check the “Use custom java.exe file” box and
then click on “Select java.exe”. Browse to your Java 8 executable that can be
found in your C:\Program Files (x86)\jreYYY\bin where YYY is the Java version
number. Please note that in Spectrum 2019, you must be using Java 8 or EPP will
not run.
(ii). You should go to Control Panel, and use Uninstall Programs to uninstall the
older version of Java unless your institution has installed software requiring an
older version of Java.
25Step 8. EPP Incidence: Configuration
If EPP is your incidence fitting methodology the following steps should be taken to
update your file. The first step is to review the epidemic structure. Normally, if you
are updating an existing Spectrum file, you will not need to change the epidemic
structure or the sub-population characteristics. If you do change it, be sure you have
both population size data and epidemiological data for any sub-populations you add.
To change the epidemic structure.
8.1 Right click on the top entry under National epidemic structure. Select the
appropriate template. There are two template options: Concentrated (C) and
Urban/rural (G). For most countries with generalized epidemics use the
Urban/Rural template. For most other countries, use the Concentrated
template. See additional information on this topic in Annex 1.
Tip: In countries with well-documented epidemics in which HIV in the general
population has increased beyond 1% (such as, Russia, Ukraine, Myanmar, Thailand)
but a significant portion of new infections are also occurring in key population
groups, the concentrated epidemic template should continue to be used.
8.1
Alternatively, create a custom template by left clicking on the top entry and then add
or delete sub-epidemics or sub-populations using the buttons to the left, as shown
below. For each sub-population, be sure to select any special characteristics it may
have. To rename an item, right click it in the epidemic structure tree and choose
"Rename".
26Review the sub-population characteristics
8.2 Highlight the sub-population in the epidemic structure.
8.3 Click on the characteristic of that sub-population (for examples sex workers
should be “FSW” and the “General pop women” should be “low risk”).
8.4 Repeat this for each sub-population
8.5 Click on “Save and continue”
8.2
8.3
8.5
Generalized epidemics:
For many countries with generalized epidemics, one urban and one rural sub-
population are sufficient to describe the epidemic. Alternatively, you could create
sub-epidemics by region if there are significant differences in regions of the
country.
27Producing estimates for sub-national regions other than rural and urban
In some setting it might be necessary to create estimates based on sub-national regions to
provide more specific estimates. A number of options are available to help countries create
sub-national estimates. Two options are described here.
Option 1. Create a national Spectrum file using sub-regions (instead of urban/rural) to fit
curves and display a regional summary table within Spectrum
Option 2. Create separate regional Spectrum files
Option 1
Create an epidemic structure in the configuration page using regions. Assign the sites to
each region and produce sub-epidemic curves for each region. Produce national curve in
Spectrum. Use Spectrum’s Regional Table output to see regional estimates. Use this option
when many surveillance sites are available in each region. This option captures the different
epidemics for each region. However, the indicators are only allocated based on prevalence
or incidence.
Option 2
Create one separate Spectrum file and curve fit for each region. Use the Spectrum
Aggregate tool to produce a national estimate. Use this option when there are many
surveillance sites in each region and you have full epidemic information for each region
(program data, size estimates, non-AIDS population data). This option produces full
epidemic information (all variables) for each region. However, it requires that all the
demographic projection information is available by region. More information on this option
is available from your UNAIDS strategic information advisor.
Option 3
A new tool has been added to Spectrum that allows you to disaggregate the estimates
created through Spectrum to lower national levels. More information will be provided in the
January release of the software.
Concentrated epidemics:
For concentrated epidemics each sub-population created will require the following
data: HIV prevalence data, estimates of the number of persons in the sub-
population, average time spent with the risk behavior for those sub-populations of
persons with high risk behavior. Do not create sub-populations for which no data
are available.
Define the populations
The Define Pops page allows you to define the size of each sub-population.
Generalized epidemic (urban/rural template):
In a generalized epidemic, when using the urban/rural structure, you define the
number of the adult population in urban and rural areas by specifying the
percentage of the population living in urban areas. If using the urban/rural structure,
this is all you need to enter. The software already contains the United Nations
Population Division values for each country and these are displayed when you first
open this page. In Spectrum 2018 these have been updated to the latest United
Nations Population Division urbanization projections available, which you can change
28to by clicking on “Adjust to UN values” in the lower left-hand corner of the interface.
If you wish to change the urban percentages, you can by filling in the cells marked in
blue. When done, click on “Save and continue” to store your results.
Generalized epidemic (user defined regions):
If, instead, you have created your national epidemic using a set of regional sub-
populations, you will need to provide the population for each of those regions. The
table will appear as shown below. At the bottom of the table is the total number of
people aged 15-49 years in the population (based on the UN Population Division
Non-AIDS estimates). You must assign all this population to different groups within
the epidemic structure.
298.6 For each region, enter the population for each year from 1970 to the end of
the projection. Make sure the numbers for each year sum to the national
total populations and that “Population still to assign” is zero for each column.
Tip: When you return to an existing Spectrum file and update the file with new
demographic data, including overall population size, the population still to assign will
no longer equal 0. To automatically adjust the population to the updated population
figure select Adjust for changed pop and EPP will apply the same annual regional
distribution to the new population.
8.7 When done entering all population data, click on “Save and continue”
If you do not have populations for each year, but do know the percentages of the
total population in each region in the starting and ending year, it is possible to have
the software fill in the table for you. To do this:
8.8 Change to percentages by selecting “Percent” next to the word “Display:” at
the bottom left-hand side of the page.
8.9 Fill in the percentages of the population in each region for the first year,
1970, in the table. Make sure that the percentages sum to 100% so that
“Population still to assign” is zero.
8.10 Fill in the percentages for the final year in the final column in the table. These
need not be the same percentages, as the software will assume they grow or
decrease according to the values you enter. Again, make sure that the
percentages sum to 100% so that “Population still to assign” is zero.
8.11 Click on the button “Calculate Proportional Values” and the software will fill
in the additional entries for the entire table.
8.12 Hit “Save and continue” to store your results and return to the AIM interface.
30You can also use “Calculate Proportional Values” for the actual populations (instead
of the percentages) if you have the total population in each region for the first year
and final year. The procedure is the same: fill in the table for the first and last years,
making sure that “Population still to assign” is zero for both years. Then click on
“Calculate Proportional Values”.
Concentrated epidemics:
For concentrated epidemics this page requires more detailed information supplied in
two additional tabs. On the first tab the user should provide the estimates of the
number of persons in each sub-population. Alternatively, the percent of the adult
population in each sub-population can be provided. These values can be changed
over time if data permit. This is done exactly as previously described for generalized
epidemics using user-defined regions.
8.6 Enter the estimated population size or the proportion of the adult (15-49)
population in each sub-population by year (see previous section for a description of
the procedure)
31Key population size estimates at increased risk to HIV (in low or concentrated epidemics)
The estimates of the size of key populations should be based on studies from the country.
(Guidelines on how to estimate the sizes of most at risk populations are available at the
UNAIDS website.) For clients of sex workers, consider using higher size estimates than those
available from Demographic and Health Surveys or other population-based surveys. The
West African Modes of Transmission project suggests that estimates of client of sex workers
are higher than the estimates from these surveys, when calculated based on estimates of
number of sex workers combined with data on number of clients reported by sex workers.
Consider applying the percent of the population with increased risk to HIV (for example
MSM or PWID) to only the urban population if these behaviours are relatively rare in the
rural populations. Similarly, consider using a smaller percent when applying percent of rural
population that are sex workers and clients of sex workers.
Some estimates of population sizes by region
Table 1: Population Proportions of Key Populations in UNAIDS regions
Data are based on a literature review conducted by UNAIDS, GFATM, and WHO with
assistance from other agencies. Other findings from the review were published in PLoS One
(2016; 11(5): e0155150.) Data reflect population size estimates conducted between 2010
and 2015 in low and middle-income countries. The data are consistent with findings from
similar exercises published in 2006 in Sexually Transmitted Infections (2006 Jun; 82(Suppl
3).)
32Table 1: Population Proportions of Key Populations in UNAIDS regions
Proportion of adult UNAIDS regions
population (15-49) that
is a member of each East and East Europe North West and Total
Asia and Latin
group, by appropriate Caribbean Southern and Central Africa and Central
Pacific America
gender Africa Asia Middle East Africa
#
12 2 7 9 5 3 11 47
countri es
Medi a n 0.35 0.58 0.68 0.49 1.18 1.19 0.67
Female sex
workers ra nge 0.18-2.33 2.40-2.50 0.25-3.00 0.42-1.25 0.12-1.91 0.94-2.78 0.57-3.00 0.12-3.00
25-75
percenti l e 0.26-0.67 0.41-1.66 0.46-0.97 0.16-1.52 0.84-1.88 0.39-1.23
s
#
14 4 9 11 9 3 12 62
countri es
Men who Medi a n 1.69 2.71 1.28 1.39 1.49 0.9 0.72 1.22
have sex Ra nge 0.09-4.06 0.40-5.00 0.16-3.20 0.18-4.00 0.59-5.47 0.61-2.28 0.05-2.00 0.05-5.47
with men
25-75
percenti l e 0.26-3.0 0.25-1.85 0.62-2.04 0.99-3.30 0.34-1.38 0.50-2.00
s
#
10 7 8 1 3 30
countri es
Medi a n 0.06 0.6 2.18 0.06 0.1 0.11
People who
inject drugs ra nge 0.001-1.04 0.004-2.72 0.47-3.30 0.05-1.60 0.001-3.30
25-75
percenti l e 0.03-0.16 0.03-1.58 1.11-2.97 0.05-1.41
s
#
3 1 1 5 10
countri es
Medi a n 0.02 0.38 0.31 0.12 0.11
Transgende
r people ra nge 0.02-0.06 0.03-0.42 0.02-0.42
25-75
percenti l e 0.06-0.18 0.04-0.25
s
For concentrated epidemics, additional information is required on the proportion of
the sub-population that is male and the average duration an individual stays in the
sub-population. These are used to calculate female/male ratios and to calculate the
rate of turnover in the sub-population. This is provided on the second tab of the
define populations page titled “% Male and Turnover” if you are using a
concentrated epidemic template.
8.7 Indicate whether people are likely to move in and out of this sub-population. If
you have evidence that there is a turnover in these groups (i.e. that sex
workers move in and out of the sex work occupation) you should select the
“on” button. Populations that are static such as the remaining populations will
have no turnover.
8.8 Enter the estimated time (in years) that a person spends in that sub-
population. This is used to determine the rate at which new members enter
and old members leave the population. For example, if it is set to 5 years, then
1/5 of the population must change every year, i.e., 20% of older members are
replaced by newer ones. Sex workers in most countries are known to have a
short average duration (few years).
8.9 If turnover has been selected you will need to specify where the population will
go after “turnover”, or after they have left the most at-risk population. Under
33You can also read