QUO VADIS Exploring the future of shipping in the Baltic Sea - July 2018 - VASAB
←
→
Page content transcription
If your browser does not render page correctly, please read the page content below
QUO VADIS
Exploring the future of shipping
 in the Baltic Sea
 July 2018
QUO VADIS
 Exploring the future of shipping
 in the Baltic Sea
 July 2018

Main author:
Magdalena Matczak, Maritime Institute in Gdansk (PL)

Contributions by:
Nele Kristin Meyer, Federal Maritime and Hydrographic Agency (DE)
Erik Ooms, Sustainable Projects GmbH (DE)
Lise Schroder, Aalborg University (DK)
Margarita Vološina, Ministry of Environmental Protection and Regional Development (LV)
Harald Warmelink, NHTV University of Applied Sciences (NL)
Jacek Zaucha, Maritime Institute in Gdansk (PL)
Ernest Czermański, Institute of Maritime Transport and Seaborne Trade Department of Seaborne Trade (PL)
Clara Coornaert, Sustainable Projects GmbH (DE)
Annika Koch, Federal Maritime and Hydrographic Agency (DE)
3

Table of Contents
1. Introduction .............................................................................................................................................. 4

2. Methods .................................................................................................................................................... 9

 2.1. Scientific economics: Future trends analysis and scenario building.................................................. 9

 2.2. Asking stakeholders: Interviews and surveys .................................................................................. 11

 2.3 Engaging stakeholders: an MSP Challenge workshop ...................................................................... 12

3. Future trends and perspectives .............................................................................................................. 15

 3.1. Main development factors ............................................................................................................. 15

 3.2 Sectors competing for space– offshore wind energy in short .......................................................... 38

 3.3 Baltic shipping scenarios ................................................................................................................... 40

4. From scenarios towards solutions – MSP Challenge (stakeholders view) ............................................. 47

 4.1 South-West Baltic ............................................................................................................................. 47

 4.2 Central Baltic ..................................................................................................................................... 49

 4.2 North-East Baltic ............................................................................................................................... 50

5. Challenges for MSP and recommendations........................................................................................ 53

6. References .............................................................................................................................................. 68
4

1. Introduction
Shipping scenarios for the Baltic Sea
Shipping is one of the main users of the Baltic Sea. There are about 400 sea ports in the region of
which 90 are of international importance. Between these ports commercial and passenger traffic
is sailing throughout the year. The shipping sector has its own dynamic which is changing over
time in its own tempo. This dynamic is largely influenced by the demand for transport, which has
a close relationship with the economic growth in the region. But the dynamic also depends on
the changing type of products (containers, oil/gas), or even the characteristics and economic
lifetime of the ships themselves. Besides this, also other aspects, such as vessel designs, certain
port extensions and environmental friendly propulsion systems (e.g. gas instead of oil) can
influence the amount and type of traffic between ports and thereby increases or decreases traffic
on a certain route.

Shipping determines BSR development and international trade and therefore is one of the most
economically important sectors using the Baltic Sea, but it is not the only one. Another
‘traditional’ sector is fisheries, which is a very dynamic sector changing the location of its
activities continuously. Also, in recent years, more space is demanded for developing official
nature protected areas and generating electricity using Offshore Wind Farms. And these other
uses cannot always coexist with shipping routes. The consequences are that the pressures on the
Baltic Sea is growing and the more traditional ‘shipping’ sector might get influenced by other
uses.

Maritime Spatial Planners need to integrated the spatial demands of the shipping sector in their
plans. They can do this by designating specific space in their spatial plans for shipping purposes.
This can be non-shipping zones, shipping zones, anchoring zones and more. Most important is
that the spatial plan is not only taking into account the current shipping routes but will also look
how to include the interest of the shipping sector in the future. This means that planners need
to understand how much space potentially is necessary on which location in for example 2030 or
2050. While this is hard to determine easily, planners use forward looking tools to make
estimations about this. For example, planners can develop a scenario which trends might happen
where in the future. By this, they can integrate the potential outcomes (a future space in the sea)
already in their plan.

While these future shipping scenarios are important for all Baltic Sea countries, the transnational
Baltic LINes project has been working on spatial shipping scenarios. This report deals with the
scenarios building activities done under the project. The goal of this report is to discuss the results
of the shipping scenario activities along different themes and thereby provide suggestions for
other activities in the project, for example the development of recommendations for MSP.
5

Working towards stakeholder supported spatial scenario’s
The scenario developing work of the project consisted of three parts (for a graphical impression
please see figure below):

 1. Firstly, a scientific sector-oriented study has been done. This study used quantitative data
 of the existing situation and used extrapolations to predict future trends. Extrapolations
 have been done by using several variables, based on the different visions: Low economic
 growth, sustainable economic growth and high economic growth.
 2. Secondly, interviews and a questionnaire have been held with a small group of shipping
 experts. This questionnaire provided a more detailed overview of the sector specific
 future trends, and also included some spatial issues.
 3. The third activity has been a stakeholders’ involvement via the interactive game MSP
 Challenge 2050. This game provided more understanding on the spatial implications of
 the future shipping trends.

 1 2
 Scientific Scenario report Questionnaire /interviews

 • Economic / Sector • Economic and spatial
 oriented oriented

 • Based on quantitive data • Trends and stakeholder
 and extrapolations input

 3
 MSP Challenge Game

 • Mostly spatially oriented

 • Verification of trends and
 possible spatial impacts

 This report
 • Overview/comparison/results themes handled in the three activities

 • Conclusion / suggestions on the methods used for developing the scenarios.
6

The focus of the three activities differed in the way it concerned the more sector and economic
oriented trends, and the spatial component. A sector-oriented approach looks for example at the
quantity of ships in total and the number of containers. A spatial oriented approach looks more
into where these activities take place in the sea, so which shipping routes are most important
and what need is there for space on certain locations in the future. The following timeline
provides an overview of when the 3 activities have taken place and what the focus was of these
activities.

 Spatially oriented (relevant for MSP)

 Economic / Sector Oriented

 MSP
 Scenario Question
 Challenge
 study niare
 game

 June 2017 December 2017 January 2018

The report will use the three methods to discuss the several findings related to the future of
shipping in the Baltic Sea. The themes will be used as the structure of the findings sections, which
is chapter 5, of this report. However, before going into depth on the findings, chapter 2 will
describe a more elaborated view on the shipping sector in the Baltic Sea. Chapter 3 will elaborate
on the 3 the methods used (scenario study, questionnaire and MSP Challenge). Chapter 5
provides the conclusions of the report, both on the content discussed, as well on the methods
used.

The report might be updated by the end of the project if subsequent stakeholders’ consultations
indicate such a necessity.
7

Introduction to Baltic shipping

According to the UNCTAD more than 80% of global trade in terms of tonnage is transported by
sea. In 2016 the total seaborne merchandise reached the level of 10.3 billion tons. In the past 30
years the total amount of cargo transported by ships has almost doubled with an accelerated
increase since 2010. Especially the container market has grown considerably (Fig. 1).

Figure 1. International seaborne trade, selected years (millions of tons)
Source: Review of Maritime Transport 2016, UNCTAD/RMT/2016, New York–Geneva.

Baltic liner shipping consists of three main sectors: ferry (mainly passenger transport, with
accompanying unitized cargo – lorries, trucks, cars), cargo (mainly roll-on roll-off unitized cargo)
and container shipping (fig.2).
8

Figure 2. Short description of main ship categories
Source: HELCOM Maritime Assessment 2018.

There are about 2000 ships in the Baltic marine area at any given moment and about 3,500–5,500
ships navigate through the Baltic Sea per month1. More than 50% of the ships are general cargo
ships. Approximately 20% of the ships in the Baltic Sea are tankers carrying over 200 Mio. tons of
oil, about 11% are passenger ships operating about 50 Mio. passengers.

In 2014 all Baltic Sea countries (including Russia) controlled about 7,000 ships with gross tonnage
> 1,000, representing 13% of the world fleet and 35% of the EU-controlled fleet (Boteler et al.
2015). The EU-controlled fleet (including Norway) has expanded by more than 70% in the Baltic
Sea region in the period 2005 to 2014 (both in GT and DWT). However, the total number of
vessels decreased by 31% for the same period indicating a trend towards larger ship sizes,
especially for the cargo transport (Fig. 3).

Figure 3. Total annual crossings at fixed AIS lines in the Baltic Sea during 2006-2013 grouped by ship type
Source: Meski and Kaitaranta 2014.

1 Based on Helcom AIS stats.
9

2. Methods
The work on the trends and scenarios within the Baltic LINes project has been done in three
diverse ways, to get the most complete picture of the future of shipping in the Baltic Sea. We
have based our knowledge both on scientific and statistical data as well as on stakeholder
opinions which were at the end confronted in the frames of MSP Challenge simulation game.

Some issues have been discussed in all three activities, while other issues have only been included
in one for example the MSP Challenge game. The following schedule provides an overview of the
themes which are going to be discussed in this report and where they have been dealt at.

 Dealt with in:
 Topic / thematic issue Scenario Study Questionnaire MSP Challenge
 /interviews game
 Shipping numbers (cargo, container, ferries, etc) X X x
 Turnover in harbours X X
 Shipbuilding X
 Shipping route patterns X X X
 Ports’ development x X X
 Technology developments x X
 Autonomous shipping x X
 LNG or other propulsion x X X
 Global megatrends X x
 Legal framework x
 Environmental standards x x
 Offshore activities x x

The short descriptions of methods used are presented below.

2.1. Scientific economics: Future trends analysis and scenario building
One way to describe the future of Baltic shipping sector was to use the existing statistical data
and expert knowledge. Due to the large variety of ports, cargoes and types of vessels, a wide,
data-based research was launched to outline and describe the main streams of development for
BSR shipping economy. It is significant to show the development and possible future scenarios
for particular kind of vessel, cargo groups or even particular countries. Especially considering liner
shipping - the deeper researches to secure suitable space for safe shipping, port operations and
future development are required.

From the global point of view, influencing factors have been grouped into main megatrends –
kind of global stream of influence to the shipping. It was necessary to outline the global economic
development and current law framework which has crucial impact on the shipping market. The
external factors like changes in trade flows, environmental standards and re-routing of trade
10

have also been analyzed. Finally, internal factors were outlined similarly divided by particulars
scopes of maritime industry – shipyards, offshore, shipping and ports and harbours.

The starting point for discussion on the shipping future and scenarios was the extrapolation of
the existing trends. Forecasts for 2030 and 2050 were conducted using historical data provided
by EUROSTAT, HELCOM and national port and statistical authorities. The simple method of the
linear regression was used. This approach has been applied with regard to three variables that
turned out to be very important during the trend analysis namely:

 1. “Baltic ports total turnover” in all Baltic countries;
 2. “Number of vessel calls in the Baltic Sea Region by ship types”;
 3. “Number of passengers flows in the Baltic Sea ports by country”.

The least squares approach has been used to fit the models for each equation that allows
assumption that the errors are independently distributed with a normal distribution.

 Predict equation has been following :
 +1 = + ∗ (+1) +
 The lower (DGP) and respectively upper (GGP) limit of forecast have been given by:
 = +1 −
 = +1 +
 Where:

 2 ∑ ̂ )2
 =0( −
 = √ = √ =√
 − −1 − −1

 Se – root mean squared error
 MSE –mean squared error
 et – error term,
 yt – dependent variable,
 ̂ – theoretical value of the model,
 − number of observation in model,
 − model parameters number.

The lower and upper limits of forecast have been used in each case for identifying the optimistic
(“Fast Growth” scenario) and pessimistic scenarios (“Limited Growth” scenario). The reason for
the faster or slower growth of the predicted variables were attributed to the changes in the Baltic
Sea Region economies.

While preparing the scenarios the absence of the essential turning points have been assumed.
One might expect inter alia the implementation of numerous legal regulations with the aim of
improving safety at sea and environmental protection, resulting in some ship owners and vessels
11

being banned from the Baltic area and conscious transport policy adopted by the European
Commission with the aim of achieving the goals set out in White Papers 2011.

2.2. Asking stakeholders: Interviews and surveys
One week in advance of the MSP Challenge stakeholder workshop in Riga (January 2018)
individual invitations to participate in the survey were sent to the registered participants. An
internet survey was prepared and consisted of 15 sections with questions and explanatory
comments and figures. The survey asked for a number of personal details (i.e. institution and
country of work) and was introduced with a short overview of definitions regarding the ship type/
category (taken from the HELCOM Maritime Assessment 20182) to give a common understanding
of terms. Respondents were asked to share their opinion on distinct future developments in the
shipping sector. For the targeted year 2030 questions about potential developments in maritime
transport and potential port developments were raised, hence for the targeted year 2050
questions concerned potential technological developments and potential developments in
propulsion systems.3

During the MSP Challenge workshop several semi-structured interviews were conducted. Three
main question blocks were formulated beforehand by the project partners:

 1. Questions about the respondent’s background and present relations to shipping
 theme/sector.

 2. Questions about the awareness and knowledge about the MSP in general and the MSP
 Challenge workshop in particular. Questions about the respondent’s expectations and
 impressions about the MSP Challenge.

 3. Questions about the main trends/issues/challenges for Baltic Sea and Shipping sector for
 years and decades ahead.

First question block was more introductory – to get to know the respondent, while second and
third were meant to understand the specific opinion and knowledge. Besides main questions
additional and/or clarifying questions were asked during some interviews. 4 In the beginning

2
 Page 20-21 http://www.helcom.fi/Lists/Publications/BSEP152.pdf
3
 A total of 10 persons participated in the survey.
4 In total 8 respondents were interviewed and the interviews lasted from 3 to 15 minutes. Total amount of stakeholders at the

MSP Challenge workshop – 18. Represented organisations: Danish Maritime Authority; Estonian Maritime Administration;
Estonian Maritime Administration; Finnish Port Association; Shipping Institute Warnemuende; Shipping Institute
Warnemuende; BSH (Federal Maritime and Hydrographic Agency); Skulte Port Authority; Maritime Administration of Latvia;
Latvian Institute of Aquatic Ecology; Polish Ministry of Maritime Economy and Inland Navigation; University of Gdansk;
Morstroytechnology; Admiral Makarov State University of Maritime and Inland Shipping; Swedish Ship-owners Association;
European Maritime Safety Agency; Swedish Environmental Research Institute; HELCOM; Finnish Transport Agency (FTA);
12

respondents were asked if they are willing to answer some questions and if they agree that
interviews would be recorded as the working material. It was highlighted that the information
from the conducted interviews is an essential part for a) the improvement of the workshop (b)
the future actions regarding stakeholder integration on shipping (both Baltic LINes and other MSP
projects) and (c) the reporting for the project.

Hence further in text, the stakeholder opinions are highlighted in special boxes.

2.3 Engaging stakeholders: an MSP Challenge workshop
MSP Challenge is a brand, an umbrella, for a suite of board and digital games for higher
education, professional training and stakeholder engagement or involvement within the domain
of MSP. Like educational games, simulation games or ‘serious games’ in general, these games are
useful in any educational setting where active, (social) constructivist, experiential learning and
discovery learning are valued.

MSP Challenge 2050 Baltic Sea Edition is a Baltic Sea specific version of the MSP Challenge digital
game that was developed in the course of Baltic LINes. It is thus staged in the Baltic Sea region,
offers best-available real-world geographic data on human activities (e.g. locations of wind farms,
electricity cables, pipelines, etc.), and connects to validated simulation models for ecology,
shipping and energy that calculate and show consequences of planning decisions over time on
these three themes.

We used an early version of MSP Challenge 2050 Baltic Sea Edition in the workshop designed to
engage stakeholders in the topic at hand. Such a game-based workshop greatly helps evoke more
creative and simultaneously more considered responses from shipping stakeholders exploring
the future of shipping in the Baltic Sea. This is because we essentially recreate the real world to
the best of our ability through sophisticated interactive software that stimulates people to
develop ideas, implement them, and see the consequences through simulation, all in multiple
iterations (i.e. trial-and-error learning). Thanks to MSP Challenge, we can introduce the
influences of energy and ecological spatial plans and developments to shipping. Thus, even
though the simulation and overall workshop are simplified and condensed, the essence of the
marine environment that is the Baltic Sea are nonetheless represented and played out.

In designing the MSP Challenge workshop we used key input from the scientific economic future
trend analysis. We essentially used two major components of that analysis:

Latvian Ministry of Environmental Protection and Regional Development; Swedish Agency for Marine and Water Management
(SwAM); ERMAK Nord-West
13

 1. Ship traffic within, as well as in and out of, the Baltic Sea region. The shipping simulation
 used real data provided by HELCOM on the number of ships going from port to port, or
 coming into or going out of the Baltic Sea. Combined with the spatial areas for shipping
 (notably IMO shipping routes, and fairways), MSP Challenge’s shipping simulation could
 calculate month-by-month ship movements and visualize them on the Baltic Sea map in
 the game.
 2. Different growth patterns of shipping over a ten-year period. We took the slower and
 sustained growth scenarios into account in the shipping simulation. The first round of
 gameplay involved slower (limited, pessimistic) growth, while the second round involved
 higher (sustained) growth into account, conform the aforementioned scientific economic
 future trend analyses.

We then created three teams, each consisting of 9 people (of which 6 were the aforementioned
carefully selected shipping stakeholders):

 • Team South-West: playing from the viewpoint of South-West Baltic:
 o Denmark – Sweden – Germany – Poland – Russia (Kalinigrad) – Lithuania.
 • Team Central: playing from the viewpoint of Central Baltic
 o Sweden – Latvia – Estonia – Russia (St.Petersburg) – Southern Finland.
 • Team North-East: playing from the viewpoint of North-East Baltic & Bothnian
 o Sweden – Finland – Russia (St.Petersburg) – Northern Estonia.

Each team had the following roles, with appropriate team badge:

 • ‘Shipping planner’ - all the external participants were given this role.
 • ‘BSR Strategy representative’ – additional role for one of the external participants.
 • ‘Maritime Spatial Planner’ - the single MSPlanner, given to project team.
 • ‘Planner (other activities)’ - given to project team, looking particularly at energy and
 environment. Planners ‘non-shipping’/devil’s advocates take this role.

Over the course of one afternoon (January 24, 2018) and the following morning (January 25,
2018), the invited stakeholders (Fig. 4) were asked to identify current and future shipping issues
or developments within their region, and negotiate within and between regions to explore ideas
how to deal with them, and to draw spatial plans for these ideas if relevant.

To help the participants identify issues and develop ideas, we first offered two presentations,
covering recent developments and the status quo of shipping in the Baltic Sea. We then asked
the participants to play the aforementioned two rounds, which represented two eras in MSP
Challenge (2020-2030 and 2030-2040 respectively. By the end of the morning on the second day,
we wrapped up the workshop with a debriefing, reflecting on the kinds of issues and ideas that
were explored further, as well as their potential consequences (Fig. 4).
14

 1. Welcome 2. Test 4. ERA 2 (2030- 5. Wrap up
 Keynote
 3. ERA 1 (2020-2030): SLOW
 for par- 2040)HIGHER
 Warm up GROWTH Reflections
 Project pres ticipatns GROWTH

13:00 14:00 15:00 16:00 17:00 18:00 9:00 10:00 11:00 12:00 13:00
 DAY 1 DAY 2

 Figure 4. Overall design of the MSP Challenge workshop.
 Source: Baltic LInes

 Figure 5. The simulation gaming workshop setup in Riga, Latvia, on January 24-25, 2018.
 Source: Baltic LInes
15

3. Future trends and perspectives
3.1. Main development factors
The chapter focuses on the main factors influencing the Baltic shipping. The factors and the Baltic
response are described from the one hand by the data-based expertise and by stakeholders.

The Baltic shipping market has a long history of growth and is constantly changing. The region
does not have much impact on the global shipping market but it plays an important role as a
transport gate towards the Russian market for all EU members and a crucial network for
intraregional trade. In recent years there were many factors which influenced the state of
shipping, both in terms of quantity as well as quality (technological advances), among them the
disintegration of the Central and Eastern Europe, and the change in relations between these
countries, further accessions to the EU, global container revolution and the rapid growth and
socio-economic promotion of Eastern and Middle Europe. Currently the sea ports are in the eve
of important challenges, which will shape their status on the transport market. Introduction of
so called Sulphur Directive, political conflicts in Europe or the prolonged uncertainty about the
future of European economy, are just selected factors, which will determine the future of sea
ports in the Baltic Sea.

There are two major trends that must be underlined. Firstly, the growing domination of the
Russian market (containers for the Russian market are also handled by ports in Finland, Estonia,
Lithuania and Latvia). Secondly, the rising share of the Polish market (in 2007 it was merely 9%).

There are many external factors which can provide a serious impact on shipping economy
worldwide. The most important are changes in the economic development, law framework
(especially the environmental standards) and re-routing of trade.

Global economic development

 Figure 6. Trends in EU transport activity and energy
 consumption
 Source: Eurostat data.
16

A large number of sources (IMF 2017, UNCTAD 2017, WTO 2016) expects progressing economic
growth for the future but differs in strength of growth prognoses. In general, there is a strong
coherence between GDP growth and transport activity and performance (fig. 6). The global
shipping sector is highly dependent on the large-scale economic development in the world.
Changes in the economic development have a direct effect on the transport demand and, thus,
on the well-being of the commercial shipping market. These are coming from both, internal
sources, as well as external conditions of the global market:

 • diverging global population trends,
 • accelerating technological development,
 • continuing economic growth,
 • globalization and integration,
 • increasing international competition for resources, markets and consumers,
 • growing pressure on ecosystems,
 • increasing consequences of climate change,
 • diversifying approaches to governance and
 • increasing pollution and environmental impact.

All in all, countries located in Baltic Sea region are involved in most important chains of external
trade for United Europe. Most of those countries still need to invest in infra- and suprastructure
to be able to handle this traffic both rail and road and become “trade gateway” for Western
Europe.

Law framework in the future
The present research shows that are no long-term plans for the legislative change in the 20-40-
year period ahead. However, there are documents available, announcing the primary directions
of policy change, e.g. in maritime, transport (incl. shipping), environmental (incl. marine), port
and fishing policy. The policies adopted by the EU differ, taking the form of communications,
resolutions, white, green or blue papers, or regulations. The so-called EU integrated maritime
policy is a particular type of strategy, as it is not a single document, but comprises a cohesive
system of measures in specific sectors of the maritime economy. The focus of the integrated
maritime policy is on issues transcending a single policy area, promoting economic growth in
various sectors of the maritime economy, while also coordinating these various sectors and
entities operating within them. The directions of change indicated in the various policies adopted
by both national and Community legislation extend into the future until 2020, with an outlook to
the year 2030. No legislative amendments have been proposed for the year 2050.

The changes planned in the sea shipping industry mainly address the problem of CO 2 emissions
reduction. The proposed directions of change will impact the shipbuilding industry.
The regulations and guidelines will soon become binding for shipbuilders, forcing them to take
17

steps to introduce appropriate changes to reduce CO2 emissions. The main aim of these changes
is most of all to improve the energetic efficiency of newly built vessels5.

Common port policy designed to bring about future legislative change in the Baltic Sea region
derives from a number of factors, mainly (as is also the case with shipping) from the need for
protecting the natural environment. The Baltic Sea is one of the world’s most endangered marine
ecosystems. Therefore, the promotion of eco-ports is at present the catalyst for pro-ecological
transformations within Europe’s port sector. The changes in infrastructural regulations will come
as a result of a dynamic increase in ship size, leading to technical problems at ports. Larger ships
require wider and deeper waterways, new re-loading facilities and extensive port infrastructure.

Change in global trade flows - re-routing of the international trade

Political relations between EU and Russia, shortage of economic reform, and the low price of oil
as well as other commodities does not bode well for the return to the previous trade volumes.
Hence BSR ports that are involved in a trade with Russian market should adopt to lower volumes.
Nonetheless it’s crucial to remember that weaker Rouble is stimulating exports of Russian
products (such as chemicals, wood and fertilizers). In some ports, there is a rising trend in those
categories of cargo.6 This may support the traffic from Russia to Europe and other continents.
Considering that the most important Russian export gate to the West is the port in St. Petersburg,
sooner or later we should expect intensification of this direction. And given the winter months,
when the access to this port is limited or impossible, the traffic will have to find other flow
corridors, i.e. via Lithuanian or Polish sea ports.

The New Silk Road, also known as “One Belt, One Road” [OBOR] is a 1 trillion US$ plan with an
estimated economic multiplier of 2.5 (fig. 7). Since the plan was announced three years ago, only
5% of this budget has been spent. There are as many plans as interested countries and China is
talking to all of them. 10,000 articles have been written on the subject, but NDRC has retained
only 100. Nothing is decided yet, and may analysts tend to see OBOR as a geopolitical “carrot and
stick”, something similar to a modern day “Marshall Plan”.

5
 The Sixth Governmental Report and the First Biannual Report for the Conference of Parties to the United Nations
Framework Convention on Climate Change; Warsaw 2013, p. 78 and 93; Source:
https://www.mos.gov.pl/fileadmin/user_upload/srodowisko/szosty_raport_rzadowy.pdf (accessed on 5 June
2017).
6
 K. Liuhto, Maritime cluster in the Baltic Sea region and beyond, University of Turku, Finland, 2016, p. 76. Internet
source: https://www.researchgate.net/profile/Kari_Liuhto/publication/303459616_
Maritime_cluster_in_the_Baltic_Sea_region_and_beyond/links/574424c708ae298602f0fe73.pdf#page=72.
18

 Figure 7. “New Silk Road” proposed
 routes
 Source:
 https://www.globalinfrastructureinitiativ
 e.com

Looking at the European field, the construction of the Rail Baltica railway route is
a considerable step towards a better connection between EU border countries and the core
Europe (fig.8). It expected to provide an alternative for the north-south transit and might become
competitive towards maritime transport in BSR.7

Figure 8. Rail Baltica corridor
Source: https://www.intermodal-logistics.eu

7
 Ibidem, p. 178.
19

The development of the intermodal corridor connecting the Baltic and Adriatic Seas may also
lead to the significant changes in the Baltic liner shipping routing. This corridor is part of the EU’s
transport corridor network set out in White Book 2011
(fig.9). This may contribute to changes in the transport
flow from latitudinal (ro-ro lines from the
Mediterranean through the English Channel, the
North and Baltic Sea to Sweden, Finland and Russia) to
longitudinal (cargo transports bound first for Lubeck,
Rostock, Świnoujście, Gdynia/Gdansk and then by
ferry for Malmo, Trelleborg, Ystad, Karlskrona and
Stockholm have been shifted to rail routes). Looking
realistically, this may result only in investments
increasing the cargo capacity of these lines, as the
added workload is not sufficiently large to justify ships
running more frequently along that line, nor will it
generate demand for new lines.

 Figure 9. Baltic Adriatic Rail corridor
 Source: http://www.balticrail.com/

It have to be underlined here, that some EU initiatives seems to be contradictory as it is also
expected that a modal shift of transport from road to sea will take place in Europe. This trend
goes back to the White Paper “Roadmap to a Single European Transport Area – Towards
a competitive and resource efficient transport system” published by the European Commission
in 2011. The superior goal specified in the paper is to reduce greenhouse gas emissions from the
transport sector by 20% until 2030 (compared to 2008) and 60% until 2050 (compared to 1990).
To achieve this goal, it is aimed to move 30% of road freight over 300 km to other modes (rail
and waterborne) by 2030 and more than 50% by 2050.

Change in environmental standards
The Baltic Sea – an ecologically unique world’s largest reservoirs of brackish water - during the
last 100 years has changed from an oligotrophic clear-water sea into a eutrophic marine
environment (Madjidian et al. 2013). The high shipping traffic density is one of the main factors
for this negative development by causing air and water pollution. Pollution mainly results from
ships using heavy-fuel oil or marine diesel oil and exhausting pollutants such as nitrogen oxide
(NOx), sulphur oxide (SOx) and particulate matter (PM). The Baltic Sea is designated as an
Emission Controlled Area (ECA) and as a Particularly Sensitive Sea Area (PSSA) for which apply
much stricter regulations.
20

In 20118, the European Commission set the target of cutting carbon emissions in transport by
60% by 2050, including at least 40% cut in shipping emissions. Also there is the long-term
objective of “zero-waste, zero-emission” released by the EU’s maritime transport policy. These
goals are ambitious as projections show that shipping may increase its annual CO2 emissions from
800 million tons in 2010 to 2000 million tons by 2050 if no measures are taken (Parsmo et al.
2016).

With regard to future perspectives the EU Marine Strategy Framework Directive (MSFD) is of
importance as it has the aim to achieve good environmental status by 2021. Following
the MSFD all EU member states are required to develop a marine strategy which includes an
initial assessment of the state of environment and a clear description of monitoring programs
(Boteler et al. 2015).

On a regional scale HELCOM is the governing body of the Convention on the Protection of
the Marine Environment of the Baltic Sea Area. With regard to regulations concerning
the environment the Baltic Sea Action Plan (BSAP), adopted 2007, is the key instrument for future
conservation as it aims to restore good ecological status of the Baltic Sea by 2021. Main goals
refer to stop eutrophication, avoid hazardous substances, ensure biodiversity and conduct
maritime activities in an environment friendly way (Boteler et al. 2015).

In addition to the aim to achieve good environmental status the Convention of Biological
Diversity (CBD) set the target to protect a minimum of 10% of each habitat in the Baltic Sea
region. Since 2004 the area of marine protected areas (MPAs) increased threefold. Today about
12% of the Baltic Sea is already covered by the 163 MPAs, either as part of the Natura 2000
network or as HELCOM Baltic Sea protected area (HELCOM 2014). Even though a total of more
than 10% of the area is protected already this is not the case for the sub-basins of the Baltic Sea.
Therefore HELCOM aims to designate more MPAs in areas where the coverage is rather low. This
applies mainly to areas at open sea, implicating that the focus will lay on
the protection of areas which are also interesting for the offshore energy sector.

8
 White Paper, EC 2011.
21 KEY MESSAGES on External factors and trends The shipping market is highly dependent on the global and regional economic development. Globally transport overseas has increased over the last decades. The shipping market is expected to grow. In the Baltic Sea economic growth of commercial shipping seems to be bipolar. It can be mainly attributed to increasing trade volumes of Russia and the recent increase in the Polish ports performance. Both, the MSFD and HELCOM, request Baltic Sea countries to present a marine strategy ensuring a good environmental status of the Baltic Sea by 2020/2021. HELCOM aims for additional MPAs, especially in offshore areas that have a lower protection coverage than the rest of the Baltic Sea. The European Commissions’ ambition to shift transport from road to sea supports this development. On the other hand there are EU initiatives to support rail connections which can be competitive to shipping. The European Commissions’ rail corridors’ plans may support the selected ports infrastructure development.
22

Trends within the shipping sector
The shipping business is driven by many different internal factors from which the two spatially
most important will be further explained. These are the fleet & ship characteristics and
the technology developments.

Looking at the fleet & ship characteristics some general trends become obvious from the
beginning. The first is the general direction of increase of the quantitative and qualitative fleet
development. The world’s fleet is growing on average by 0.63% year on year in terms of its size
and by 4.98 % year on year in terms of its deadweight tonnage. This means that year by year
world existing fleet changes into less number of vessel but newly launched vessels are bigger /
have larger DWT. Bigger vessels attain better efficiency and lower costs per freighted unit but
this trend has also huge impact to worldwide ports. For larger vessels the list of ports which can
handle it shrinks considerably. Thus, fleet growth puts pressure on port authorities and terminal
operators to fit new requirements and react to their business environment.
One should ask here a question of limits of these parameters growth.

The second trend relates to changes in the type of ships which form the world’s maritime fleet.
The fastest-growing type is represented by gas carriers, chemical tankers and container ships. At
the same time, these vessels are highly specialized and relatively expensive. LNG gas carriers owe
their fame to increased usage of natural gas as the purest form renewable energy. These changes
extend to the Baltic Sea area, as natural gas is gaining ground in that region. This is exemplified
by new liquid natural gas regasification terminals now under construction in Klaipeda and
Świnoujście. Chemical tankers thrive due to a shift in freight forwarders’ preferences towards
specialized cargo requiring dedicated technologies of chemicals transport from Europe’s industry
leaders. Container ships exemplify the trend of specialization in the transport of unitized
(containerized) general mass cargo which is now traded on a large scale. This trend showed its
first symptoms as trade links grew between Western Europe and the USA, reaching its peak level
in the commercial relations between South-Eastern Asia and Europe or the USA. The vessels
operating there feature ever-growing cargo capacities, while their total length is 400 metres and
remains basically unchanged. A number of factors combine to make for larger cargo space,
including ship width increments, U-shape hulls and separation of bridge and engine room. As can
be seen, the main direction of development is specialization.
23

STAKEHOLDERS VIEW

The Baltic shipping stakeholders were asked which trend they do expect regarding fleet
parameters. The graph below shows the respondents’ expectancies regarding the future
dimensions of ships in the Baltic Sea. For most ship types it is expected that the dimensions
are about to stay the same or – less strongly pronounced – will have increased by 2030.
For none of the types decreasing ship dimensions are foreseen by the respondents. The
only exception is for container ships, where a clear tendency is observable towards
increasing lengths and drafts.

 Which trend do you expect regarding:

 - average length of ships?

 - average width of ships?

 - average draft of ships?
24

In terms of technology, the main directions of change are as follows:
 • ship’s propulsion and fuels;
 • hull shape;
 • optimization of ships operations;
 • increasing environmental standards for maritime transport.

Table 1 shows an overview of future shipping technology issues. In this report we will focus
mainly on the developments which that ultimately affect the sea space and its use.

Table 1. Most influential shipping technology issues

 Smaller engine/de-rating
 Ballast Water Treatment System Pure gas engine
 (speed reduction)
 Reduction of seawater ballast
 Low sulphur heavy fuel oil Air cushion
 capacity
 Liquefied Natural Gas SCR system Wind & solar power
 System efficiency improvement Ship Size and advanced ship
 SOx scrubber
 (Aux) design
 Unmanned vessels (airplane
 Hull shape optimisation Lightweight constructions
 piloting model)
 Waste heat recovery Dual fuel engine Vessels interconnectivity (Ship 3.0)
 Cargo and ship integrity monitoring
 Propulsion efficiency devices Water emulsification
 systems
 Humid air motor/ direct water
 Distillate fuel New materials
 injection
 EGR system Hybrid propulsion system Robotics at the sea
 Supply chain perspective
 Low NOx tuning Counter rotating propulsion
 (coordination with stakeholders)
 Shaft generators Self-unloading systems
Source: Baltic Shipping scenario development, Ernest Czermański, Baltic LINes internal report, 2017

LNG Fleet

One of the answers to comply with environmental regulation is to use LNG fuel. Until March
2015, there were nearly 140 confirmed LNG-fuelled ship projects globally (60 functional LNG-
fuelled ships and 78 under refitting/construction). Most of the LNG-fuelled fleet (over 80%) are
represented by small ships (passenger/car ferries, offshore platform supply vessels, tugs and
petrol vessels) currently sailing in Norwegian waters. However, there are also some larger LNG-
powered vessels, such as ro-pax and ro-ro, gas carriers, and general cargo vessels.9 This trend is

9
 K. Liuhto, Maritime cluster…, op. cit., p. 157.
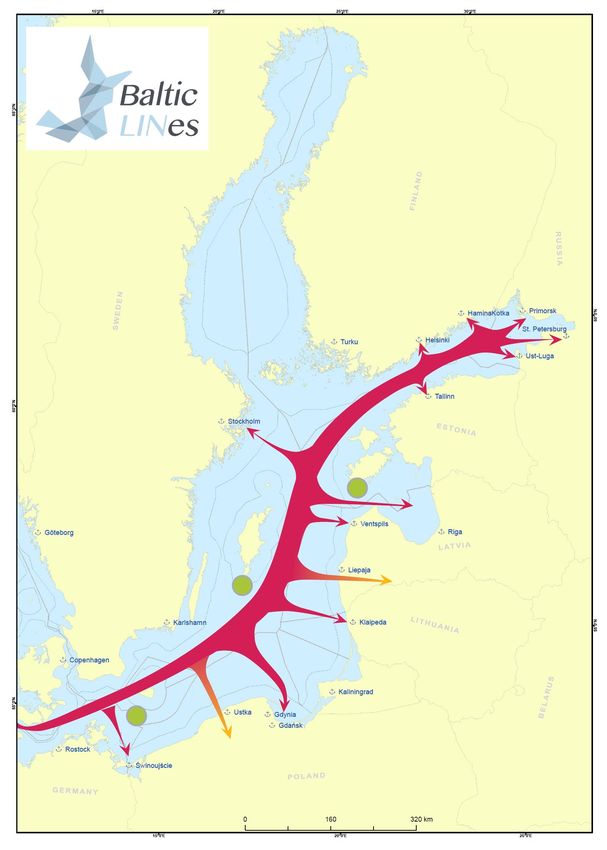
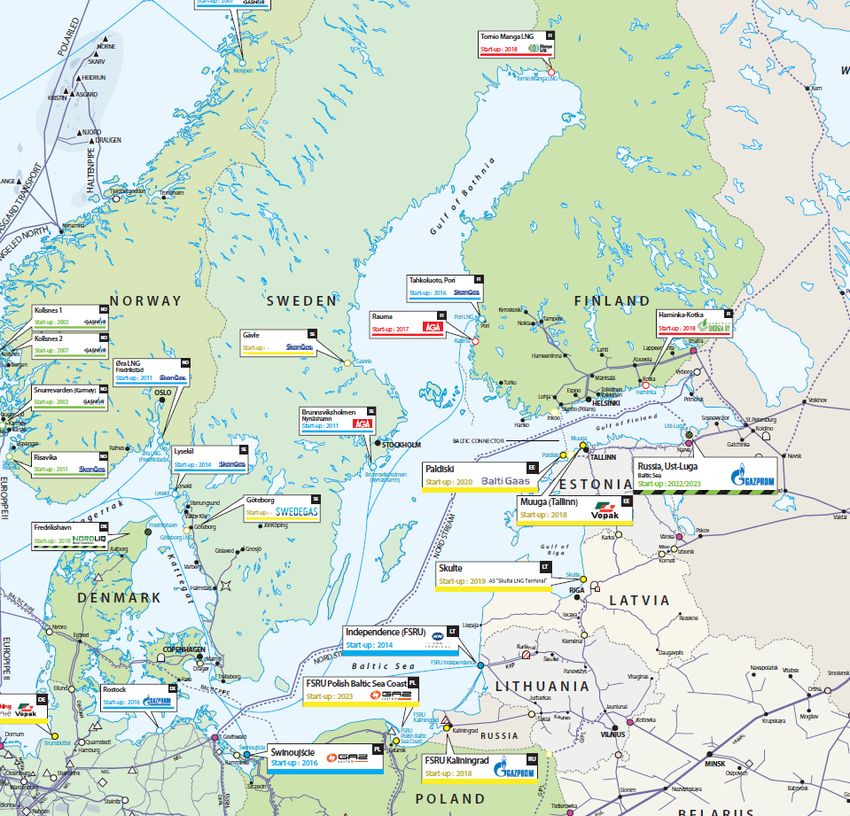
25

also getting visible in BSR, where in 2017 a Danish short sea operator launched the first LNG-
fuelled container vessel.

Figure 10. Forecasts of LNG fuelled ships
Source: LNG for Shipping – Current status, Claus Winter Graugaard, 2013

The expansion of the LNG infrastructure in Europe is also influencing the ports development. The new
infrastructures will result in ports specialization and enlargements. Figure 11 presents the newest
overview of existing and planned LNG infrastructure in Europe including LNG terminals.

 ,
Figure 11. LNG Map 2018 - existing and planned infrastructure
Source: https://www.gie.eu/
26

STAKEHOLDERS VIEW

The stakeholders were asked what portions of vessels they do expect to be used as main
propulsion system. The graph below shows the expected shift in main propulsion systems
by 2050. While electricity is anticipated mainly as propulsion for the short-distance service
traffic, are cruise ships likely to have hybrid propulsion systems. It is to conclude that the
most severe switch to alternative propulsion is anticipated for the ferry/ ro-ro sector
showing counts for all three questioned alternatives, namely LNG, electricity, and hybrid
systems. The lowest expectations for a change in propulsion, on the other hand, are given
to tankers.

 Which portion of vessels do you expect to use as main propulsion system?

 LNG?

 Electricity?

 Hybryd systems?
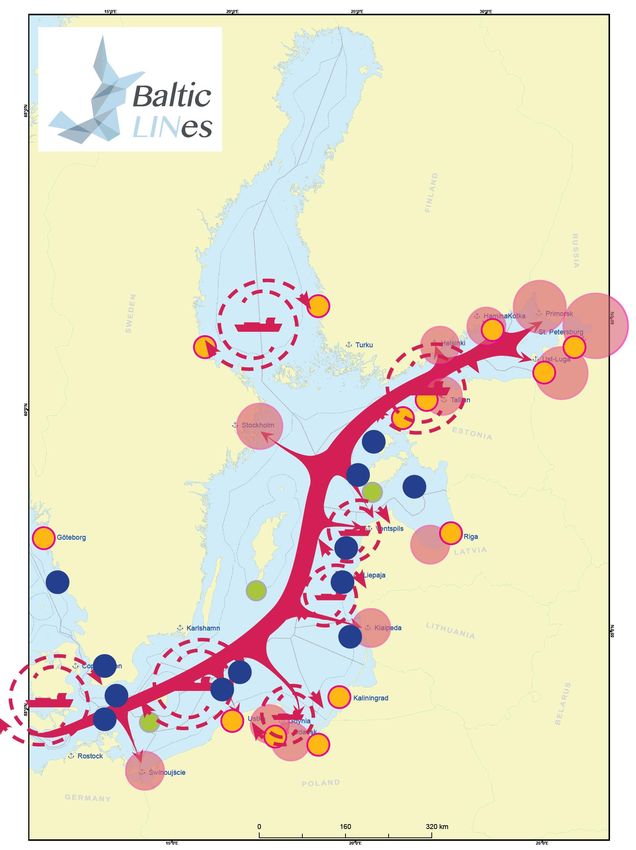
27

This issue was also discussed in the frames of MSP Challenge game in Riga 2018. The discussion
could be summarized as follows:
▪ All competitive ports will have LNG facilities in time. Increased intensity coming from
 bunkering facilities and maybe more densified. Offshore, further at sea bunkering not
 expected. Without that, there is no further interest for MSP since the spatial impacts are low.
▪ Potential of a major hub in e.g. Gothenburg or other entry to Baltic Sea for transferring cargo
 from larger ships onto multiple smaller ‘feeder’ ships, which would then have the benefit of
 more environmentally friendly propulsion systems and also change the spatial traffic pattern
 of larger and smaller ships.

Autonomous shipping

Since a number of years automation is on the agenda for all operative and technical processes of
maritime shipping. The unmanned machinery space is already reality on board of many seagoing
vessels. In this concept the engine room and its control room is only manned during normal day
time working hours, while it is unmanned overnight. Yet, the concept for the navigational bridge
of a ship is different. It is still manned at any time when the ship is underway. The manning level,
however, has been significantly reduced with often only the watch keeping officer being on the
bridge when the ship is in open waters. To facilitate such
a reduced manning level several automated navigational systems have been introduced during
the past years. Today, an advance voyage planning is carried out on the electronic chart display
and information system (ECDIS). Together with an automatic track control, including
autonomous course alterations and continuous track monitoring, to avoid undesired deviations
from the pre-planned track, a ship could safely pass all known navigational hazards in
a reasonable distance without running into danger of grounding on a well charted shoal or
colliding with men made installation.

 STAKEHOLDERS VIEW
 “Future challenge - autonomous shipping – technically already possible, but it will affect safety issues,
 security issues, and basic legal issues. Not obvious how it will impact marine space – probably first
 solution would be to separate autonomous shipping from other shipping – to have sort of highways”
 – Respondent taking part in the MSP Challenge workshop.

A roadmap devoted to the topic of unmanned ships in the Baltic Sea Region has been developed
by the ONE SEA project. The plan is to test fully remote-controlled vessels in the next 3 years
(2018–2020), and - by 2025 – focus on autonomous commercial traffic (Fig. 12).
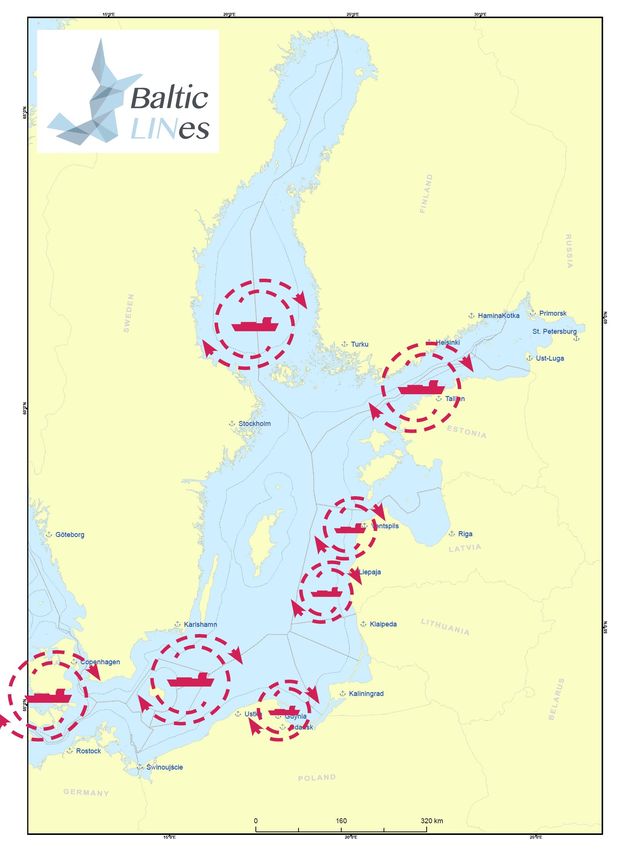
28

 Figure 12. Timeline for autonomous ships
 Source: https://www.oneseaecosystem.net

According to last updates from the market, the first autonomic vessel will start its service in 2018.
Yara Birkeland will be 120TEU container ship at service between Herøya – Brevik – Larvik in
Norway. At the very beginning the vessel will start sailing with small crew on board and become
fully autonomous vessel in 2020. The operational field is fully covered by the VTS system which
supports the need to keep full control over the unit10.

 Figure 13. Jaakonmeri Test Area for
 autonomous vessels
 Source:
 https://www.oneseaecosystem.net

10
 https://www.km.kongsberg.com/ks/web/nokbg0240.nsf/AllWeb/4B8113B707A50A4FC125811D00407045?Open
Document; 25.11.2017.
29

STAKEHOLDERS VIEW

The Baltic shipping stakeholders were asked which portion of completely unmanned vessels
they do expect in the Baltic Sea by 2050. The graph below shows the frequency of answers
regarding the portion of completely unmanned vessels sailing in the Baltic Sea by 2050. It is to
observe that unmanned vessels seem to be rather unlikely for tanker and cruise ships but most
likely for cargo/ container and ferry/ ro-ro ships. However, only few of the respondents expect
that unmanned sailing will be the dominant transport form by 2050.

 Which portion of completely unmanned navigated vessels do you expect in the Baltic Sea by
 2050?

The discussion held in the frames of the MSP Challenge game in Riga (2018) gave more detailed
insight into stakeholder’s thoughts. It was stated that small ferry lines could be the first to use
autonomous vessels. In general it is expected that full autonomy will most probably only
happen to ferries, container ships and in domestic shipping and on certain routes only.
30 KEY MESSAGES on technology development factors The world existing fleet will change its parameters - fewer vessels but newly launched vessels are bigger / have larger DWT. Fleet growth puts pressure on port authorities and terminal operators to fit new requirements and react to their business environment. Specialization is the main direction of technology developments. Short-term development focuses on facilitating the LNG technology to be able to shift to alternative fuels. In the long-term hybrid-propulsion systems are regarded as the most convenient solution. If bunker facilities are not build offshore, there is no major impact on MSP expected. Autonomous operation of unmanned ships is still under scientific investigation but represents a real future option for some types of commercial shipping. An according road map for the Baltic Sea Region has been developed by the ONE SEA project. The increasing level of automatization may require the designation of fixed shipping routes and consistent safety distances, as well as strict spatial rules for the recreational use of leisure crafts. Most probably the autonomous system will be developed in the following types of ships: medium-size bulk carriers, cargo barges, offshore service vessels, tugs.
31

Summary of main trends

Based on the outlined changes of the global, external and internal factors, the general trends for
the shipping sector in the Baltic Sea Region can be summarized as follows.
First, shipping is likely to increase on an intra- as well as on an extra-European scale due to global
population growth, economic growth and effects of increasing globalization.

Secondly, it is expected that a modal shift of transport from road to sea will take place in Europe.
The Baltic Sea favours waterborne transport over shorter distances because of the high density
of harbours. Here Short Sea Shipping often reduces the total distances compared to road freight
transport. The development towards a raise of road-, bridge-, and tunnel taxes in several EU
countries favours this shift from road to sea. However, the shipping industry remarks that also
shipping becomes more expensive due to stricter regulations.

Thirdly, it is expected that there will be a greater number of larger vessels to enable more
efficient and cost-saving freight transport. However, larger ships are not efficient during times of
economic depression as they may be only partly loaded. Shipping companies may account for
this risk in having a mixed fleet consisting of ships of different size and react to overcapacity with
slow steaming (i.e. going at reduced speed to save fuel costs). Larger ships with deep draught
represent a major challenge especially for routes entering the Baltic Sea or crossing its shallow
areas as well as for the port development as channels need to be deeper and wider.

GOODS TRANSPORT

In the Baltic Sea Region the transport of cargo increased by around 18% from 2004 to 2013. This
growth can be mainly attributed to an increased turnover in ports in the eastern Baltic Sea region,
especially Russia. Cargo ships in the Baltic Sea are still often packed with break bulk
(e.g. forestry, metal or steel products).

The strongest growth is to observe for the transport of crude oil and fuels after completing the
construction of deep-water oil terminals in Primorsk and Ust-Luga as of 2015. In terms of handled
cargo mass, the biggest Baltic Sea ports are located in Russia (first two places in 2016).

Container shipping seems to be the most extensive, complex and complicated of all. It is
necessary to divide it into two groups: shortsea/feeder and ocean carriers. In the Baltic Sea
Region there are 20 carriers operating a total of 130 vessels - mainly feeder ships with an average
loading capacity of 1,248 TEU and register tonnage of 1.78 mln RT. Their combined capacity
amounts above 160 thousand TEU and is rising (the old vessels are replaced with new and larger
ones).
32

 STAKEHOLDERS VIEW

 Th Baltic shipping stakeholders have been also asked on future trends regarding the total
 annual volume of cargo/ passengers and the annual number of ships sailing in the Baltic Sea
 by 2030. Most significantly is the expected increase in cargo for container ships while their
 number is less likely to rise. This combination allows the conclusion that the cargo capacity
 of container ships will probably increase.

 Which future trends do you expect for the total annual volume of cargo/passengers
 transported by ships in the Baltic Sea?

 A different observation can be made for passenger ships (include ferries and cruise ships) which are
 expected to gain both in the annual number of ships as well as an increasing number of passengers.
 With regard to the development in number of ships it is also to observe that generally more service
 vessels, less fishing vessels and an increasing number of leisure boats is expected.

 Which future trends do you expect for the annual number of ships sailing in the Baltic Sea?

PASSENGERS TRANSPORT

In the past two decades a downwards trend of maritime passenger transport is to observe.
This is mainly related to declining ferry services resulting from competition with inexpensive
commercial flights and high speed rail links. On the other hand, the cruise ship sector is due to
an upwards trend, with Europe as one of the key markets for the global cruise ship industry.
Current plans show that between 2015 and 2021 34 of the 36 new cruise ships to be constructed
33

can be attributed to European yards. Five of the European main destinations are located in the
Baltic Sea region, namely St. Petersburg, Copenhagen, Tallinn, Helsinki and Stockholm (Parsmo
et al. 2016).

 STAKEHOLDERS VIEW

 Baltic shipping stakeholders were asked additional, regionally focused question on which
 trend do they expect for the following international connections. The graph below shows the
 frequency of answers regarding the expected development of Baltic ferry connections.
 For almost all ferry connections it is anticipated that they will gain importance or at least stay
 the same. Only for the ferry connection between Puttgarden and Rødby the respondents could
 imagine a decreasing trend, which finds its reasoning potentially in the planned tunnel project
 “Fehmarnbelt” which will then present a direct connection between Germany and the Danish
 island Sjælland and reduces the time needed to travel from Hamburg to Copenhagen
 considerably.

 Which trend do you expect for the following international ferry connections?

PORTS
There are about 400 sea ports in the entire Baltic Sea Region, 90 of which are of transport
significance. Considering the European TEN-T net spatial structure11, Baltic Sea ports can be
divided into two categories - base ports and comprehensive network ports.

HELCOM data suggests that the number of Baltic ports stay the same but existing medium and
large ports are likely to grow by more than 50% in the next ten years. Especially northern ports

11Regulation (EU) No 1315/2013 of the European Parliament and of the Council of 11 December 2013 on Union guidelines for
the development of the trans-European transport network and repealing Decision No 661/2010/EU (Text with EEA relevance
2013 L 348/1).
34

could benefit from anticipated climate warming and related ice-free conditions during the winter
months (WWF 2010).

The expected larger portion of bigger vessels might force the concentration of cargo in bigger
ports which have better chances of financing the port infrastructure. Small and medium sized
ports will not be able to handle larger ships, which in a long term might stimulate the
concentration of cargo in bigger ports even further. This may push the medium ports to pursue
cooperation with larger ports in order to achieve synergy between them. Making a local or
regional alliances as well as mergers of small ship-owners are also plausible scenarios in the
future.12 An important direction in the development of sea ports is represented by the creation
of logistical centres and industrial parks in the port hinterlands. This type of initiative is aimed to
make port services more attractive through providing comprehensive logistics and, as
a result, creating additional load weight, contributing to extra added value from the port.
The conclusion is that development understood as creating new infrastructural facilities is just as
important as ensuring an efficient transport process and establishing good business relations for
ports.

12
 K. Liuhto, Maritime cluster in the Baltic Sea Region and beyond, Internet source:
https://www.researchgate.net/profile/Kari_Liuhto/publication/303459616_Maritime_cluster_in_the_Baltic_Sea_r
egion_and_beyond/links/574424c708ae298602f0fe73.pdf#, p. 147 and 159.
You can also read