Radionuclide wiggle matching reveals a nonsynchronous early Holocene climate oscillation in Greenland and western Europe around a grand solar ...
←
→
Page content transcription
If your browser does not render page correctly, please read the page content below
Clim. Past, 16, 1145–1157, 2020
https://doi.org/10.5194/cp-16-1145-2020
© Author(s) 2020. This work is distributed under
the Creative Commons Attribution 4.0 License.

Radionuclide wiggle matching reveals a nonsynchronous early
Holocene climate oscillation in Greenland and western Europe
around a grand solar minimum
Florian Mekhaldi1 , Markus Czymzik2 , Florian Adolphi1,3 , Jesper Sjolte1 , Svante Björck1 , Ala Aldahan4 ,
Achim Brauer5 , Celia Martin-Puertas6 , Göran Possnert7 , and Raimund Muscheler1
1 Department   of Geology – Quaternary Sciences, Lund University, 22362 Lund, Sweden
2 Leibniz Institute for Baltic Sea Research Warnemünde (IOW), Marine Geology, 18119 Rostock, Germany
3 Physics Institute, Climate and Environmental Physics & Oeschger Centre for Climate Change Research,

University of Bern, 3012 Bern, Switzerland
4 Department of Geology, United Arab Emirates University, 15551 Al Ain, UAE
5 GFZ German Research Centre for Geosciences, Climate Dynamics and Landscape Evolution, 14473 Potsdam, Germany
6 Department of Geography, Royal Holloway University of London, Egham, TW20 0EX Surrey, UK
7 Tandem Laboratory, Uppsala University, 75120 Uppsala, Sweden

Correspondence: Florian Mekhaldi (florian.mekhaldi@geol.lu.se)

Received: 9 October 2019 – Discussion started: 4 November 2019
Revised: 24 May 2020 – Accepted: 3 June 2020 – Published: 3 July 2020

Abstract. Several climate oscillations have been reported       1   Introduction
from the early Holocene superepoch, the best known of
which is the Preboreal oscillation (PBO). It is still un-       One of the great challenges in paleoclimatology today is how
clear how the PBO and the number of climate oscillations        to better assess the spatial and temporal dynamics of past cli-
observed in Greenland ice cores and European terrestrial        mate changes. This can only be achieved through robust and
records are related to one another. This is mainly due to       consistent chronologies for different records and different re-
uncertainties in the chronologies of the records. Here, we      gions. Unfortunately, this is a challenging task, and we often
present new, high-resolution 10 Be concentration data from      assume the synchrony of such events through climate tuning
the varved Meerfelder Maar sediment record in Germany,          different records. One such example is the Preboreal oscil-
spanning the period 11 310–11 000 years BP. These new data      lation (PBO) (Björck et al., 1996), which represents a cold
allow us to synchronize this well-studied record, as well as    spell that occurred shortly after the Younger Dryas–Holocene
Greenland ice core records, with the IntCal13 timescale via     transition. Indications of a cold phase have also been reported
radionuclide wiggle matching. In doing so, we show that the     in a number of European terrestrial records, most of which
climate oscillations identified in Greenland and Europe be-     use biological proxy and isotope data (Björck et al., 1996,
tween 11 450 and 11 000 years BP were not synchronous but       1997; Bos et al., 2007; Magny et al., 2007; van der Plicht et
terminated and began, respectively, with the onset of a grand   al., 2004; von Grafenstein et al., 1999). A cold and dry cli-
solar minimum. A similar spatial anomaly pattern is found in    mate oscillation, thought to be related to the European PBO,
a number of modeling studies on solar forcing of climate in     has also been observed in the δ 18 O and accumulation sig-
the North Atlantic region. We further postulate that freshwa-   nals of a number of Greenland ice cores between 11 520 and
ter delivery to the North Atlantic would have had the poten-    11 400 years before 2000 CE (b2k), and it is referred to as
tial to amplify solar forcing through a slowdown of the At-     the 11.4 ka event (Rasmussen et al., 2007, 2014). Due to
lantic meridional overturning circulation (AMOC) reinforc-      chronological uncertainties, it is, however, unclear whether
ing surface air temperature anomalies in the region.            the 11.4 ka event in Greenland and the European PBO repre-
                                                                sent one single and synchronous widespread event, an event

Published by Copernicus Publications on behalf of the European Geosciences Union.
1146                                  F. Mekhaldi et al.: Radionuclide wiggle matching of early Holocene climate oscillations

that gradually propagated over time, or whether the Euro-           of western Germany that was annually laminated (varved)
pean PBO is unrelated to the 11.4 ka event in Greenland.            throughout most of the Holocene (Brauer et al., 2000).
These open questions limit our understanding of the underly-        Around 0.25 g of dried and crushed material was taken for
ing triggering and propagation mechanisms of these climate          each sample with a temporal resolution of 3 and 10 years
changes.                                                            (see dataset), and 0.5 mg of 9 Be carrier was added. 10 Be
   Around this period, one of the largest and longest-lasting       was extracted from the sediment samples at the 10 Be labora-
grand solar minima (persistently low solar activity resulting       tory of the Earth Sciences Department of Uppsala University,
in a significantly higher radionuclide production rate) of the      Sweden, following the methodology described by Berggren
Holocene occurred between 11 280 and 10 960 years before            et al. (2010). All samples were measured using the accel-
1950 CE (BP). This was evidenced by beryllium-10 (10 Be)            erator mass spectrometer (AMS) of the Tandem Laboratory
data in the Greenland Ice Core Project ice cores (GISP2 and         in Uppsala. The 10 Be concentration (in atoms per gram) of
GRIP) in central Greenland (Finkel and Nishiizumi, 1997;            each sample is calculated based on the 10 Be counts R to 9 Be
Muscheler et al., 2004; Adolphi et al., 2014) and by 114 C          counts Rst ratio and, taking into consideration the NIST SRM
(14 C/12 C corrected for fractionation and decay relative to a      4325 reference standard (10 Be/9 Be = 2.68 × 10⁻¹¹ ), on the
standard and noted as 1 in Stuiver and Polach, 1977) de-            weights of the carrier WC and of the sample WS , as well as
rived from tree rings (Reimer et al., 2013). This substantial       the Avogadro constant NA and atomic weight Ar of beryl-
change in solar activity (from high to persistently low) offers     lium:
an advantage to us for synchronizing timescales as it has left                        R                    WC NA
                                                                    10
a clear imprint on the atmospheric production rate of the cos-           Be conc. =       · 2.68 × 10⁻¹¹ ·   ·   .
                                                                                      Rst                  WS Ar
mogenic radionuclides 10 Be and 14 C (Fig. 1). That is to say
that these radionuclides are produced by a nuclear cascade
                                                                    2.2     Chronologies and synchronization
which is triggered when cosmic rays enter the atmosphere.
The Earth is shielded, to some extent, from these cosmic            The paleoclimate data investigated herein come from differ-
rays by the fluctuating strength of the helio- and geomag-          ent studies with different records and thus different chronolo-
netic fields. Therefore, radionuclides carry in part the sig-       gies. The new sediment 10 Be concentration data come from
nal of solar activity, which is then stored in natural archives     MFM, the chronology of which (MFM2012) was established
such as in polar ice caps or lake sediments (10 Be), as well        using mainly microscopic varve counting fixed on an ab-
as in tree rings (14 C). Consequently, we can use these global      solute timescale via tephrochronology, as well as radiocar-
fluctuations in the atmospheric production rate of radionu-         bon dating, with a maximum varve counting error of up to
clides to synchronize records from different environmental          110 years (Brauer et al., 2000; Martin-Puertas et al., 2012a).
archives and investigate the timing of climate events during        A more recent chronology (MFM2015) exists which includes
the earliest part of the Holocene (Southon, 2002; Muscheler         the identification and age of the Vedde Ash, although it re-
et al., 2014; Adolphi and Muscheler, 2016).                         mains unchanged for the Holocene part (Lane et al., 2015),
   Here we present new, high-resolution 10 Be concentra-            which is the period of focus in this study. We also use pub-
tion measurements from the well-studied varved Meerfelder           lished 10 Be flux data (Adolphi et al., 2014) from the GRIP
Maar (MFM) sediment record in western Germany, spanning             ice core in central Greenland and within the Greenland Ice
across these large fluctuations in solar activity from 11 310 to    Core Chronology 2005 (GICC05) framework (Rasmussen et
11 000 years BP. Because of its limited catchment area and          al., 2006; Vinther et al., 2006; Svensson et al., 2008; Seier-
the existence of 10 Be data covering the late glacial–Holocene      stad et al., 2014). Finally, we use 14 C production rate data
transition (Czymzik et al., 2016), MFM represents an ideal          (Muscheler et al., 2014) inferred from the IntCal13 14 C cal-
location for the aim of this study. As such, the new 10 Be data     ibration curve (Reimer et al., 2013) as the anchoring record
allow us to synchronize MFM and Greenland ice core records          for our synchronization. That is to say that we synchronize
with the IntCal13 timescale through the wiggle matching of          the MFM2012 timescale (using our 10 Be concentration data)
these different radionuclide records. We can then investigate       and the GICC05 timescale (using the GRIP 10 Be flux data)
the timing of the fluctuations observed in the corresponding        with IntCal13 (using the 14 C production rate data).
paleoclimate records at a high chronological precision and             The synchronization of the different radionuclide records
assess their relationship in regard to changes in solar activity.   was computed following the methodology described in Adol-
                                                                    phi and Muscheler (2016). This method employs the same
                                                                    Bayesian approach as is used for wiggle matching tree ring
2     Methods                                                       14 C sequences to the radiocarbon calibration curve (Bronk

2.1    Preparation of sediment 10 Be samples
                                                                    Ramsey et al., 2001). It exploits the fact that the spacing
                                                                    between samples is precisely known from varve and layer
The new 10 Be samples come from the composite sediment              counts and that, hence, the probability density functions from
profile MFM09 (Martin-Puertas et al., 2012a) which was re-          individual samples can be combined using Bayes’ theorem.
trieved at MFM, a deep crater lake situated in the Eifel region     Analogous to radiocarbon wiggle matching of tree rings, we

Clim. Past, 16, 1145–1157, 2020                                                          https://doi.org/10.5194/cp-16-1145-2020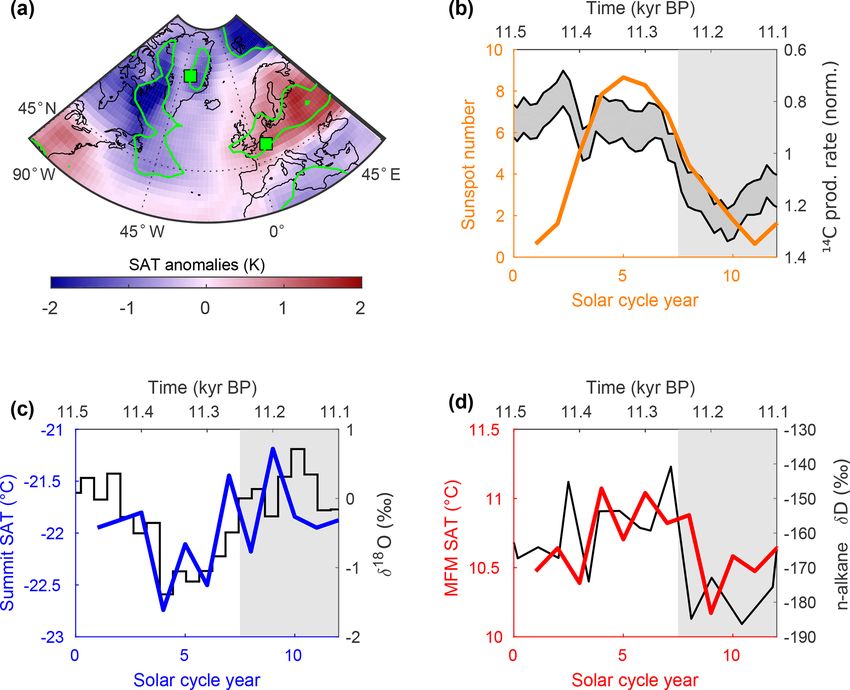
F. Mekhaldi et al.: Radionuclide wiggle matching of early Holocene climate oscillations 1147
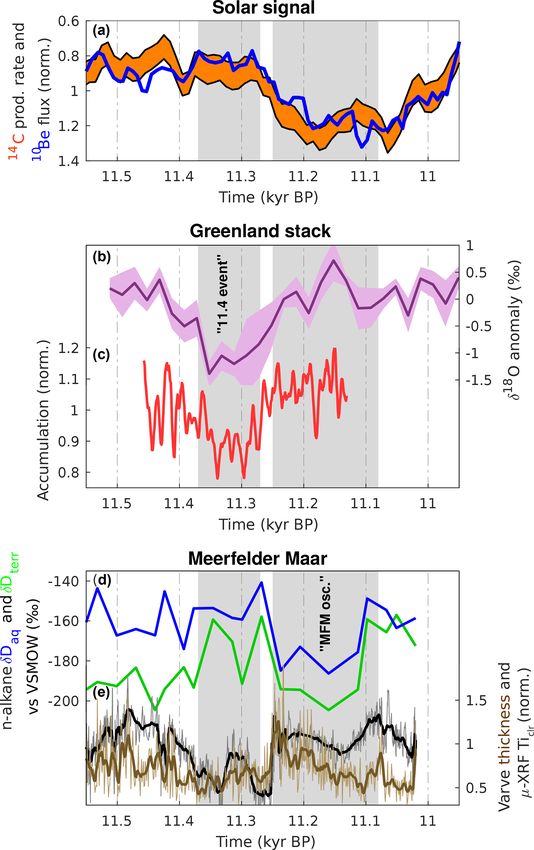
Figure 1. (a) The IntCal13 calibration curve (Reimer et al., 2013) expressed as 114 C (see text). (b) The 10 Be concentration data from
Meerfelder Maar (MFM), spanning the period 11 310–11 000 years BP, are plotted in red with corresponding measurement error bars. The
record is completed in orange with the 10 Be measurements from the same sediment profile for the late glacial–Holocene transition (Czymzik
et al., 2016). The MFM 10 Be data are plotted on the original MFM2012 chronology. The 10 Be flux data from the GRIP ice core in central
Greenland (Adolphi et al., 2014) are plotted in blue and on the GICC05 timescale (Rasmussen et al., 2006; Vinther et al., 2006; Svensson et
al., 2008; Seierstad et al., 2014). All records have been normalized to their mean.
use one record (for example 14 C production rate) as our “cal- is a decrease in the intensity of the heliomagnetic field (solar
ibration curve”, while the other record serves as our “tree activity), leading to an increased impingement of Earth by
rings” (e.g., MFM and GRIP 10 Be). By shifting one relative galactic cosmic rays and thus an increased atmospheric pro-
to the other, we can thus estimate a probability density func- duction rate of 10 Be and 14 C nuclides. It was also shown that
tion of the timescale difference between the two records. Fur- meteorological and catchment influences on 10 Be deposition
ther details can be found in Adolphi and Muscheler (2016) are likely small at MFM (Czymzik et al., 2016). The high res-
and Bronk Ramsey et al. (2001). For these calculations, we olution of our 10 Be measurements allows us to observe finer
linearly detrend all radionuclide records between 11 800 and structures within this period of increased 10 Be concentra-
11 000 years BP and assume a production rate uncertainty tion. One example is the double peak structure at 11 200 and
of 20 % for all records, which corresponds to the root mean 11 040 years BP, which is also present in 14 C atmospheric
square error between the records after synchronization. production rate data (Muscheler et al., 2014; Fig. 2) but not
expressed well in the GRIP 10 Be data. Finally, it is of impor-
tance to note that although the increased production around
3 Results 11 150 years BP is observed in all these radionuclide records,
there is an apparent chronological offset at its onset around
3.1 Meerfelder Maar 10 Be concentrations 11 300 years BP (Fig. 1). More specifically, the 10 Be flux
The new 10 Be concentration measurements from MFM are data from GRIP begin to increase around 11 320 years BP,
displayed in Fig. 1 alongside 10 Be flux data from the GRIP whereas a similar increase is seen in the 10 Be concentration
ice core in central Greenland (Finkel and Nishiizumi, 1997; from MFM around 100 years later, although some short-term
Muscheler et al., 2004; Adolphi et al., 2014) and older 10 Be features are not visible in all records such as a 40-year-long
concentration data from MFM for the late glacial–Holocene trough in the MFM 10 Be data (ca. 11 290–11 250 years BP).
transition (Czymzik et al., 2016). Each dataset is plotted
on its original timescale, which is the MFM2012 chronol- 3.2 Timescale synchronization
ogy (Brauer et al., 2000; Martin-Puertas et al., 2012a) and
the GICC05 chronology (Rasmussen et al., 2006; Vinther et The Greenland ice core timescale is characterized by an ac-
al., 2006; Svensson et al., 2008; Seierstad et al., 2014). The cumulating layer counting uncertainty back in time (Ras-
most striking feature of these datasets is the approximately mussen et al., 2006) as are chronologies based on sedi-
250-year-long period of increased 10 Be concentration around ment varve counting such as MFM. In comparison, tree
11 150 years BP. The most likely explanation for this increase ring chronologies, underlying the 14 C calibration record,
https://doi.org/10.5194/cp-16-1145-2020 Clim. Past, 16, 1145–1157, 2020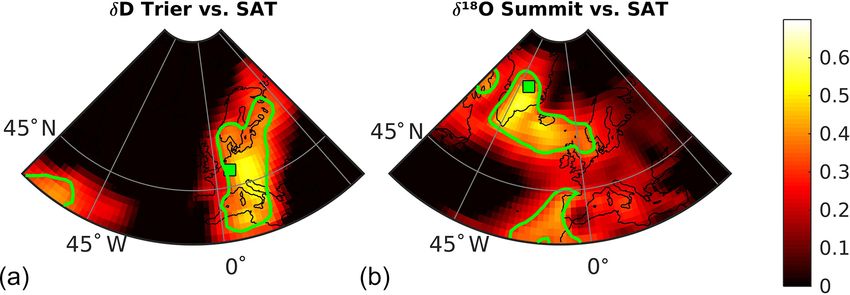
1148                                  F. Mekhaldi et al.: Radionuclide wiggle matching of early Holocene climate oscillations

Figure 2. Results from the Bayesian wiggle matching of the different radionuclide records. Panel (a) shows both the MFM 10 Be data (in
red) and the GRIP 10 Be data (blue) once synchronized to the 14 C production rate data inferred from the IntCal13 calibration curve (1σ
gray envelope). Panel (b) displays the probability density functions for the best fit between IntCal13 and MFM2012 (in red), IntCal13 and
GICC05 (in blue), and GICC05 and MFM2012 (in magenta), which resulted in the synchronization in panel (a) with a 95.4 % confidence
interval illustrated by the horizontal error bars.

are considered accurate with virtually no dating uncertainty           compare GICC05 and MFM2012 when synchronized with
for the Holocene period (Reimer et al., 2013). Consider-               IntCal13 as it is the more robust timescale, and then consider
ing the different timescale uncertainties, it is challenging           the combined chronology offset of 98 (+33/ − 21) years.
to compare the timing of short-lived climate oscillations              Another uncertainty from these estimates arises from the in-
such as the PBO/11.4 ka event. Here we use the global                  fluence of climate on the cosmogenic signal of all radionu-
signature common to all cosmogenic radionuclide records                clides (Adolphi et al., 2014; Muscheler et al., 2008; Pedro et
as a synchronization tool (Muscheler et al., 2008, 2014).              al., 2012). For instance, 14 C oxidizes to form 14 CO2 and en-
More specifically, we use the large fluctuations in both the           ter the carbon cycle, while 10 Be readily attaches to aerosols
MFM and GRIP 10 Be data to synchronize these records                   and is thus influenced by precipitation. Even though 10 Be
with the chronologically more accurate and precise Int-                deposition is not expected to have strong environmental in-
Cal13 timescale (Czymzik et al., 2018). It was previously              fluences at MFM (Czymzik et al., 2016), this was taken into
shown that GICC05 increasingly overestimates age during                account within the 20 % uncertainty since these effects are
the Holocene compared to IntCal13 (Muscheler et al., 2014)             difficult to quantify objectively.
and that this timescale difference is estimated to increase to
67 (±6) years at 11 000 years BP (Adolphi and Muscheler,
2016). We use the same Bayesian wiggle matching approach               3.3   Anomalies in paleoclimate proxies between 11 450
as in Adolphi and Muscheler (2016) but here for the period                   and 11 000 years BP
11 800–11 000 years BP to synchronize both the MFM sedi-
                                                                       If we correct the GICC05 and MFM2012 timescales for
ment and Greenland ice core records with IntCal13.
                                                                       their respective offsets to IntCal13, we can compare early
   Figure 2 shows both the ice core and sediment core 10 Be
                                                                       Holocene climate in Greenland to data from MFM with a
data once synchronized with the IntCal13 timescale using
                                                                       high chronological precision. Figure 3 displays a selection
the 14 C production rate from Muscheler et al. (2014), with
                                                                       of climatic proxy data from both Greenland ice cores and
the corresponding probability density functions displayed in
                                                                       the varved MFM record on the IntCal13 timescale as per
panel (b). We find that the MFM 10 Be data fit best with 14 C
                                                                       Fig. 2. In addition, both 14 C atmospheric production rate
by adding 20 years to MFM2012 (+6/ − 19 years uncer-
                                                                       and GRIP 10 Be flux data are shown as a general indicator of
tainty with a 95.4 % confidence interval), whereas the GRIP
10 Be data fit best with 14 C by shifting GICC05 78 years to-          changes in solar activity (Fig. 3a). The stack of δ 18 O anoma-
                                                                       lies from four Greenland ice cores (DYE-3, GRIP, NGRIP,
wards the present (+32/ − 8 years uncertainty with a 95.4 %
                                                                       and Renland; Fig. 3b) can be related to surface air temper-
likelihood interval). When comparing GICC05 directly to
                                                                       ature around Greenland (Rasmussen et al., 2007; Vinther et
MFM2012, we find that the best fit occurs by shifting
                                                                       al., 2009) and shows one negative fluctuation between 11 400
GICC05 72 years towards MFM2012 (+4/ − 8 years with
                                                                       and 11 250 years BP. Following this oscillation, the Green-
a 95.4 % likelihood interval). There is thus a difference of
                                                                       land δ 18 O anomaly record remains largely constant and pos-
26 years (72 +4/−8 years versus 98 +33/−21 years) when
                                                                       itive. In addition, we also use the accumulation rate anomaly
comparing GICC05 and MFM2012 directly rather than syn-
                                                                       stack (Fig. 3c) from the DYE-3, GRIP, and NGRIP ice cores
chronizing them with IntCal13 first, which illustrates the un-
                                                                       (Rasmussen et al., 2007) to illustrate changes in snow accu-
certainties inherent to this exercise. In the following, we will
                                                                       mulation rates over Greenland. Here again, a negative fluctu-

Clim. Past, 16, 1145–1157, 2020                                                           https://doi.org/10.5194/cp-16-1145-2020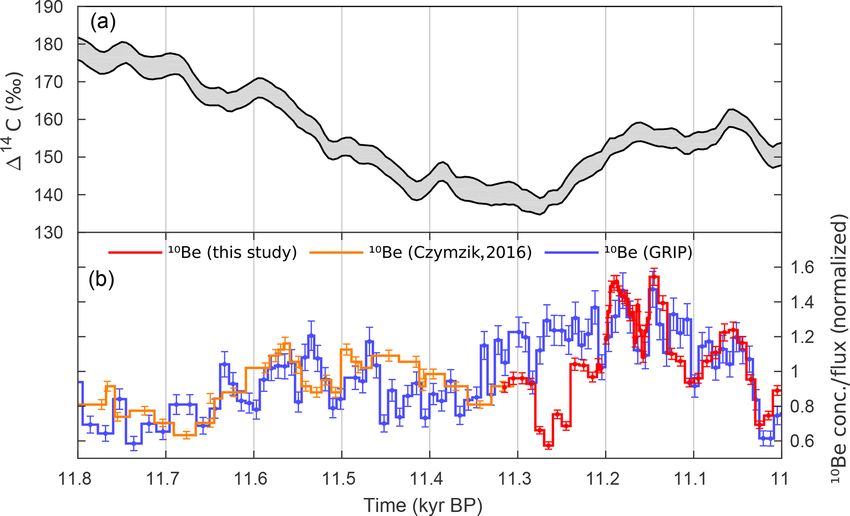
F. Mekhaldi et al.: Radionuclide wiggle matching of early Holocene climate oscillations                                             1149

ation is observed between 11 400 and 11 250 years BP. Then,
we make use of the MFM δD records of n-alkanes (Fig. 3d)
that have been interpreted as being a proxy for precipita-
tion δD (Rach et al., 2014) which, similar to δ 18 O in Green-
land, can thus be regarded as indicative of distance from and
temperature and/or humidity at the moisture source (Dans-
gaard, 1964), as well as fractionation related to air temper-
ature. In contrast to the Greenland stack, the δD data show
no fluctuations between 11 400 and 11 250 years BP with
δDaq remaining constant and δDterr showing an increasing
trend. Then at 11 250 years BP, both δD series depict a 20 %
drop that persists until 11 100 years BP. To test the spatial
scale of which the δD record from MFM can be represen-
tative, we have investigated the spatial relationship between
surface air temperature (SAT) in the NOAA–CIRES 20th cli-
mate reanalysis V2c (20CR; Compo et al., 2011) and δD in
precipitation at the Trier meteorological station (about 50 km
SW of MFM). It can be seen in Fig. 4 that there is a sig-
nificant relationship (p < 0.1) between annual precipitation
δD from the Trier station (IAEA/WMO, 2006) and annual
SAT over most of western Europe. In addition, Fig. 4 also
points to a relationship between annual SATs over Greenland
and Iceland and annual δ 18 O at Summit (central Greenland)
(Steig et al., 1994; White et al., 2009). Finally, we also show
varve thickness changes at MFM that were primarily con-
trolled by runoff from the catchment. After a period of low
varve thickness, a sharp increase occurred at 11 250 years
BP followed by a gradual decrease and a second but very
small increase around 11 080 years BP. Titanium-centered
log ratio data (Ticlr ), determined by micro X-ray fluorescence
(µ-XRF) from the same MFM sediment composite profile
(Martin-Puertas et al., 2017), confirm the interpretation that
the variance in varve thickness at the time was mostly con-         Figure 3. (a) 14 C production rate (orange envelope) and GRIP 10 Be
trolled by detrital supply to the lake (Fig. 3e). It is important   data (blue) on a reversed y axis to indicate variations in solar activ-
to mention that in a longer time perspective, the changes de-       ity. (b) The δ 18 O stack from the DYE-3, GRIP, NGRIP, and Renland
scribed above in the sediments of MFM (Martin-Puertas et            ice cores (Rasmussen et al., 2007; Vinther et al., 2009) is shown in
al., 2017; Rach et al., 2014) do not exceed other fluctuations      magenta, and (c) the modeled accumulation anomalies from Ras-
in varve thickness and Ticlr .                                      mussen et al. (2007) for DYE-3, GRIP, and NGRIP are shown in
                                                                    red. (d) The δD data record from lipid biomarkers of MFM sedi-
                                                                    ments (Rach et al., 2014) is plotted in blue and green (aquatic and
4     Discussion                                                    terrestrial), while (e) varve thickness (Martin-Puertas et al., 2012a)
                                                                    and varve µ-XRF Ticlr (Martin-Puertas et al., 2017) are plotted in
4.1    Timing and interpretation of anomalies between               brown and black, respectively. The gray bands depict the time of
       11 450 and 11 000 years BP                                   occurrence of the 11.4 ka event in Greenland and of the cold os-
                                                                    cillation inferred from the MFM sediments (MFM oscillation). All
In Greenland, a cold and dry climate episode occurred around        data are plotted on the IntCal13 timescale as per Fig. 2.
11 400–11 250 years BP known as the 11.4 ka event (Ras-
mussen et al., 2007). This is evidenced by a significant drop
in the signal of the Greenland ice core δ 18 O stack, as well as
in the accumulation stack (Fig. 3b, c). By shifting GICC05          (Fig. 3d, e), we do not find any event that is coeval with the
78 years towards the present, the central part of the 11.4 ka       11.4 ka event in Greenland. Interestingly though, Ticlr data
event (lowest value in δ 18 O) is dated to around 11 372–           (Fig. 3e) gradually decreased from ca. 11 490 years BP only
11 272 (+32/−8) years BP, which is consistent with GICC05           to be interrupted by a small increase around 11 300 years
within the combined uncertainty of our synchronization and          BP. The low Ticlr data suggest less runoff probably related
the maximum counting error in GICC05. When looking at               to drier conditions, which shows some commonality with the
the temperature proxy and varve thickness data from MFM             conditions in Greenland at that time (11.4 oscillation) evi-

https://doi.org/10.5194/cp-16-1145-2020                                                           Clim. Past, 16, 1145–1157, 2020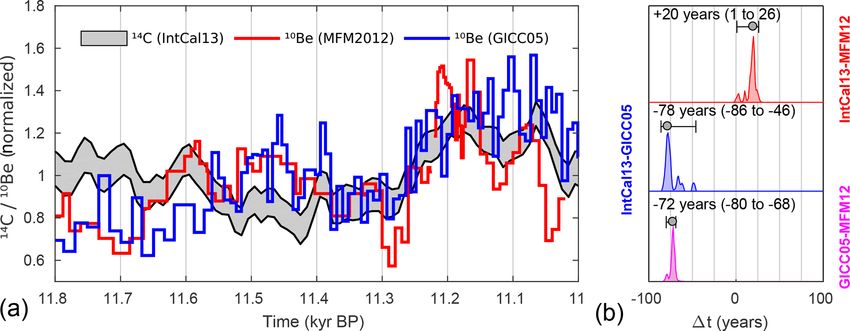
1150                                 F. Mekhaldi et al.: Radionuclide wiggle matching of early Holocene climate oscillations

denced by the lower accumulation rate. Therefore, a pos-
sible link to the dry Rammelbeek Phase described in the
Borchert peat sequence in the Netherlands (van der Plicht
et al., 2004; Bos et al., 2007) may be tentatively put forward,
although chronological uncertainties hinder proving this. We
can now also confidently deduce that the termination of the
δ 18 O and accumulation anomalies in Greenland (the 11.4 ka
event) is synchronous with a large decrease in solar activ-
ity (Fig. 3a–c). More specifically, high levels of solar activ-    Figure 4. (a) Correlation map between annual δD in precipitation
ity prevailed throughout the occurrence of the 11.4 ka event       from the Trier station (green square; IAEA/WMO, 2016) and an-
in Greenland. Then, as solar activity started to decrease (ca.     nual surface air temperatures in the NOAA–CIRES 20th climate re-
11 250 years BP) into a grand solar minimum that lasted for        analysis V2c (Compo et al., 2011) for the period 1978–2011 CE.
around 250 years, the climate in Greenland switched back to        (b) Same as (a) but for δ 18 O from the GISP2 ice core (green
                                                                   square; Steig et al., 1994; White et al., 2009) and for the period
warmer and wetter conditions with higher δ 18 O values and
                                                                   1950–1986 CE. Green contour lines represent significance levels for
a higher accumulation rate. This is in accordance with the         p < 0.1 (t test). The difference in years selected arises from the dif-
suggestion of an abrupt warming (4◦ ± 1.5◦ ) in Greenland          ferent time span of the δD and δ 18 O records used here.
following the event based on δ 15 N in the GIPS2 ice core
(Kobashi et al., 2008). The rapid transition towards positive
accumulation anomalies occurred over a few decades only.
   While climate over Greenland following the 11.4 ka event        MFM was likely influenced by the substantial changes in
returned rapidly to warmer and wetter conditions, all proxies      solar activity that characterized this period rather than 10 Be
from MFM sediments (Fig. 3d, e) show fluctuations around           concentration at MFM being affected by this sediment com-
11 250 years BP (henceforth MFM oscillation). In particular,       positional change. In support of this assumption, Czymzik
aquatic δD data from small-chain alkanes (Rach et al., 2014)       et al. (2016) also reported negligible climate influences on
show a clear oscillation with a 20 % drop around 11 250 years      10 Be deposition at MFM even across distinct climatological

BP (Fig. 3d), while terrestrial δD data show a decrease reach-     boundaries. It can also be seen that the second and smaller in-
ing levels seen around 11 500 years BP. This deuterium de-         crease in varve thickness and Ticlr is coeval with a second dip
pletion in the alkanes most likely mirrors a depletion of deu-     in solar activity shortly after 11 100 years BP (Fig. 3a and e).
terium in precipitation which can be explained, in part, by        Finally, it is worthwhile to note that the percentage values of
lower air temperatures over western Europe in view of Fig. 4.      Pinus pollen and biogenic silica, as well as pollen concentra-
Simultaneously, varve thickness and Ticlr show a rapid in-         tions in MFM, all decreased at 11 250–11 230 years BP while
crease at 11 250 years BP (Fig. 3e), denoting a likely in-         percentage values of Betula increased (Brauer et al., 1999).
creasing detrital contribution to this varve thickening. When      Although not interpreted by the authors, these changes echo
considered in a longer time perspective (Martin-Puertas et         the findings of Björck et al. (1997), who defined the PBO
al., 2017), this varve increase reaches the level of other fluc-   in terrestrial records of Sweden with a similar decrease in
tuations that are unrelated to known early Holocene oscil-         pollen concentrations and more notably of Pinus pollen per-
lations in North Atlantic climate. Nevertheless, this shift at     centages, interpreted as a setback of tree vegetation in south-
11 250 year BP does correspond to a change in the composi-         ern Sweden. It should be stressed here that we cannot directly
tion of the sediments as Martin-Puertas et al. (2017) defined      compare the palynology of MFM to these Swedish lakes be-
a compositional boundary of MFM varves at 11 230 years             cause of the challenging interpretation of the former record,
BP (11 250 years BP on the IntCal13 timescale) based on            as well as the chronological uncertainties and the vicinity
µ-XRF scanning analyzed with Ward’s clustering methods.            to the retreating Fennoscandian Ice Sheet (FIS) of the later
By synchronizing MFM2012 with IntCal13 (Fig. 2), we find           records.
that this compositional boundary is also coeval with the on-          In summary, the radionuclide-based synchronization of
set of the grand solar minimum (Fig. 3), although the cause        the GICC05 and MFM2012 timescales indicates a combined
of this change is difficult to assess. In fact, Ticlr , as well    timing offset of up to 98 (+33/−21) years during the earliest
as ln(Si/Ti) and ln(Ca/Ti), which is generally regarded by         part of the Holocene. Correcting for this offset, we observe
Martin-Puertas et al. (2017) as indicating relative changes        that cold oscillations at both locations and inferred from wa-
in biogenic silica concentrations and authigenic calcite pre-      ter isotopes did not occur simultaneously between 11 450 and
cipitation, is significantly correlated with the new 10 Be con-    11 000 years BP. We further note that this pattern appears to
centration measurements and also with the GRIP 10 Be data          be coupled with large changes in solar activity, which leads
and with the 14 C atmospheric production rate (Figs. 5 and S1      us to suggest a causal link. More specifically, the cold and dry
in the Supplement). Because GRIP 10 Be data and the 14 C           climate oscillation in Greenland (the 11.4 ka event) occurred
atmospheric production rate are unaffected by environmen-          under a period of high solar activity between ca. 11 370 and
tal changes at MFM, we suggest that the catchment area of          11 270 years BP but did not leave a discernable imprint in

Clim. Past, 16, 1145–1157, 2020                                                         https://doi.org/10.5194/cp-16-1145-2020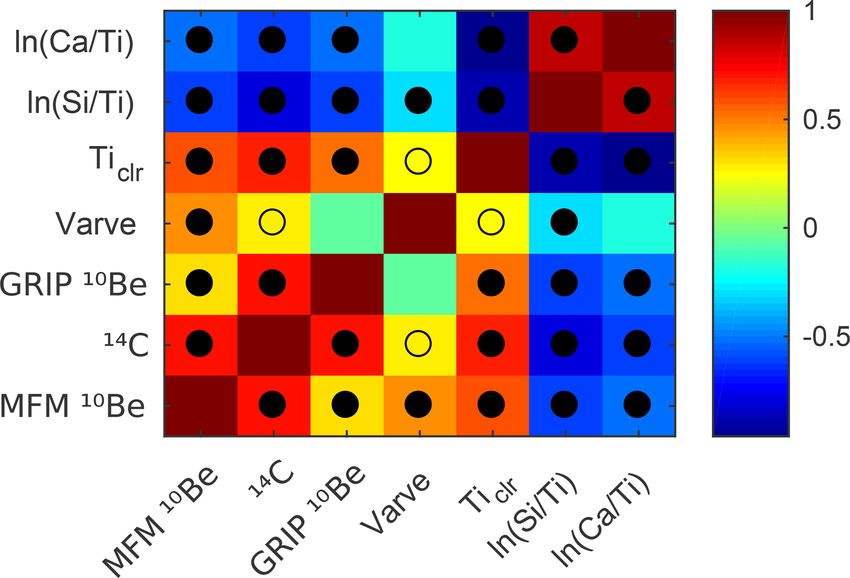
F. Mekhaldi et al.: Radionuclide wiggle matching of early Holocene climate oscillations                                           1151

                                                                        tion (Haigh et al., 2010), especially at the Equator. This in-
                                                                        creases the stratospheric temperature gradient between the
                                                                        Equator and poles (Simpson et al., 2009), leading to an ac-
                                                                        celeration of the polar night jet (Kodera et al., 2002), which
                                                                        eventually propagates down to the troposphere via wave re-
                                                                        fraction (Matthes et al., 2006; Ineson et al., 2011). In turn,
                                                                        this leads to patterns in surface pressure and temperature
                                                                        which mimic those of the positive phase of the North Atlantic
                                                                        Oscillation (NAO) in winter (Woollings et al., 2010; Ineson
                                                                        et al., 2011). The opposite mode applies during periods of
                                                                        solar minima. It should, however, be stressed that there is no
                                                                        consistent correlation between the North Atlantic Oscillation
                                                                        and solar forcing for the past centuries (Gray et al., 2013;
                                                                        Ortega et al., 2015), although a solar influence on the re-
Figure 5. Color-coded correlation matrix between MFM 10 Be con-
                                                                        gion is not necessarily related to the NAO (Moffa-Sánchez
centration, GRIP 10 Be flux, 14 C production rate data, varve thick-    et al., 2014; Sjolte et al., 2018). Even though the spatial pat-
ness, and µ-XRF data from MFM09 (Martin-Puertas et al., 2017).          tern we observe agrees well with a top-down solar forcing,
Open and filled circles denote significant correlations with the p <    other mechanisms cannot be excluded as lying behind the
0.1 and the p < 0.05 levels, respectively. All data were binned after   different North Atlantic response patterns. Overall, it has to
the resolution of the MFM 10 Be concentration data for the period       be kept in mind that different time periods with different cli-
11 310–11 000 years BP, and the Student t test was performed to         mate boundary conditions could lead to shifting atmospheric
test the significance levels.                                           patterns.
                                                                           In the following we explore the solar hypothesis further by
                                                                        investigating a modern analog with climate reanalysis data.
either varve thickness or biomarker δD from MFM. Sub-                   Figure 6a shows the surface air temperature (SAT) anoma-
sequently, solar activity dropped to a grand minimum that               lies in the North Atlantic region for periods of solar maxima
lasted for as long as 250 years. This change was coeval with            compared to periods of solar minima in 20CR (mean ± 1σ
the termination of the 11.4 ka event (Greenland) and the on-            of the sunspot group numbers from Svalgaard and Schatten,
set of the MFM oscillation with colder conditions inferred              2016, between 1946 and 2011 CE; see Fig. S2). It can be
from δD data (Figs. 3d and 4). The ostensible link with so-             seen from the SAT anomalies that a distinct antiphase pat-
lar activity which we infer in view of Fig. 3 resembles what            tern between Greenland and Europe is coincident with highs
has been described substantially in the recent literature and           and lows in solar activity. That is to say that Greenland ex-
is discussed in the following section.                                  periences lower SATs during winters of solar maxima com-
                                                                        pared to winters of solar minima, whereas lower SATs are
4.2   Solar forcing during 11 450–11 000 years BP                       observed across Europe for winters of solar minima com-
                                                                        pared to winters of solar maxima. This highlights the cor-
Our suggestion of a causal sun–climate link during the ear-             respondence between the solar influence on North Atlantic
liest part of the Holocene can be further supported by the              climate, which has been proposed to have been active during
spatial patterns of the 11.4 ka event in Greenland followed             the 20th century, and the synchronized climate proxy records
by a cold period at MFM starting at 11 250 years BP (MFM                during the early Holocene in terms of spatial distribution of
oscillation). Based on our synchronization of the different             SAT anomalies. Furthermore, this correspondence can also
paleoclimate records, we find an asynchronous relationship              be qualitatively described by comparing the mean annual
between the Greenland and European climates, characterized              temperature anomalies at both Summit (central Greenland)
by cold and dry conditions over Greenland but with no evi-              and MFM (Fig. 6c, d) through an average of all 11-year so-
dence of it at MFM under high solar activity and a warm                 lar cycles of the 20th century (Fig. 6b). Decadal tempera-
and wetter Greenland climate, as well as colder conditions at           ture changes in 20CR at both Summit (blue curve in Fig. 6c)
MFM for low solar activity (Fig. 3).                                    and MFM (red curve in Fig. 6d) agree qualitatively well with
   This pattern is consistent with a number of, but not all,            centennial δ 18 O and δD changes observed in Greenland ice
climate modeling studies that find a top-down influence of              cores and in MFM sediments during the period ranging from
solar activity on North Atlantic and European atmospheric               11 450 to 11 000 years BP (black curves in Fig. 6c, d; note
circulation patterns. This forcing mechanism involves the in-           the different time axes). Of specific interest here is the av-
crease in UV radiation during solar maximum years (Haigh                erage transition from high to low solar activity that is coin-
et al., 2010; Lockwood et al., 2010), which enhances the                cident with an annual temperature rise or drop of ca. 1 K at
production of stratospheric ozone and leads to stratospheric            Summit and/or MFM. Assuming changes in water isotopes to
heating through the increased absorption of longwave radia-             be, in part, indicative of regional temperature changes (Dans-

https://doi.org/10.5194/cp-16-1145-2020                                                            Clim. Past, 16, 1145–1157, 2020
1152 F. Mekhaldi et al.: Radionuclide wiggle matching of early Holocene climate oscillations
gaard, 1964; Masson-Delmotte et al., 2005; Rach et al., 2014; known from sunspot observations (Svalgaard and Schatten,
Fig. 4), this decadal pattern between Summit and MFM in 2016) and is called the Maunder Minimum (1645–1715 CE).
climate reanalysis data mimics the centennial-scale climate
changes that prevailed in Greenland and Europe throughout 4.3 Solar–ocean coupling
the period 11 450–11 000 years BP. Water isotopes are often
dominated by a particular seasonal signal. It is therefore of The PBO has also been associated with an increase in fresh-
interest to note that the spatial patterns observed in climate water supply hampering the Atlantic meridional overturn-
reanalysis are also present during the summer, although to a ing circulation (AMOC) possibly from the Baltic Ice Lake
lesser degree (Fig. 3). drainage and the rapidly waning Fennoscandian Ice Sheet
It should be noted that the efficiency of the top- (Björck et al., 1996; Hald and Hagen, 1998). It was next
down mechanism remains largely unexplored for centennial proposed by Fisher et al. (2002) that an outburst of Lake
timescales. For instance, previous studies have proposed a Agassiz could represent the trigger of the PBO through an
top-down solar influence on atmospheric circulation on sim- increased thickness and extent of Arctic Ocean sea-ice pack.
ilar timescales for both Greenland (Adolphi et al., 2014) and This would have resulted in an increased albedo and a slow-
MFM (Martin-Puertas et al., 2012b), leading to a similar spa- down of North Atlantic Deep Water (NADW) formation due
tial pattern in reanalysis data. The modeling results in these to increased freshwater delivery to the North Atlantic. How-
studies, however, only investigate the effect of decadal (11- ever, the timing of the outburst event to which they attribute
year) changes in solar activity. In contrast, it was also shown the PBO (11 335 years cal BP) has rather large uncertainties
more recently that the centennial response of North Atlantic (±130 to 230 years) due to the 114 C age plateau in this pe-
atmospheric circulation to solar forcing is correlated with the riod. More recently, it was suggested that even small changes
second mode of atmospheric circulation, the East Atlantic in the prevalence of the AMOC can influence atmospheric
pattern, rather than to the first mode, the NAO (Sjolte et circulation with couplings to the NAO, with an intensifica-
al., 2018). The latter study consequently does not find a simi- tion of the former resulting in a negative index of the latter
lar pattern in SAT anomalies between Greenland and western (Frankignoul et al., 2013).
Europe. To further investigate the potential spatial distribution of
For the same reasons, another uncertainty arises from the SAT anomalies due to a slowdown of the AMOC, we again
relevance of using 20th century climate reanalysis as an anal- investigate 20CR for winters with a negative reconstructed
ogy of early Holocene conditions. In particular, the Lauren- AMOC index (Duchez et al., 2014) compared to winters with
tide Ice Sheet (LIS) is known to have played an important a positive reconstructed AMOC index for the period 1961–
role in the position of the North Atlantic eddy-driven jet by 2005 CE (Fig. 7a). Interestingly, SAT anomalies similar to
accelerating and displacing it southward (Merz et al., 2015). those for solar forcing subside. That is to say that an am-
However, it is also known that the LIS waned to the point plified meridional temperature gradient with a colder Green-
of separation with the Cordilleran at around 14 000 years land and a warmer western Europe is favored in winters in
BP (Dyke, 2004). According to a study based on a tran- which the AMOC is weaker relative to winters in which
sient climate simulation from the Last Glacial Maximum it is stronger. Although it is difficult to obtain direct evi-
(LGM) (Löfverström and Lora, 2017), this separation led to dence of an AMOC slowdown during the early Holocene,
a shift in the dominant topographic stationary wave source it is conceivable that the waning Fennoscandian Ice Sheet
in North America. This, in turn, induced a transition from would have routinely released enough freshwater to weaken
a strong and subtropical jet stream to a weaker and more and condition the AMOC for the onset of the 11.4 ka event
meridionally tilted jet stream and storm track as observed in Greenland. This result could also be explained by the in-
for present conditions. This suggests that similar atmospheric fluence of the NAO on the AMOC index as it is difficult
processes could have been at play during the earliest part of to disentangle these tightly coupled processes (McCarthy et
the Holocene, relative to today, in spite of different bound- al., 2015). In this case, the persistent high levels of solar ac-
ary conditions. Furthermore, the results in Fig. 6 arise from tivity, which can also favor such temperature and pressure
an 11-year solar cycle forcing which is considerably weaker patterns, could represent a potential trigger for these climate
and less persistent than the potential solar forcing that the oscillations. Figure 7b depicts the large temperature differ-
11 400 years BP solar maximum to 11 200 years BP grand ences for winters in which both high solar activity and a weak
solar minimum could have provoked, leading to possibly dif- AMOC prevailed during the period 1961–2005 CE with up to
ferent reactions due to feedback processes. In fact, both the a −4 K anomaly in western Greenland. This, however, needs
14 C data and GRIP 10 Be data shown in Fig. 2 depict one of to be treated with caution due to the relatively short period
the most prominent increases in the Holocene record (Von- of observation that results in having very few years when
moos et al., 2006) in terms of both amplitude and the dura- such solar activity and AMOC conditions existed in paral-
tion of the grand solar minimum. In comparison, its duration lel (Fig. 4).
represents twice the length of the longest grand minimum In addition, a coupling between solar and freshwater forc-
ing could also explain the lack of significant climate re-
Clim. Past, 16, 1145–1157, 2020 https://doi.org/10.5194/cp-16-1145-2020F. Mekhaldi et al.: Radionuclide wiggle matching of early Holocene climate oscillations 1153
Figure 6. The 11.4 ka event and MFM oscillation compared to the solar forcing of 20th century SATs in the North Atlantic region as seen in
20CR. (a) Surface air temperature (SAT) anomalies for solar maximum winters (DJF) compared to solar minimum winters (see Fig. S2) for
the period 1946–2011 CE in 20th century climate reanalysis (Compo et al., 2011). The green squares point to the location of Summit and of
MFM, while the green contour lines represent significance levels for p < 0.1 (t test). Years influenced by large tropical volcanic eruptions
have been removed as per Ineson et al. (2011). (b) The transition between high to low solar activity in the 14 C production rate data (gray
envelope, top and right axes) compared to the mean sunspot group number of all 11-year solar cycles between 1900 and 2011 CE (orange
curve, bottom and left axes). (c) The δ 18 O stack (black curve, top and right axes) shown in Fig. 3b compared to the mean SAT at Summit
(blue curve, bottom and left axes) throughout all 11-year solar cycles between 1900 and 2011 CE as in (b). (d) Same as (c) but with δD (black
curve, top and right axes) and MFM SAT (red curve, bottom and left axes). Note the different timescale on the top (paleoclimate records) and
bottom (reanalysis data) axes. The gray bands show the periods of low solar activity occurring in the two time periods that are compared.
Figure 7. (a) Winter (DJF) surface air temperature anomalies for negative AMOC years compared to positive AMOC years for the period
1961–2005 CE in 20th century climate reanalysis (see Fig. S4). The green markers point to the location of Summit and of MFM, while the
green contour lines represent significance levels for p < 0.1 (t test). (b) Same as (a) but for years of both negative AMOC and high solar
activity.
sponses to subsequent grand solar minima which were also the FIS had completely vanished (Stroeven et al., 2016), did
large in amplitude but did not yield an unequivocal impact on not coincide with any evident climate oscillation in Green-
North Atlantic climate. It is indeed notable that the follow- land.
ing changes in solar activity occurred while the influence of
freshwater release by the FIS was diminishing, and therefore
the North Atlantic was not conditioned as it was during the 5 Conclusions
PBO. For instance, a similar but weaker event was found in
A comparison of new 10 Be concentration measurements
the δ 18 O signal of the GRIP ice core around 10 300 years cal
from the varved Meerfelder Maar sediments covering the pe-
BP, coinciding with a low in 114 C (high solar activity) and a
riod 11 310–11 000 years BP to the 10 Be data from the GRIP
cooling in the Faroe Islands (Björck et al., 2001). In contrast,
ice core in central Greenland showed a combined offset of up
the subsequent grand solar minimum which occurred around
to 98 (+33/−21) years between the MFM2012 and GICC05
9500 years BP (Vonmoos et al., 2006), at a time during which
chronologies. Correcting for this offset allowed us to deter-
https://doi.org/10.5194/cp-16-1145-2020 Clim. Past, 16, 1145–1157, 20201154 F. Mekhaldi et al.: Radionuclide wiggle matching of early Holocene climate oscillations
mine that the 11.4 ka event in Greenland has no coeval coun- Financial support. This research has been supported by the
terparts in Meerfelder Maar and that it coincides with high Royal Physiographic Society of Lund (application no. 36278 to
solar activity. The timescale synchronization also showed Florian Mekhaldi) and the Swedish Research Council (grant no.
that an environmental shift at MFM starting at 11 250 years DNR2013-8421 to Raimund Muscheler). Markus Czymzik was
BP is coincident with a transition from high solar activity to funded by a grant from the German Research Foundation (DFG)
(grant no. CZ 227/4-1) and the BaltRap network of the Leibniz As-
a particularly long-lasting grand solar minimum, as well as
sociation (SAW-2017-IOW2). Florian Adolphi was supported by
with the termination of the 11.4 ka event in Greenland. The the Swedish Research Council (grant no. DNR2016-00218). Ala
termination and onset of these cold oscillations in Green- Aldahan thanks the UAEU for the support through the UPAR fund-
land and then Meerfelder Maar are thus synchronous with ing.
large changes in solar activity, which is a pattern reproduced
by a number of modeling studies. Finally, we also postulate
that a slowdown of the AMOC due to freshwater delivery Review statement. This paper was edited by Hans Linderholm
from, for instance, the Fennoscandian Ice Sheet could have and reviewed by three anonymous referees.
served as a potential amplifier to this signal. The extent of
the role that solar activity changes may have played in the
climate of Greenland and Europe during the earliest part of
the Holocene is unclear. This is due to the different boundary References
conditions which prevailed at the time compared to today but
also due to the proxy evidence from MFM which is difficult Adolphi, F. and Muscheler, R.: Synchronizing the Greenland ice
to interpret. The main results from this study do, however, ex- core and radiocarbon timescales over the Holocene – Bayesian
emplify the usefulness of cosmogenic radionuclides in syn- wiggle-matching of cosmogenic radionuclide records, Clim.
chronizing different paleoclimate records when investigating Past, 12, 15–30, https://doi.org/10.5194/cp-12-15-2016, 2016.
the timing and spatial distribution of past climate fluctuations Adolphi, F., Muscheler, R., Svensson, A., Aldahan, A., Possnert,
with a high chronological precision. G., Beer, J., Sjolte, J., Björck, S., Matthes, K., and Thiéblemont,
R.: Persistent link between solar activity and Greenland climate
during the Last Glacial Maximum, Nat. Geosci., 7, 662–666,
Data availability. The new 10 Be data from this study https://doi.org/10.1038/ngeo2225, 2014.
are available on the PANGAEA open-access data library Berggren, A.-M., Aldahan, A., Possnert, G., Haltia-Hovi, E.,
(https://doi.org/10.1594/PANGAEA.907808, Mekhaldi, 2019). and Saarinen, T.: 10 Be and solar activity cycles in varved
lake sediments, AD 1900–2006, J. Paleolimnol., 44, 559–569,
https://doi.org/10.1007/s10933-010-9437-1, 2010.
Bos, J. A. A., van Geel, B., van der Plicht, J., and
Supplement. The supplement related to this article is available
Bohncke, S. J. P.: Preboreal climate oscillations in Europe:
online at: https://doi.org/10.5194/cp-16-1145-2020-supplement.
Wiggle-match dating and synthesis of Dutch high-resolution
multi-proxy records, Quaternary Sci. Rev., 26, 1927–1950,
https://doi.org/10.1016/j.quascirev.2006.09.012, 2007.
Author contributions. FM performed the analysis in correspon- Björck, S., Kromer, B., Johnsen, S., Bennike, O., Hammar-
dence with RM, carried out the sampling with MC and CMP, and lund, D., Lemdahl, G., Possnert, G., Rasmussen, T. L.,
did the chemical preparation of the Meerfelder Maar 10 Be samples Wohlfarth, B., Hammer, C. U., and Spurk, M.: Syn-
with the help of AA, while GP performed the measurements. FM chronized Terrestrial-Atmospheric Deglacial Records
wrote the paper. RM, MC, and FM initiated the project. FA provided Around the North Atlantic, Science, 274, 1155–1160,
the Bayesian synchronization and participated in the interpretation https://doi.org/10.1126/science.274.5290.1155, 1996.
of the climate reanalysis with JS. SB, AB, MC, and CMP assisted Björck, S., Rundgren, M., Ingólfsson, Ó., and Fun-
with the interpretation of the proxy data. All authors were involved der, S.: The Preboreal oscillation around the Nordic
in editing the paper. Seas: terrestrial and lacustrine responses, J. Quaternary
Sci., 12, 455–465, https://doi.org/10.1002/(SICI)1099-
1417(199711/12)12:63.0.CO;2-S, 1997.
Competing interests. The authors declare that they have no con- Björck, S., Muscheler, R., Kromer, B., Andresen, C. S., Heine-
flict of interest. meier, J., Johnsen, S. J., Conley, D., Koç, N., Spurk, M., and
Veski, S.: High-resolution analyses of an early Holocene cli-
mate event may imply decreased solar forcing as an important
Acknowledgements. The authors would like to thank Inger climate trigger, Geology, 29, 1107, https://doi.org/10.1130/0091-
Påhlsson for her help with the chemical preparation of the sediment 7613(2001)0292.0.CO;2, 2001.
10 Be samples for AMS measurements. Brauer, A., Endres, C., Günter, C., Litt, T., Stebich, M., and Negen-
dank, J. F. W.: High resolution sediment and vegetation responses
to Younger Dryas climate change in varved lake sediments from
Meerfelder Maar, Germany, Quaternary Sci. Rev., 18, 321–329,
https://doi.org/10.1016/S0277-3791(98)00084-5, 1999.
Clim. Past, 16, 1145–1157, 2020 https://doi.org/10.5194/cp-16-1145-2020F. Mekhaldi et al.: Radionuclide wiggle matching of early Holocene climate oscillations 1155 Brauer, A., Endres, C., Zolitschka, B., and Negendank, J. F.: AMS Hald, M. and Hagen, S.: Early Preboreal cooling in radiocarbon and varve chronology from the annually laminated the Nordic seas region triggered by meltwater, Ge- sediment record of Lake Meerfelder Maar, Germany, Radiocar- ology, 26, 615–618, https://doi.org/10.1130/0091- bon, 42, 355–368, 2000. 7613(1998)0262.3.CO;2, 1998. Bronk Ramsey, C., van der Plicht, J., and Weninger, B.: “Wiggle Ineson, S., Scaife, A. A., Knight, J. R., Manners, J. C., Dunstone, matching” radiocarbon dates, Radiocarbon, 43, 381–390, 2001. N. J., Gray, L. J., and Haigh, J. D.: Solar forcing of winter cli- Compo, G. P., Whitaker, J. S., Sardeshmukh, P. D., Matsui, N., Al- mate variability in the Northern Hemisphere, Nat. Geosci., 4, lan, R. J., Yin, X., Gleason, B. E., Vose, R. S., Rutledge, G., 753–757, https://doi.org/10.1038/ngeo1282, 2011. Bessemoulin, P., Brönnimann, S., Brunet, M., Crouthamel, R. I., Kobashi, T., Severinghaus, J. P., and Barnola, J.-M.: 4 ± 1.5 ◦ C Grant, A. N., Groisman, P. Y., Jones, P. D., Kruk, M. C., Kruger, abrupt warming 11,270 yr ago identified from trapped air A. C., Marshall, G. J., Maugeri, M., Mok, H. Y., Nordli, Ø., Ross, in Greenland ice, Earth Planet. Sc. Lett., 268, 397–407, T. F., Trigo, R. M., Wang, X. L., Woodruff, S. D., and Worley, S. https://doi.org/10.1016/j.epsl.2008.01.032, 2008. J.: The Twentieth Century Reanalysis Project, Q. J. Roy. Meteor. Kodera, K.: Solar cycle modulation of the North At- Soc., 137, 1–28, https://doi.org/10.1002/qj.776, 2011. lantic Oscillation: Implication in the spatial struc- Czymzik, M., Adolphi, F., Muscheler, R., Mekhaldi, F., Martin- ture of the NAO, Geophys. Res. Lett., 29, 59-1–59-4, Puertas, C., Aldahan, A., Oran Possnert, G. Cand Brauer, A.: A https://doi.org/10.1029/2001GL014557, 2002. varved lake sediment record of the 10 Be solar activity proxy for Lane, C. S., Brauer, A., Martín-Puertas, C., Blockley, S. P. E., the Lateglacial-Holocene transition, Quaternary Sci. Rev., 153, Smith, V. C., and Tomlinson, E. L.: The Late Quaternary 31–39, https://doi.org/10.1016/j.quascirev.2016.10.007, 2016. tephrostratigraphy of annually laminated sediments from Meer- Czymzik, M., Muscheler, R., Adolphi, F., Mekhaldi, F., Dräger, felder Maar, Germany, Quaternary Sci. Rev., 122, 192–206, N., Ott, F., Słowinski, M., Błaszkiewicz, M., Aldahan, A., Poss- https://doi.org/10.1016/j.quascirev.2015.05.025, 2015. nert, G., and Brauer, A.: Synchronizing 10 Be in two varved lake Lockwood, M., Bell, C., Woollings, T., Harrison, R. G., Gray, L. sediment records to IntCal13 14 C during three grand solar min- J., and Haigh, J. D.: Top-down solar modulation of climate: evi- ima, Clim. Past, 14, 687–696, https://doi.org/10.5194/cp-14-687- dence for centennial-scale change, Environ. Res. Lett., 5, 34008, 2018, 2018. https://doi.org/10.1088/1748-9326/5/3/034008, 2010. Dansgaard, W.: Stable isotopes in precipitation, Tellus, 16, 436– Löfverström, M. and Lora, J. M.: Abrupt regime shifts 468, https://doi.org/10.3402/tellusa.v16i4.8993, 1964. in the North Atlantic atmospheric circulation over the Duchez, A., Hirschi, J. J.-M, Cunningham, S. A., Blaker, A. last deglaciation, Geophys. Res. Lett., 44, 8047–8055, T., Bryden, H. L., De Cuevas, B., Atkinson, C. P., Mc- https://doi.org/10.1002/2017GL074274, 2017. carthy, G. D., Frajka-Williams, E., Rayner, D., Smeed, D., and Magny, M., Vannière, B., de Beaulieu, J.-L., Bégeot, C., Mizielinski, M. S.: A new index for the Atlantic Meridional Heiri, O., Millet, L., Peyron, O., and Walter-Simonnet, Overturning Circulation at 26◦ N, J. Climate, 27, 6439–6455, A.-V.: Early-Holocene climatic oscillations recorded https://doi.org/10.1175/JCLI-D-13-00052.1, 2014. by lake-level fluctuations in west-central Europe and Dyke, A. S.: An outline of North American deglaciation with em- in central Italy, Quaternary Sci. Rev., 26, 1951–1964, phasis on central and northern Canada, Developments in Qua- https://doi.org/10.1016/j.quascirev.2006.04.013, 2007. ternary Sciences, 2, 373–424, https://doi.org/10.1016/S1571- Martin-Puertas, C., Brauer, A., Dulski, P., and Brademann, B.: 0866(04)80209-4, 2004. Testing climate-proxy stationarity throughout the Holocene: Finkel, R. C. and Nishiizumi, K.: Beryllium 10 concentrations in the an example from the varved sediments of Lake Meer- Greenland Ice Sheet Project 2 ice core from 3–40 ka, J. Geophys. felder Maar (Germany), Quaternary Sci. Rev., 58, 56–65, Res., 102, 26699–26706, https://doi.org/10.1029/97JC01282, https://doi.org/10.1016/j.quascirev.2012.10.023, 2012a. 1997. Martin-Puertas, C., Matthes, K., Brauer, A., Muscheler, R., Fisher, T. G., Smith, D. G., and Andrews, J. T.: Preboreal oscillation Hansen, F., Petrick, C., Aldahan, A., Possnert, G., and caused by a glacial Lake Agassiz flood, Quaternary Sci. Rev., van Geel, B.: Regional atmospheric circulation shifts in- 21, 873–878, https://doi.org/10.1016/S0277-3791(01)00148-2, duced by a grand solar minimum, Nat. Geosci., 5, 397–401, 2002. https://doi.org/10.1038/ngeo1460, 2012b. Frankignoul, C., Gastineau, G., and Kwon, Y. O.: The influ- Martin-Puertas, C., Tjallingii, R., Bloemsma, M., and Brauer, ence of the AMOC variability on the atmosphere in CCSM3, A.: Varved sediment responses to early Holocene climate and J. Climate, 26, 9774–9790, https://doi.org/10.1175/JCLI-D-12- environmental changes in Lake Meerfelder Maar (Germany) 00862.1, 2013. obtained from multivariate analyses of micro X-ray fluores- Gray, L. J., Scaife, A. A., Mitchell, D. M., Osprey, S., In- cence core scanning data, J. Quaternary Sci., 32, 427–436, eson, S., Hardiman, S., Butchart, N., Knight, J., Sutton, https://doi.org/10.1002/jqs.2935, 2017. R., and Kodera, K.: A lagged response to the 11 year so- Masson-Delmotte, V., Landais, A., Stievenard, M., Cattani, O., lar cycle in observed winter Atlantic/European weather Falourd, S., Jouzel, J., Johnsen, S. J., Dahl-Jensen, D., patterns, J. Geophys. Res.-Atmos., 118, 13405–13420, Sveinsbjornsdottir, A., White, J. W. C., Popp, T., and Fis- https://doi.org/10.1002/2013JD020062, 2013. cher, H.: Holocene climatic changes in Greenland: Differ- Haigh, J. D., Winning, A. R., Toumi, R., and Harder, J. W.: An influ- ent deuterium excess signals at Greenland Ice Core Project ence of solar spectral variations on radiative forcing of climate, (GRIP) and NorthGRIP, J. Geophys. Res., 110, D14102, Nature, 467, 696–699, https://doi.org/10.1038/nature09426, https://doi.org/10.1029/2004JD005575, 2005. 2010. https://doi.org/10.5194/cp-16-1145-2020 Clim. Past, 16, 1145–1157, 2020
1156                                     F. Mekhaldi et al.: Radionuclide wiggle matching of early Holocene climate oscillations

Matthes, K., Kuroda, Y., Kodera, K., and Langematz, U.: Trans-           Rasmussen, S. O., Bigler, M., Blockley, S. P., Blunier, T., Buchardt,
  fer of the solar signal from the stratosphere to the tro-                 S. L., Clausen, H. B., Cvijanovic, I., Dahl-Jensen, D., Johnsen, S.
  posphere: Northern winter, J. Geophys. Res., 111, D06108,                 J., Fischer, H., Gkinis, V., Guillevic, M., Hoek, W. Z., Lowe, J. J.,
  https://doi.org/10.1029/2005JD006283, 2006.                               Pedro, J. B., Popp, T., Seierstad, I. K., Steffensen, J. P., Svensson,
McCarthy, G. D., Haigh, I. D., Hirschi, J. J. M., Grist, J. P., and         A. M., Vallelonga, P., Vinther, B. M., Walker, M. J. C., Wheatley,
  Smeed, D. A.: Ocean impact on decadal Atlantic climate vari-              J. J., and Winstrup, M.: A stratigraphic framework for abrupt cli-
  ability revealed by sea-level observations, Nature, 521, 508–510,         matic changes during the Last Glacial period based on three syn-
  https://doi.org/10.1038/nature14491, 2015.                                chronized Greenland ice-core records: refining and extending the
Mekhaldi, F.: 10 Be concentrations from lake Meerfelder                     INTIMATE event stratigraphy, Quaternary Sci. Rev., 106, 14–28,
  Maar during the earliest part of the Holocene, PANGAEA,                   https://doi.org/10.1016/j.quascirev.2014.09.007, 2014.
  https://doi.org/10.1594/PANGAEA.907808, 2019.                          Reimer, P. J., Bard, E., Bayliss, A., Beck, J. W., Blackwell, P.
Merz, N., Raible, C. C., and Woollings, T.: North Atlantic                  G., Ramsey, C. B., Buck, C. E., Cheng, H., Edwards, R. L.,
  Eddy-Driven Jet in Interglacial and Glacial Winter Climates,              Friedrich, M., Grootes, P. M., Guilderson, T. P., Haflidason, H.,
  J. Climate, 28, 3977–3997, https://doi.org/10.1175/JCLI-D-14-             Hajdas, I., Hatté, C., Heaton, T. J., Hoffmann, D. L., Hogg,
  00525.1, 2015.                                                            A. G., Hughen, K. A., Kaiser, K. F., Kromer, B., Manning, S.
Moffa-Sánchez, P., Born, A., Hall, I. R., Thornalley, D. J. R., and         W., Niu, M., Reimer, R. W., Richards, D. A., Scott, E. M.,
  Barker, S.: Solar forcing of North Atlantic surface temperature           Southon, J. R., Staff, R. A., Turney, C. S. M., and van der
  and salinity over the past millennium, Nat. Geosci., 7, 275–278,          Plicht, J.: IntCal13 and Marine13 Radiocarbon Age Calibration
  https://doi.org/10.1038/ngeo2094, 2014.                                   Curves 0–50,000 Years cal BP, Radiocarbon, 55, 1869–1887,
Muscheler, R., Beer, J., Wagner, G., Laj, C., Kissel, C., Raisbeck,         https://doi.org/10.2458/azu_js_rc.55.16947, 2013.
  G. M., Yiou, F., and Kubik, P. W.: Changes in the carbon cycle         Seierstad, I. K., Abbott, P. M., Bigler, M., Blunier, T., Bourne, A.
  during the last deglaciation as indicated by the comparison of            J., Brook, E., Buchardt, S. L., Buizert, C., Clausen, H. B., Cook,
  10 Be and 14 C records, Earth Planet. Sci. Lett., 219, 325–340,           E., Dahl-Jensen, D., Davies, S. M., Guillevic, M., Johnsen, S. J.,
  https://doi.org/10.1016/S0012-821X(03)00722-2, 2004.                      Pedersen, D. S., Popp, T. J., Rasmussen, S. O., Severinghaus, J.
Muscheler, R., Kromer, B., Björck, S., Svensson, A., Friedrich, M.,         P., Svensson, A., and Vinther, B. M.: Consistently dated records
  Kaiser, K. F., and Southon, J.: Tree rings and ice cores reveal 14 C      from the Greenland GRIP, GISP2 and NGRIP ice cores for the
  calibration uncertainties during the Younger Dryas, Nat. Geosci.,         past 104 ka reveal regional millennial-scale δ 18 O gradients with
  1, 263–267, https://doi.org/10.1038/ngeo128, 2008.                        possible Heinrich event imprint, Quaternary Sci. Rev., 106, 29–
Muscheler, R., Adolphi, F., and Knudsen, M. F.: Assessing the               46, https://doi.org/10.1016/j.quascirev.2014.10.032, 2014.
  differences between the IntCal and Greenland ice-core time             Simpson, I. R., Blackburn, M., Haigh, J. D., Simpson, I. R.,
  scales for the last 14,000 years via the common cosmo-                    Blackburn, M., and Haigh, J. D.: The Role of Eddies
  genic radionuclide variations, Quaternary Sci. Rev., 106, 81–87,          in Driving the Tropospheric Response to Stratospheric
  https://doi.org/10.1016/j.quascirev.2014.08.017, 2014.                    Heating Perturbations, J. Atmos. Sci., 66, 1347–1365,
Ortega, P., Lehner, F., Swingedouw, D., Masson-Delmotte, V.,                https://doi.org/10.1175/2008jas2758.1, 2009.
  Raible, C. C., Casado, M., and Yiou, P.: A model-tested North          Sjolte, J., Sturm, C., Adolphi, F., Vinther, B. M., Werner, M.,
  Atlantic Oscillation reconstruction for the past millennium, Na-          Lohmann, G., and Muscheler, R.: Solar and volcanic forcing of
  ture, 523, 71–74, https://doi.org/10.1038/nature14518, 2015.              North Atlantic climate inferred from a process-based reconstruc-
Pedro, J. B., Mcconnell, J. R., Van Ommen, T. D., Fink, D.,                 tion, Clim. Past, 14, 1179–1194, https://doi.org/10.5194/cp-14-
  Curran, M. A. J., Smith, A. M., Simon, K. J., Moy, A. D.,                 1179-2018, 2018.
  and Das, S. B.: Solar and climate influences on ice core               Southon, J.: A First Step to Reconciling the GRIP and GISP2 Ice-
  10 Be records from Antarctica and Greenland during the neu-               Core Chronologies, 0–14,500 yr B.P., Quaternary Res., 57, 32–
  tron monitor era, Earth Planet. Sc. Lett., 355–356, 174–186,              37, https://doi.org/10.1006/qres.2001.2295, 2002.
  https://doi.org/10.1016/j.epsl.2012.08.038, 2012.                      Steig, E. J., Grootes, P. M., and Stuiver, M.: Seasonal Precipita-
Rach, O., Brauer, A., Wilkes, H., and Sachse, D.: Delayed hy-               tion Timing and Ice Core Records. Science, 266, 1885–1886,
  drological response to Greenland cooling at the onset of the              https://doi.org/10.1126/science.266.5192.1885, 1994.
  Younger Dryas in western Europe, Nat. Geosci., 7, 109–112,             Stroeven, A. P., Hättestrand, C., Kleman, J., Heyman, J., Fa-
  https://doi.org/10.1038/ngeo2053, 2014.                                   bel, D., Fredin, O., Goodfellow, B. W., Harbor, J. M., Jansen,
Rasmussen, S. O., Andersen, K. K., Svensson, A. M., Steffensen,             J. D., Olsen, L., Caffee, M. W., Fink, D., Lundqvist, J.,
  J. P., Vinther, B. M., Clausen, H. B., Siggaard-Andersen, M.-             Rosqvist, G. C., Strömberg, B., and Jansson, K. N.: Deglacia-
  L., Johnsen, S. J., Larsen, L. B., Dahl-Jensen, D., Bigler, M.,           tion of Fennoscandia, Quaternary Sci. Rev., 147, 91–121,
  Röthlisberger, R., Fischer, H., Goto-Azuma, K., Hansson, M.               https://doi.org/10.1016/j.quascirev.2015.09.016, 2016.
  E., and Ruth, U.: A new Greenland ice core chronology for              Stuiver, M. and Polach, H. A.: Discussion Report-
  the last glacial termination, J. Geophys. Res., 111, D06102,              ing      of    14 C    Data,     Radiocarbon,       19,      355–363,
  https://doi.org/10.1029/2005JD006079, 2006.                               https://doi.org/10.1017/S0033822200003672, 1977.
Rasmussen, S. O., Vinther, B. M., Clausen, H. B., and Ander-             Svalgaard, L. and Schatten, K. H.: Reconstruction of the Sunspot
  sen, K. K.: Early Holocene climate oscillations recorded in               Group Number: The Backbone Method, Sol. Phys., 291, 2653–
  three Greenland ice cores, Quaternary Sci. Rev., 26, 1907–1914,           2684, https://doi.org/10.1007/s11207-015-0815-8, 2016.
  https://doi.org/10.1016/j.quascirev.2007.06.015, 2007.                 Svensson, A., Andersen, K. K., Bigler, M., Clausen, H. B., Dahl-
                                                                            Jensen, D., Davies, S. M., Johnsen, S. J., Muscheler, R., Par-

Clim. Past, 16, 1145–1157, 2020                                                               https://doi.org/10.5194/cp-16-1145-2020
You can also read


