Radon concentration in conventional and new energy efficient multi storey apartment houses: results of survey in four Russian cities - Nature
←
→
Page content transcription
If your browser does not render page correctly, please read the page content below
www.nature.com/scientificreports
OPEN Radon concentration
in conventional and new energy
efficient multi‑storey apartment
houses: results of survey in four
Russian cities
Ilia V. Yarmoshenko*, Aleksandra D. Onishchenko, Georgy P. Malinovsky,
Aleksey V. Vasilyev, Evgeniy I. Nazarov & Michael V. Zhukovsky
During last decades, energy saving in new buildings became relevant within the energy efficiency
strategies in various countries. Such energy efficient building characteristics as air tightening and low
ventilation can compromise indoor air quality, in particular, increase radon concentration. In Russia,
a significant part of the new buildings is the energy efficient multi-storey apartment houses. The
aim of this study is to assess the significance of possible radon concentration increase in new energy
efficient buildings in comparison with typical conventional multi-storey houses of previous periods.
Radon surveys were conducted in Russian cities Ekaterinburg, Chelyabinsk, Saint-Petersburg and
Krasnodar. The radon measurements were carried out in 478 flats using CR-39 nuclear track detectors.
Energy efficiency index (EEI) was assigned to each house. All buildings were divided into six main
categories. The smallest average radon concentration was observed in panel and brick houses built
according to standard projects of 1970–1990 (four-city average 21 Bq/m3). The highest average radon
concentration and EEI were observed in new energy efficient buildings (49 Bq/m3). The trend of radon
increase in buildings ranked with high EEI index is observed in all cities. The potential increase of
radiation exposure in energy-efficient buildings should be analyzed taking into account the principles
of radiological protection.
Indoor exposure to decay products of radon gas is recognized as a human carcinogen risk factor. Findings
from epidemiologic studies support a strong causal association between indoor radon concentration and lung
cancer mortality1,2. According to combine of several s tudies3 excess risk of lung cancer is about 14% per radon
concentration 100 Bq/m3 linked to an exposure period of 25–30 years. ICRP consider that there is no known
threshold concentration below which radon exposure presents no risk of lung c ancer4. The health risk assessment
puts radon in the second place after smoking among lung cancer c auses4. Population protection against indoor
radon is provided by control of natural radioactivity during construction and operation of buildings5. In this
relation, geogenic radon potential and anthropogenic factors influencing indoor radon entry should be taking
into account. An important aspect of the radon problem is the changes in construction technologies and impact
of these changes on processes of radon accumulation in buildings.
Since the 1980s, in Russia and other countries of the world, energy saving and energy efficiency became
important requirements for the transition to the principles of environmentally sustainable development. The
global need to reduce energy consumption in different spheres of human activity is caused by several reasons.
To achieve limiting global average temperature rise, a variety of measures are required to reduce greenhouse
gases emissions6. High energy costs limit economic growth especially in developing countries. According to
statistic data on household spending, heating costs make up a larger part of the expenditures in low income than
in high-income families, reducing availability of education, medical care and other socially important n eeds7.
In the overall structure of energy consumption, a significant part is associated with housing and communal
services—up to 40% in developed c ountries8. Reducing energy consumption and improving the energy efficiency
of buildings is one of the objectives of the energy efficiency strategy in various countries (for Russian Federation
Institute of Industrial Ecology, Ural Branch of Russian Academy of Sciences, S. Kovalevskoy St., 20, Ekaterinburg,
Russia 620219. *email: ivy@ecko.uran.ru
Scientific Reports | (2020) 10:18136 | https://doi.org/10.1038/s41598-020-75274-4 1
Vol.:(0123456789)www.nature.com/scientificreports/
see ref.9). The major potential of energy saving relates to decreasing of heat losses through building envelope
(walls, windows, roof, etc.) due to thermal conductivity and convection. One of the efficient methods of limiting
heat consumption is a significant reduction of uncontrolled air exchange with the outside atmosphere in passive
mode of operation (without active regulation of the air exchange by dwellers). In Russia, the requirements on
the energy efficiency of buildings have been established since 1996, including the regulation of heat saving, heat
consumption and other parameters10. The energy efficiency class of a building in Russia is determined by the value
of the energy consumption for heating, ventilation and hot water supply11. The European Union has adopted the
Energy Performance in Buildings Directive (DIRECTIVE 2010/31/EU) which obliges to construct only near zero
energy buildings (defined as high energy efficiency buildings in a broad sense) in European countries by 2021.
Changing the energy characteristics of a dwelling that reduce heat loss can affect indoor air quality. In par-
ticular, the building air tightening may inhibit radon and other pollutants from leaving the indoor environment
and cause it to accumulate12,13.
Increase in indoor radon concentration after reconstruction in order to reduce heating loss was studied in
different countries. Several times increase of radon concentration was revealed in certain single-family houses
after installation of new PVC windows in regions of high geogenic radon potential in the Czech R epublic14. In
France, technical measures to increase heat saving were undertaken in more than a half of buildings, which
resulted in the increase of geometric mean of radon concentration by 1.615. Also, the growth of radon concen-
tration was observed in retrofitted houses in S witzerland16,17 and Germany18. In England, measures to reduce
the permeability of the shell of single-family houses led to a decrease in uncontrolled ventilation by an average
of 1.9 t imes13 and an increase in radon concentration by about 1.7 t imes19. Comparative studies in samples of
energy retrofitted and unreconstructed residential low-rise buildings demonstrated 22–120% increase of average
of radon concentration20. Studies in the Czech Republic21 and R ussia22 have shown 1.6 times average increase of
radon concentrations in children institutions. In the United States, the increase of radon concentration by 33%
(to 118 Bq/m3 on average) was observed in houses included in the national energy saving program in the zone
with elevated geogenic radon potential; at the same time, in the zone with the lowest radon potential, the radon
concentration did not change (30 Bq/m3)23. Similarly, in retrofitted houses in rural settlements on the Techa
River, Russia located in the geological zone of low soil permeability, the radon concentration increased by 50%
to 135 Bq/m3 on average; in the geological zone with high permeability, the average radon concentration was the
same24. In Lithuania and Finland, radon concentrations in multifamily buildings that were retrofitted with an
increase in energy efficiency class and unreconstructed buildings were c ompared25. According to the results of
the analysis, an increase in the radon concentration was observed in Lithuania after increase of energy saving by
1.6 times to 44 Bq/m325. In Finland, radon concentration did not change in apartment buildings with mechani-
cal ventilation (74 Bq/m3)25. Recent study in Ireland and the UK showed decreasing of radon concentration in
two storey houses with mechanical ventilation (passive houses)26. In general, the change of radon concentration
depends on the conditions of entry, ventilation pattern and relative contributions of the diffusion and convective
mechanisms of radon transport20.
Energy saving in new buildings is one of the main points of energy efficiency strategies in various countries.
In new houses built to meet energy efficiency requirements, increase in radon concentration compared to low-
energy efficiency classes houses is expected as well. The influence of energy-savings measures on indoor radon
concentration in new buildings were found in several studies in different countries. In the United States (New
York), radon survey conducted in conventional and energy-efficient single-family houses in the early 1980s have
shown that radon concentration was almost three times higher in a sample of houses with airtight envelope
than in other h ouses27. In Canada significant increase in radon due to energy efficiency measures was observed
when buildings were grouped into year-of-construction c ategories28. In Romania, measurements in one-story
buildings, constructed to meet the energy saving requirements since 2000 shown average radon concentration
27% higher than in conventional h ouses29.
In Finland, measures to increase the energy efficiency of buildings have been applied since the 1980s. Later
a requirement for equipping buildings with mechanical balanced and extraction ventilation was included to the
building codes for radon prevention purposes. Since 2006, most of new single-family houses have met both the
energy efficiency and radon protection requirements. Such approaches to regulation in construction resulted
in corresponding changes in the accumulation of indoor radon: average radon concentration was 104 Bq/m3 in
houses built in 1955–1964, by the end of the 1990s this value increased to 150 Bq/m3, in buildings constructed in
2006–2008, the average radon concentration decreased to 95 Bq/m330. Similarly, relatively lower radon concen-
tration in energy efficient houses equipped with mechanical balanced and extraction ventilation was observed
in Norway31, Austria32 and Switzerland33,34.
A significant part of the housing stock in Russian cities is composed of multi-storey apartment houses
equipped with natural ventilation systems. A common technical scheme of ventilation implies that fresh air
enters the rooms through leaks in the building shell and stale air is removed by vertical ventilation channels
through ducts usually arranged in the kitchen rooms, bathrooms and toilets of flats. Air movement occurs due to
the temperature difference between the external and internal air and wind pressure. In Russia, the requirements
for the construction of energy-saving buildings have been introduced since the late 1990s. In 2017, more than
75% of approximately 9000 new apartment buildings put into operation were assigned to high energy efficiency
classes B, A, A+ , A++9,11. Reducing energy consumption in new multi-storey apartment buildings is achieved by
such architectural and construction solutions as use of monolithic concrete and reinforced concrete structures in
combination with wall insulations and sealed double-glazed windows, as well as special building design reducing
the uncontrolled air exchange. Due to low air leaks through the external building envelope, natural ventilation
systems supply insufficient amount of the fresh air and doesn’t guarantee normative air exchange in new Russian
energy efficient multi-storey apartment buildings (0.35 h-1)35.
Scientific Reports | (2020) 10:18136 | https://doi.org/10.1038/s41598-020-75274-4 2
Vol:.(1234567890)www.nature.com/scientificreports/
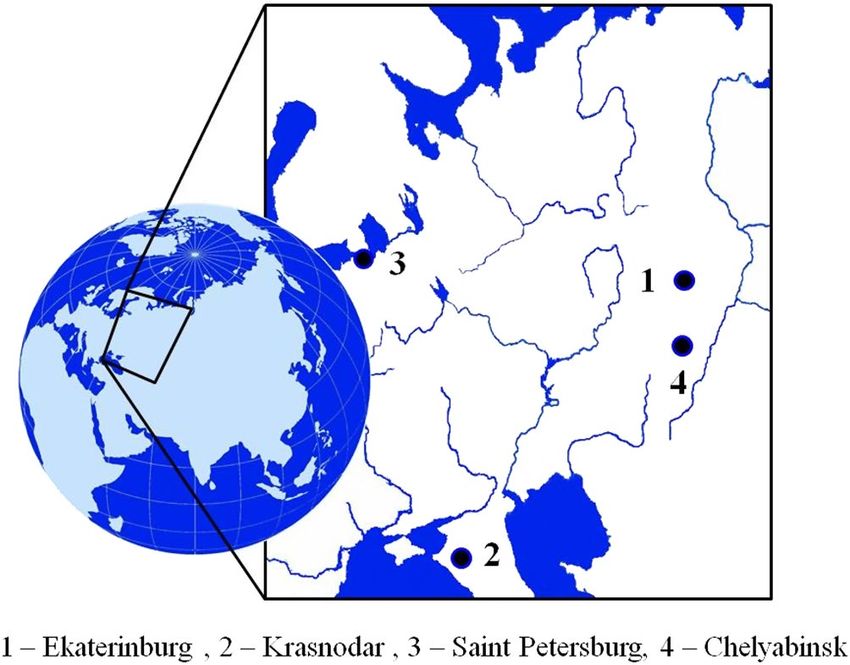
Figure 1. Location of the surveyed cities (map services and data available from U.S. Geological Survey, National
Geospatial Program, https://viewer.nationalmap.gov/advanced-viewer/).
Average annual temperature, Average temperature in Average temperature in
City Population in 2019, × 106 Climate °C January, °C July, °C
Ekaterinburg 1.48 Temperate continental 3.0 − 12.6 19.0
Temperate continental /
Krasnodar 0.92 12.1 0.6 24.1
subtropical
Temperate continental /moder-
Saint Petersburg 5.38 5.8 − 5.5 18.8
ately marine
Chelyabinsk 1.20 Temperate continental 3.2 -14.1 19.3
Table 1. Population and climatic conditions of the surveyed cities.
Until present study, surveys of radon accumulation in new energy-efficient buildings in Russia were carried
out only in E katerinburg35–38. As a part of these studies, a low air exchange rate in new energy efficient mid and
high-rise buildings (> 9 floors), about 0.1–0.2 h−1, and the effect of low air exchange rate on radon concentra-
tion in flats were observed. The example of Ekaterinburg demonstrated the relevance of studying the problem
of radon accumulation in flats of new energy-efficient large buildings.
The aim of this study is to assess the significance of possible increased accumulation of radon in modern
multi-storey apartment energy efficient houses in various regions. The study was conducted on a sample of four
large Russian cities situated in different climatic and geographical zones. The study includes radon surveys in
samples of flats in old and new buildings of various energy efficiency classes.
Materials and methods
Region of study. Four Russian cities, located in different climatic and geographical zones were selected to
conduct radon survey: Ekaterinburg, Chelyabinsk, Saint-Petersburg and Krasnodar (Fig. 1). Each city is a large
administrative centre with a population of about or more than a million people where high rates of building
construction were achieved in recent decades: 20–35% of contemporary residential housing stock was built since
2000. Population and general climatic characteristics of the surveyed cities are presented in Table 1.
Radon surveys. In each city indoor radon concentration measurements were performed in two samples of
houses. The first sample included flats in new multi-storey apartment houses which supposed to be assigned to
high energy efficiency class according to the Russian classification. The second sample was formed from multi-
storey apartment houses built before 2000 for which low energy efficiency is expected.
In Ekaterinburg, samples were formed from the data base of the results of previous studies carried out as
part of the other research projects realized in Institute of Industrial Ecology in 2015–2017. The entries with the
same indoor radon measurement method and exposure duration were included to the current study. However
the results were obtained in different seasons (winter—75%, spring/fall—25%).
In cities of Chelyabinsk, Saint Petersburg and Krasnodar the samples were formed within the frame of this
research basing on approaches as follow:
Scientific Reports | (2020) 10:18136 | https://doi.org/10.1038/s41598-020-75274-4 3
Vol.:(0123456789)www.nature.com/scientificreports/
1. invitation of volunteers from online communities of residents of buildings belonging to one of the required
types;
2. offering participation in the study to members of organized groups, such as staffs of research and educational
institutions;
3. using personal contacts.
To disseminate information about the study and attract volunteers to participate, a special group in popular
Russian social network was established under supervision of research team members. Also a website was created
to provide more detailed information about the study.
The research involved human participants. All experimental protocols were approved by Research Council
of Institute of Industrial Ecology of Ural Branch of Russian Academy of Sciences. All methods were carried out
in accordance with relevant guidelines and regulations. Informed consent was obtained from all participants
(no subjects under 18 were invited).
The measurements of radon concentrations were carried out using CR-39 type RSKS nuclear track-etch detec-
tors (RadoSys, Hungary)39. Radon detectors were calibrated both by the producer and within the framework of
internal laboratory control of the Institute of Industrial Ecology. RadoSys regularly participate in intercomparison
of radon measurements with RSKS detectors, in particular, recently, in international comparison of radon/thoron
measurement instruments40 and in the framework of MetroRADON P roject41. In the Institute of Industrial Ecol-
ogy, the calibration coefficients provided by producer were verified by exposure of radon detectors in a radon
chamber equipped with a radon source and radon-monitor AlphaGUARD PQ2000 PRO as a reference device,
which was previously calibrated with using a NIST radon emanation standard.
Two detectors were installed in each flat. In flats with more than one room, the radon detectors were placed
in living room and bedroom. The radon detectors had to be placed on any open surface at a height of 1–2 m and
at a distance of more than 1 m from doors and windows. Detailed guidelines on handling with radon detectors
were developed for participants of the study. Some of the volunteers attended a special popular science lecture
with information about the study, organized by members of scientific team in home cities of participants. The
participants of study were asked to fill out a questionnaire about their flats by themselves. The general informa-
tion obtained by means of self-filled questionnaire included address, floor of the flat, type of room, the number
of dwellers etc. Considering the objectives of the study, data on the type of the ventilation, frequency of active
room ventilation, and type of windows were asked in addition to the characteristics usually recorded in radon
surveys. Some essential information about the houses provided by participants of the study was verified apply-
ing official technical records.
Chemical etching after exposure and tracks reading was performed in the Institute of Industrial Ecology UB
RAS using the automatic RadoSys equipment. An average flat radon concentration was estimated using results
of two measurements.
Radon detectors were exposed for an average of three months. Three months measurements period instead
of all year measurements was selected due to reasons as follow. Considerable part of volunteers perceived three
months experiment acceptable for the participation. Longer period could result in low rate of agreement to par-
ticipate and decrease percentage of radon detectors returned to the laboratory. According to previous study such
duration of radon detector exposure provides satisfactory uncertainty of indoor radon concentration r esults42.
Considering known average month temperature it is possible to select measurements period with mean tempera-
ture close to an annual average value. Estimation of the annual average radon concentration was not the task of
the study, while radon concentration obtained during few months period with the same outdoor temperature
allow comparing results in different houses of the same region. The measurements in Chelyabinsk, Saint Peters-
burg and Krasnodar were carried out from August to November 2019, from September to December 2019 and
from October 2019 to January 2020 respectively. Most of detectors were distributed and collected by the members
of research team of this study. In some cases, radon detectors were distributed through the participants of the
study, who involved their relatives or friends. In each city radon detectors were exposed simultaneously in flats
of both samples.
Presence of thoron gas and other potential indoor air pollutants were not considered in this study.
Energy efficiency index. To analyze association between achieved degrees of energy efficiency and meas-
ured indoor radon concentration a method of quantitative estimation of energy efficiency potential of a building
was developed basing on the findings of the previous radon studies in E katerinburg22,36–38, where the role of
architectural and construction solutions in radon entry and accumulation indoor was demonstrated.
To systematize the variety of architectural and construction factors determining the energy efficiency of
buildings and characteristics of ventilation in multi-storey apartment house an expert evaluation approach was
applied. All the factors were divided into two main categories:
1. architectural and planning (characteristics of building envelope, airtightness, area of external walls, glazing
area, heat saving characteristics of vestibules, heat thermal protection characteristics of window systems etc.);
2. technical and technological (ensuring air exchange with minimal heat loss due to a mechanical supply and
exhaust system with heat recovery, rational use of heat and energy sources at home).
Technical information about Russian multifamily residential buildings is available at open online databases
of the foundation established for supporting communal services reform in the Russian Federation. The databases
contain general construction characteristics of housing units (year of construction; type of building construc-
tion; number of floors; number of flats; residential/non-residential area, etc.), information about the structural
Scientific Reports | (2020) 10:18136 | https://doi.org/10.1038/s41598-020-75274-4 4
Vol:.(1234567890)www.nature.com/scientificreports/
Criterion Description Points estimation procedure
Architectural and planning max 1.4 points
Equals to the ratio of the residential area, SR, to non-residential if SR/SNR > 0.5: V1 = 0.5
V1—Residential/non-residential area ratio
area, SNR, in a house if SR/SNR ≤ 0.5: V1 = SR/SNR
Depends on the type of facade walls:
highly efficient thermo insulated materials V2 = 0.5
V2—Airtightness brickwork V2 = 0.25
thermo insulated concrete panel V2 = 0.125
uninsulated facade of the building V2 = 0
Presence of heat saving tambours, stairwells and elevators:
V3—Energy-efficient planning yes V3 = 0.25
no V3 = 0
Technical and technological max 0.5 points
−1
Inversely proportional to the number of communication inputs to V 4 = 4·nS 4 · 2000 + 1 , where n4 is the number of inputs, S is
V4—Supply lines 2
the house per 2000 m of the total area of the building
the total area of the building, m2
−1
Inversely proportional to the number of garbage chutes in the V 5 = 4·nS 5 · 2000 + 1 , where n5 is the number of garbage
V5—Garbage chutes 2
house per 2000 m of the total area of the building
chutes
Table 2. Evaluation of EEI.
elements of the houses (type of foundation; floor structure; material of walls, etc.) and engineering systems
(electrical power system, ventilation system, garbage chutes, etc.). To analyze the architectural layout, we used
photographed materials found at street view services of Google and Yandex and floor plans if available.
To quantitatively estimate energy efficiency potential of a building, energy efficiency index (EEI) was devel-
oped. The EEI provides combined estimate of the construction, architectural and technical characteristics of
a building related to energy saving. The value of the EEI is the sum of the points estimated by some criteria
presented in Table 2. Based on the information collected for studied buildings, an individual EEI were assigned
to each housing unit.
Results
For radon surveys in Chelyabinsk, Saint Petersburg and Krasnodar, sets of two radon detectors were given out
to the 430 participants. The percentage of returned detectors in different cities was in the range 78–92%. A part
of the distributed detectors either were not returned by the participants for various reasons or were exposed in
detached and other types of single family houses. The radon detectors were returned to the laboratory from 375
participants living in the multi-storey apartment houses. The Ekaterinburg samples size chosen to include to this
study was 103 flats. Thus totally results of radon measurements in 478 dwellings in the multi-storey apartment
houses were available for the further analysis.
The average temperatures for the radon detectors exposure period in different cities were as follow:
Ekaterinburg – 4.7 °C,
Krasnodar 5.0 °C
Saint Petersburg 5.6 °C,
Chelyabinsk 8.8 °C
As can be seen from these data and Table 1, the difference between the average temperatures for the measure-
ment exposure period and the corresponding average annual temperatures is from 0.2 to 7.7 °C. This difference
is less than 20% of the temperature difference of the coldest and warmest months of the year. Taking into account
the relatively small difference between temperature during measurements and average annual temperature, it
was decided to avoid additional seasonal normalization.
Based on the questionnaires and analysis of architectural and construction factors information about the
surveyed buildings, the entire housing stock was divided into the following main categories.
1. Brick buildings with 2–5 storeys. Houses of this type were built mainly in 1930–1960. The main build-
ing material is brick; floor panel is made of reinforced concrete or wood. The façade walls are partially or
fully plastered. The ventilation system is natural. Exhaust ventilation ducts are installed in the kitchen and
bathroom. Continuous vertical stairwells are designed from the house entrance to the last floor. This group
includes houses, which, together with similar panel five-story buildings, were the main type of buildings of
the period of mass housing construction in 1950–1960.
2. Panel 5-story buildings. Houses of this type were built in 1950–1970. The walls and floor panels are made
of prefabricated reinforced concrete panels. The ventilation system is natural, the kitchen and bathroom are
equipped with an exhaust ventilation ducts. Vertical continuous stairwells are designed.
Scientific Reports | (2020) 10:18136 | https://doi.org/10.1038/s41598-020-75274-4 5
Vol.:(0123456789)www.nature.com/scientificreports/
Part of flats with reported
permanent intentional
Type of buildings Average flat’s floor* Average number of dwellers Part of flats of no-smokers ventilation
Brick 2–5 floor 3 2.3 0.73 0.24
Panel 5 floor 3 2.6 0.82 0.28
Panel 7–12 floor 5 2.7 0.83 0.37
Brick over 5 floors 6 2.2 0.63 0.33
Panel 1990-present 7 2.6 0.69 0.33
Energy efficient 11 2.7 0.76 0.28
Table 3. Characteristics of flats by the main categories of the buildings. *Ground level is counted as the first
floor.
3. Panel buildings 7–12 storeys. This type of houses was used in the block development in 1970–1980. The walls
and floor panels are made of prefabricated reinforced concrete panels. The stairwell represents a continu-
ous volume over the height of the building including elevator halls. Often there is a garbage chute. Natural
ventilation is a supply or exhaust type or combined type.
4. Brick buildings with more than five storeys. This type of houses was built mainly in 1970–1980. Floor panels
are made of reinforced concrete. The stairwells also represent the continuous volume over the height of the
building; the elevator halls are connected to stair halls. There is the garbage chute in some houses. The walls
are plastered or tiled. The ground floor is often reserved for non-residential premises.
5. Panel buildings with more than ten storeys built in the period from 1990s to the present time. This type
of houses is differing from the panel multi-storey buildings of earlier years of construction by planning
decisions. In particular, stair halls are separated from the stairwells by tambours. The elevator halls may be
separated from stair halls as well.
6. Modern energy efficient buildings over eight floors. This type includes buildings built in the period from
2005 to the present applying energy-saving architectural solutions and construction technologies. The PVC
windows are used in all premises of the building, loggias are glazed. The façade walls are additionally insu-
lated. Ground floor vestibules, external stairwells (fire escapes), and internal elevators halls are equipped with
tambours and doors closers. Heat loss reduction is mainly achieved through structural and space-planning
solutions: energy efficient house layout, continuous heat-insulated building shell, lack of thermal bridges,
optimal glazing area, using window systems with a high level of thermal protection, the presence of vestibules
with tambours at the entrances, etc.
In addition to the listed categories, some other types of buildings were included to the study. In Saint Peters-
burg, old multi-storey brick houses constructed before period of the World War I, October Revolutions and the
Russian Civil War (1914–1922) contribute significantly to the contemporary housing stock. In Saint Petersburg,
Ekaterinburg and Krasnodar the measurements were carried out in several low-rise (five storeys) modern energy-
efficient buildings.
Important distinctive feature of the modern energy efficient buildings is the high number of floors (average is
18). Among the energy efficient buildings, there are significant amount of the high-rise buildings (81% is taller
than 15 storeys). As can be seen in Table 3 average floor of flat, where radon concentrations measurements were
performed, is much higher in this type of building than in others. According to analysis of self-reported infor-
mation from dwellers, such characteristics as average number of dwellers in a flat, smoking prevalence among
dwellers, and room ventilation preferences are approximately the same in different types of buildings (Table 3).
Based on the results of the analysis of the architectural and construction characteristics of buildings, the EEI
of various types of high-rise buildings were determined.
To present the results of the radon survey the parameters of the lognormal distribution of the indoor radon
concentration (flat average) were calculated in each group of buildings: the geometric mean (GM), the standard
deviation of the logarithm (σLN), as well as the arithmetic mean (AM) and the estimate of 95th percentile of the
lognormal distribution. For each group of buildings the average EEI was calculated. The results of radon surveys
and EEI estimation in four cities by types of buildings are presented in Table 4.
Figure 2 shows the distribution of buildings with different EEI in four cities. To draw this figure buildings
were combined into 5 groups: 0–0.375; 0.376–0.625; 0.626–0.875; 0.876–1.125 and above 1,125, with EEI central
values 0.25, 0.5, 0.75, 1, and > 1 respectively. For low-rise energy efficient buildings EEI was not calculated, as
the methodology for EEI assessment has been developed for multi-storey buildings (mid-rise and high-rise).
As can be seen from Fig. 2 the largest percentage of energy efficient buildings was observed in Saint Petersburg,
the smallest—in Chelyabinsk. Also the largest share of low energy efficient buildings is observed in Chelyabinsk.
Figure 3 shows the difference in EEI between groups of typical buildings. The highest EEI is reasonably
observed for the energy efficient buildings. Of the buildings of other types, the brick buildings are more energy
efficient, while the EEI in this group is almost two times lower than in new buildings with high energy efficiency.
The lowest energy efficiency is observed in panel buildings, almost three times less than in new energy efficient
buildings.
The AM of radon concentration were calculated in groups depending on the EEI in each of four cities
(Fig. 4). In all cities, except Krasnodar, the maximum of radon concentration is observed in new energy efficient
Scientific Reports | (2020) 10:18136 | https://doi.org/10.1038/s41598-020-75274-4 6
Vol:.(1234567890)www.nature.com/scientificreports/
Type of buildings N* AM, Bq/m3 GM, Bq/m3 σLN 95th percentile Bq/m3 EEI
Ekaterinburg
Brick 2–5 floor 11 39 28 0.97 138 0.76
Panel 5 floor 15 36 29 0.63 82 0.40
Panel 7–12 floor 13 25 21 0.59 55 0.38
Brick over 5 floors 12 28 26 0.41 52 0.71
Panel 1990-present 16 34 29 0.60 78 0.44
Energy efficient 35 82 66 0.67 199 1.22
Low-rise energy efficient 1 16 16 – – 0.86
Chelyabinsk
Brick 2–5 floor 17 36 32 0.49 70 0.77
Panel 5 floor 16 27 25 0.38 47 0.42
Panel 7–12 floor 17 21 20 0.27 32 0.35
Brick over 5 floors 3 19 19 – – 0.76
Panel 1990-present 62 25 23 0.39 45 0.57
Energy efficient 14 32 29 0.47 62 1.05
Saint Petersburg
Before 1917 14 12 10 0.65 30 0.76
Brick 2–5 floor 14 26 21 0.67 63 0.68
Panel 5 floor 9 23 21 0.47 45 0.45
Panel 7–12 floor 6 18 16 0.43 33 0.46
Brick over 5 floors 16 15 14 0.35 25 0.69
Panel 1990-present 23 17 15 0.45 32 0.47
Energy efficient 62 31 27 0.57 68 1.21
Low-rise energy efficient 8 38 37 0.24 55 0.90
Krasnodar
Brick 2–5 floor 10 42 36 0.53 86 0.74
Panel 5 floor 10 41 34 0.62 94 0.58
Panel 7–12 floor 7 21 20 0.36 36 0.36
Brick over 5 floors 6 19 18 0.34 32 0.78
Panel 1990-present 24 20 18 0.45 38 0.55
Energy efficient 36 28 27 0.29 43 1.25
Low-rise energy efficient 1 29 29 – – 0.75
Table 4. Results of indoor radon concentration measurements and EEI estimations for different types of
buildings in four Russian cities. *N is number of measured flats.
100%
80%
low-rise EE buildings
60%
>1
1
40% 0.75
0.5
20% 0.25
0%
Chelyabinsk Ekaterinburg Krasnodar Saint
Petersburg
Figure 2. The share of buildings with different EEI by cities.
buildings. A general trend of increase in the average radon concentration with an increase in energy efficiency
can be noticed in all cities.
Figure 5 presents a comparison of GM of radon concentration in buildings with maximum and minimum
energy efficiency (groups of buildings with EEI > 1 and combined groups 0.25 and 0.5) with estimation of
Scientific Reports | (2020) 10:18136 | https://doi.org/10.1038/s41598-020-75274-4 7
Vol.:(0123456789)www.nature.com/scientificreports/
1.4
1.2
1
0.8
EEI
0.6
0.4
0.2
0
Panel 7-12 Panel 5 Panel Brick over Brick 2-5 Energy
floor floor 1990-present 5 floors floor efficient
Figure 3. The average EEI by type of buildings, whiskers—standard deviation.
Ekaterinburg
>1
EEI
1
0.75
0.5
0.25
0 25 50 75
Krasnodar
>1
EEI
1
0.75
0.5
0.25
0 25 50 75
Saint
Petersburgг >1
EEI
1
0.75
0.5
0.25
0 25 50 75
Chelyabinsk
>1
EEI
1
0.75
0.5
0.25
0 25 50 75
Radon concentration, Bq/m3
Figure 4. Average radon concentration in groups of buildings depending on EEI.
Scientific Reports | (2020) 10:18136 | https://doi.org/10.1038/s41598-020-75274-4 8
Vol:.(1234567890)www.nature.com/scientificreports/
75
GM, Bq/m3
50
EEI >1
EEI 1 to
EEI < 0.625. As seen in Fig. 6, the RIF is in the range from 1.2 to 2.4 in different cities and the maximum of radon
concentration growth was observed in Ekaterinburg.
In Ekaterinburg and Saint Petersburg the largest samples of new energy efficient buildings were obtained,
which allowed more detailed analysis of factors affecting the accumulation of radon in this type of houses. As
shown in Fig. 7 significant influencing factor is year of the building construction. In new energy efficient build-
ings built later (in Ekaterinburg after 2010, in Saint Petersburg after 2015) radon concentration is significantly
higher than in buildings constructed earlier. On the example of Saint Petersburg a relatively higher radon con-
centration in low-rise energy efficient buildings can be observed. The dependence of radon concentration on
the floor number in energy efficient buildings in Saint Petersburg are presented in Fig. 8. In this type of building
only one measurement was performed on the first floor (floors are numbered applying Russian system with
the ground floor being floor 1). For other floors there is no significant difference in GM radon concentration.
Discussion
In the frames of this study, the indoor radon concentration was measured in various types of Russian multi-storey
apartment houses with different energy efficiency characteristics using the same method. Radon detectors were
exposed simultaneously in all types of buildings in each city, except Ekaterinburg.
There are two basic approaches to seasonal correction of indoor radon concentration measurements. The
seasonal adjustment use known seasonal correction coefficients estimated during special studies performed in
the region (such studies were not performed for each climatic region of Russia). The temperature normalization,
another approach, suggests to estimate an annual radon concentration depending on the difference between
temperature during measurement period and annual average value. The temperature of the outdoor atmos-
phere during exposure of detectors in flats approximately corresponded to the annual average temperature,
therefore, the measured concentrations were considered as close assessment of the annual values. The chosen
approach to seasonal correction should be considered as the source of uncertainty for comparison of indoor
Scientific Reports | (2020) 10:18136 | https://doi.org/10.1038/s41598-020-75274-4 9
Vol.:(0123456789)www.nature.com/scientificreports/
120
100
80
GM, Bq/m3
Early
60
Later
40 Low-rise buildings
20
0
Ekaterinburg Saint Petersburg
Figure 7. Geometric mean radon concentration in subgroups of energy efficient buildings depending on the
year of construction: Ekaterinburg—earlier (number of measured flats N = 15) and later 2010 (N = 12); Saint
Petersburg—earlier (N = 27) and later 2015 (N = 35). Low-rise energy buildings in Saint Petersburg—all the years
of construction (N = 8). Whiskers—95% CI of geometric mean.
Floor 18-25, N=13
Floor 13-17, N=16
Floor 6-12, N=15
Floor 2-5, N=16
Floor 1, N=1
0 5 10 15 20 25 30 35 40
GM, Bq/m3
Figure 8. Geometric mean radon concentration depending on the floor in energy efficient buildings in Saint
Petersburg (with 95% CI, N is number of measured flats).
radon concentration between the cities. To analyze the radon levels in different types of buildings, it is essential
to perform measurements simultaneously.
Application of two RSKS radon detectors provided relatively low range of σLN estimations (< 1, Table 4) for
any subsample grouped by type of building. Low scatter of radon concentration within homogeneous groups
(with regard to the type of building) increased a significance of comparison of radon concentrations between
the groups.
A comparative analysis of radon concentrations and EEI in typical flat houses of mass development in Rus-
sia in the twentieth century and new multi-storey apartment buildings carried out in four Russian cities have
shown the following results. The smallest average radon concentration is observed in panel and brick houses
with a number of floors above five and built according to standard projects of 1970–1990 (Table 4). In these
types of buildings, the average radon concentration in all cities was about 21 Bq/m3. Relatively higher levels of
radon concentration are observed in low-rise (2–5 floors) buildings of the 1930–1960 construction period. The
average radon concentration was 33 Bq/m3 in these buildings and it differs insignificantly across the surveyed
cities. The relative decrease in energy efficiency in panel buildings of the 70–90 s compared with brick houses
built before 1990 is caused by the material of the internal walls, the technologies used and the quality of work
(poorly insulated joints of reinforced concrete slabs), the presence of garbage chutes, a large number of supply
and service lines, the lack of tambours separating stairs and elevators.
The highest average radon concentration is observed in new energy efficient buildings (four-city average
49 Bq/m3). Higher energy efficiency in houses built after 2000 was achieved mostly due to increased airtight-
ness of building envelope applying such technical measures to reduce or prevent thermal bridging as continuous
insulation materials, double glazed PVC windows, large area of glazed loggias, etc. Decreased air permeability
of building envelope significantly reduces the contribution of fresh air to the general air exchange of residential
rooms, which leads to increased radon accumulation.
Both in low and high energy efficiency houses, thermal comfort is controlled by dwellers, in particular, by
regulation of the air exchange (opening and closing windows and ventilation ducts). The EEI doesn’t take into
account for living habits of dwellers however it reflect lower uncontrolled ventilation rate in energy efficient
Scientific Reports | (2020) 10:18136 | https://doi.org/10.1038/s41598-020-75274-4 10
Vol:.(1234567890)www.nature.com/scientificreports/
buildings. It can be supposed that controlled ventilation is lower by average value and duration in low energy
efficient houses due to satisfactory ventilation rate without windows opening.
The general trend of average radon concentration increase in groups of buildings ranked with high EEI index
is observed in all cities. Such trend may be characterized by the RIF (Fig. 6). While the buildings in the northern
and southern regions of Russia principally have the same construction and architectural solutions undertaken
to reduce the heat loss, and the average outdoor temperature during the measurements was also approximately
the same, close values of RIF may be expected. However RIF varies noticeably between studied cities. Such vari-
ability may be explained by specific reasons for each city. In Krasnodar located in region of warmer climate, the
routine building’s operation may be less aimed at saving heat taking into account likely high outdoor tempera-
tures throughout the year. Such situation associates with lower increase of radon concentration. Other cities are
located in colder climatic zones, therefore it is assumed that the practice of operating buildings in these cities
maintains the design level of energy efficiency. The highest increase of radon concentration in Ekaterinburg
can be associated with a relatively lower average outdoor temperature during the measurement period. Longer
uncontrolled ventilation intervals during the colder seasons may result in lower average ventilation rate in energy
efficient buildings. A relatively small number of buildings with a high energy efficiency index got to the study in
Chelyabinsk. The outdoor temperature during the measurement period was the highest in this city. Therefore,
the conclusion about increasing of radon concentration in building of high energy efficient class requires further
justification in this city.
Some deviations from the correlation between the average radon concentration and EEI may be caused by
some additional factors. In particular, radon concentration is associated with the radium-226 activity concen-
tration, emanation factor and other characteristics in building materials, which may vary for different types of
buildings in the same city. This may be caused by using different types of building structures and building mate-
rials at different periods of time. E.g. in previous studies, relatively high radium-226 concentration in building
materials (90 Bq/kg) was found in a flat of new energy efficient building (Ekaterinburg, 15-th floor), which, in
combination with low uncontrolled ventilation rate, caused high indoor radon concentration (370 Bq/m3)20.
During the formation of samples, certain skewness towards the new buildings was permitted in order to
ensure representativeness of the energy efficient buildings in the study. Therefore, the created samples may
contain energy efficient buildings in higher proportion than their real contribution to the housing stock in the
cities. According to the assessment of EEI based on architectural and construction characteristics, not all build-
ings built after 2000 have been assigned to high energy efficiency class. Thought some bias in forming samples
of new buildings was allowed, a percentage of high energy efficiency buildings in the sample of new buildings in
different cities may be compared. The largest percentages of energy efficient buildings among new buildings were
observed in Saint Petersburg. In Chelyabinsk, considerable part of houses built in the 2000s was panel buildings
with lower energy efficiency. Difference in the percentage of high energy efficiency buildings reflects preferable
appliance of different construction technologies and, to some extent, the social and economic development of the
cities. Higher percentage of new energy efficient buildings may result in relative increase of radon concentration
in a larger number of houses in Saint Petersburg.
A detailed analysis of the radon accumulation in the new energy efficient buildings in Ekaterinburg and Saint
Petersburg has shown that this group of buildings is heterogeneous. A higher radon concentration was found in
the buildings built recently that may be caused by the following reasons. On the one hand, it is possible that the
further improvement of technologies that raise the building’s energy efficiency occurs. On the other hand, it can
be assumed that after few years of putting the building into operation, its energy efficiency may reduce due to the
deterioration of some structural elements of the building. Also, low ventilation and high radon accumulation may
occur in flats not occupied by residents within few months after construction completing, which increase total
radon activity in new flat houses. Among flats in new built buildings (after 2015), low attendance was reported
in the questionnaires for 3 flats (all in Saint Petersburg). Some amount of inhabited flats in the new building
may influence on total ventilation rate in a building. However the effect of advective flows between habited and
inhabited premises of a multi-flat building is insufficient studied yet.
The fundamental difference should be noted between the multi-storey buildings analyzed in this study and
the low-rise detached houses, which are in the spot in the studies of energy saving in Western Europe and
Northern America. In low-rise buildings, the main source of radon is ground under the b uilding43,44. Improv-
ing the airtightness of a building can increase the pressure difference in the soil-building system and trigger the
stack effect18,43. This situation leads to an increase in the indoor radon concentration due to radon entry from
the soil and low dilution by fresh air. In high-rise buildings, the air flow from the soil does not play a significant
role in the radon entry on the upper floors, and the construction materials become a main source of r adon35–38.
Improving the airtightness of the high-rise multi-storey buildings can also cause depression in individual rooms
and appearing additional convective air flows distributed between the building spaces. This potential effect needs
to be studied in the future.
The number of theoretical studies and analysis of construction practices have shown that providing additional
mechanical ventilation can solve the problem of air quality during thermal reconstruction of houses and the
construction of new energy-efficient buildings. In this study, one house equipped with the mechanical ventila-
tion system with heat recovery was identified in the surveyed sample of modern energy efficient multi-storey
apartment buildings. In this new energy efficient building in Saint Petersburg average radon concentration was
30 Bq/m3, that is comparable with average radon concentration in buildings with EEI > 1 in this city. In other
buildings, special engineering solutions are not used to improve energy efficiency without compromising the
comfort of the indoor climate. The effectiveness of building ventilation strategies using mechanical ventilation
systems in high-rise buildings in terms of radon accumulation also requires further study.
In general, observed indoor radon concentrations in multi-storey apartment houses in studied Russian cit-
ies are relatively low. Radon concentration higher than action level established in Russia for newly built houses
Scientific Reports | (2020) 10:18136 | https://doi.org/10.1038/s41598-020-75274-4 11
Vol.:(0123456789)www.nature.com/scientificreports/
(equilibrium equivalent radon concentration 100 Bq/m3 which is equal to radon concentration 200 Bq/m3 if
equilibrium factor 0.5 is applied) was found in few apartments in energy-efficient buildings in Ekaterinburg. In
other cities radon concentration was lower than this action level in all studied multi-storey houses. However,
limiting the analysis to only comparing the current situation with the action level potentially hides a problem
of relative increase of radon concentration in new buildings with high energy efficiency class, which requires
attention from point of view of the radiological protection. The mass construction of energy-efficient buildings,
which is now taking place in large cities of Russia, in the long term, can lead to an increase in mean and collective
radiation doses of the urban population. Framing and implementation of the radon protection strategy should
ptimization5 taking into account social and economic factors and
be based on the principles of justification and o
evaluation of the situation of exposure to indoor radon in different types of buildings.
Conclusions
The novelty of this study lies in the combined survey of radon concentration in dwellings and architectural and
construction characteristics with a quantitative estimation of energy efficiency potential of a building. An energy
efficiency parameter (EEI) describing the energy efficiency of a building in terms of reducing uncontrolled air
exchange has been proposed for the first time. A comparative analysis of results of measurements carried out
in the same period of time in different types of buildings provides evidence of the relationship between the
energy efficiency of a building and the indoor radon concentration in large samples of buildings in real operat-
ing conditions.
The main conclusions of the study are as follow:
1. Assumption that radon concentration in modern multi-storey apartment energy-efficient buildings is higher
on average than in typical flat houses of the previous periods of construction is confirmed in four Russian
cities.
2. Increased energy efficiency causing lower uncontrolled ventilation rate is a factor that reduces the radon
safety of a multi-storey apartment building.
3. Energy efficiency does not predetermine the excess of reference levels and national radiation-hygienic stand-
ards in new buildings.
4. Relatively higher levels of radon concentration in energy-efficient buildings may be associated with low
uncontrolled ventilation rate and multifamily building’s operation practices which caused insufficient aver-
age air exchange rate.
5. Higher activity concentration of radium-226 in building materials may enhance effect of airtightness.
6. The potential increase of radiation doses due to introduction of technologies for the construction of energy-
efficient buildings should be analyzed taking into account the principle of radiological protection.
Received: 15 June 2020; Accepted: 14 October 2020
References
1. Darby, S. et al. Radon in homes and risk of lung cancer: collaborative analysis of individual data from 13 European case-control
studies. Br. Med. J. 330, 223 (2005).
2. Krewski, D. et al. Residential radon and risk of lung cancer: a combined analysis of 7 North American case-control studies. Epi-
demiology 16, 137–145 (2005).
3. Yarmoshenko, I. V. & Malinovsky, G. P. Combined analysis of onco-epidemiological studies of the relationship between lung cancer
and indoor radon exposure. Nukleonika 65, 83–88 (2020).
4. Clement, C. H. et al. Lung cancer risk from radon and progeny and statement on radon. Ann. ICRP 40, 1–64 (2010).
5. Lecomte, J.-F. et al. ICRP publication 126: Radiological protection against radon exposure. Ann. ICRP 43, 5–73 (2014).
6. Rogelj, J. et al. Paris agreement climate proposals need a boost to keep warming well below 2 °C. Nature 534, 631–639 (2016).
7. Statistical bulletin. Family spending in the UK: financial year ending March 2016. UK Office of National Standards. Retrieved
October 15, 2020, from Gov.uk website: https://www.ons.gov.uk/peoplepopulationandcommunity/personalandhouseholdfinan
ces/expenditure/bulletins/familyspendingintheuk/financialyearendingmarch2016/pdf (2017).
8. Commission Recommendation (EU). 2019/786 of 8 May 2019 on building renovation, C/2019/3352. Official Journal of the Euro-
pean Union. L127/34. Retrieved October 15, 2020, from Europa.eu website: https://eur-lex.europa.eu/legal-content/EN/TXT/
PDF/?uri=CELEX:32019H0786&from=GA (2019).
9. Energy strategy of Russia for the period up to 2030 dated November 13, 2009, No. 1715-p. Retrieved October 15, 2020, from
Energystrategy.ru website: http://www.energystrategy.ru/projects/docs/ES-2030_(Eng).pdf (2009).
10. Alekseev, A. N., Lobova, S. V., Bogoviz, A. V. & Ragulina, Y. V. A critical review of Russia’s energy efficiency policies in the con-
struction and housing sector. IJEEP 9, 166–172 (2019).
11. Korniyenko, S. Complex analysis of energy efficiency in operated high-rise residential building: case study. E3S Web Conf. 33,
02005 (2018).
12. Nero, A. Y., Boegel, M. L., Hollowell, C. D., Ingersoll, J. G. & Nazaroff, W. W. Radon concentrations and infiltration rates measured
in conventional and energy-efficient houses. Health Phys. 45, 401–405 (1983).
13. Milner, J. et al. Home energy efficiency and radon related risk of lung cancer: modelling study. BMJ 348, f7493–f7493 (2014).
14. Slezakova, M., Navratilova Rovenska, K., Tomasek, L. & Holecek, J. Short- and long-term variability of radon progeny concentra-
tion in dwellings in the Czech Republic. Radiat. Prot. Dosim. 153, 334–341 (2012).
15. Collignan, B., Le Ponner, E. & Mandin, C. Relationships between indoor radon concentrations, thermal retrofit and dwelling
characteristics. J. Environ. Radioact. 165, 124–130 (2016).
16. Burkart, W., Wernli, C. & Brunner, H. H. Matched pair analysis of the influence of weather-stripping on indoor radon concentra-
tion in swiss dwellings. Radiat. Prot. Dosim. 7, 299–302 (1984).
17. Pampuri, L., Caputo, P. & Valsangiacomo, C. Effects of buildings’ refurbishment on indoor air quality. Results of a wide survey on
radon concentrations before and after energy retrofit interventions. Sustain. Cities Soc. 42, 100–106 (2018).
Scientific Reports | (2020) 10:18136 | https://doi.org/10.1038/s41598-020-75274-4 12
Vol:.(1234567890)www.nature.com/scientificreports/
18. Meyer, W. Impact of constructional energy-saving measures on radon levels indoors. Indoor Air 29, 680–685 (2019).
19. Symonds, P. et al. Home energy efficiency and radon: an observational study. Indoor Air 29, 854–864 (2019).
20. Yarmoshenko, I. V., Malinovsky, G. P., Onishchenko, A. D. & Vasilyev, A. V. Problem of radon exposure in energy-efficient build-
ings: a review. Radiat. Hyg. 12, 56–65 (2019).
21. Fojtikova, I. & Navratilova Rovenska, K. Influence of energy-saving measures on the radon concentration in some kindergartens
in the Czech Republic. Radiat. Prot. Dosim. 160, 149–153 (2014).
22. Onishchenko, A. D., Vasilyev, A. V., Malinovsky, G. P. & Zhukovsky, M. V. Influence of building features on radon accumulation
in kindergartens of the Sverdlovsk region. Radiat. Hyg. 11, 28–36 (2018).
23. Pigg, S., Cautley, D. & Francisco, P. W. Impacts of weatherization on indoor air quality: a field study of 514 homes. Indoor Air 28,
307–317 (2017).
24. Yarmoshenko, I., Malinovsky, G., Vasilyev, A., Onischenko, A. & Seleznev, A. Geogenic and anthropogenic impacts on indoor
radon in the Techa River region. Sci. Total Environ. 571, 1298–1303 (2016).
25. Du, L. et al. Effects of energy retrofits on Indoor Air Quality in multifamily buildings. Indoor Air 29, 686–697 (2019).
26. Mc Carron, B., Meng, X. & Colclough, S. An investigation into indoor radon concentrations in certified passive house homes.
IJERPH 17, 4149 (2020).
27. Fleischer, R. L., Mogro-Campero, A. & Turner, L. G. Indoor radon levels in the Northeastern US. Health Phys. 45, 407–412 (1983).
28. Stanley, F. K. T. et al. Radon exposure is rising steadily within the modern North American residential environment, and is increas-
ingly uniform across seasons. Sci. Rep. 9, 18472 (2019).
29. Cucoş (Dinu), A., Dicu, T. & Cosma, C. Indoor radon exposure in energy-efficient houses from Romania. Rom. J. Phys. 60,
1574–1580 (2015).
30. Arvela, H., Holmgren, O. & Reisbacka, H. Radon prevention in new construction in Finland: a nationwide sample survey in 2009.
Radiat. Prot. Dosim. 148, 465–474 (2011).
31. Finne, I. E. et al. Significant reduction in indoor radon in newly built houses. J. Environ. Radioact. 196, 259–263 (2019).
32. Ringer, W. Monitoring trends in civil engineering and their effect on indoor radon. Radiat. Prot. Dosim. 160, 38–42 (2014).
33. Goyette Pernot, J., Hager-Jörin, C., Pampuri, L. Indoor radon and air quality investigations in new or renovated energy-efficient
Swiss single-family dwellings. PLEA 2015—Architecture in revolution September 2015, Bologna, Italy.
34. Yang, S. et al. Radon investigation in 650 energy efficient dwellings in Western Switzerland: impact of energy renovation and
building characteristics. Atmosphere 10, 777 (2019).
35. Vasilyev, A. V., Yarmoshenko, I. V. & Zhukovsky, M. V. Low air exchange rate causes high indoor radon concentration in energy-
efficient buildings. Radiat. Prot. Dosimetry. 164, 601–605 (2015).
36. Yarmoshenko, I. V., Vasilyev, A. V., Onishchenko, A. D., Kiselev, S. M. & Zhukovsky, M. V. Indoor radon problem in energy efficient
multi-storey buildings. Radiat. Prot. Dosimetry. 160, 53–56 (2014).
37. Vasilyev, A. V., Yarmoshenko, I. V. & Zhukovsky, M. V. Radon safety of modern multi-storey buildings with different energy
efficiency classes. Radiat. Hyg. 11, 80–84 (2018).
38. Zhukovsky, M. V. & Vasilyev, A. V. Mechanisms and sources of radon entry in buildings constructed with modern technologies.
Radiat. Prot. Dosim. 160, 48–52 (2014).
39. RADOSYS LTD. Technical information https://www.radosys.com/index_htm_files/RSKS_RS_Man82-130129 _c.pdf. Accessed 28
Aug 2020
40. Jilek, K., Havelka, M., Kotík, L. Results of the 2019 International Comparison of Radon/Thoron and Radon Short-lived Decay
Product Measurement Instruments at the NRPI Prague. SÚRO vvi. REG 01–2020 (2020) (https://www.suro.cz/cz/vyzkum/vysle
dky/The-5th-International-Comparison-on-Radon-Thoron-gas-SURO-Prague-2019.pdf)
41. Rabago, D. et al. Intercomparison of indoor radon measurements under field conditions in the framework of MetroRADON
European Project. IJERPH 17, 1780 (2020).
42. Onishchenko, A. D. & Zhukovsky, M. V. The role of confounding factors in a radon epidemiological study. Radiat. Hyg. 10(1),
65–75 (2017).
43. Collignan, B. & Powaga, E. Impact of ventilation systems and energy savings in a building on the mechanisms governing the indoor
radon activity concentration. J. Environ. Radioact. 196, 268–273 (2019).
44. Arvela, H., Holmgren, O., Reisbacka, H. & Vinha, J. Review of low-energy construction, air tightness, ventilation strategies and
indoor radon: results from Finnish houses and apartments. Radiat. Prot. Dosim. 162, 351–363 (2013).
Acknowledgements
The study was supported by Russian Science Foundation (Grant No. 19-19-00191). Authors are grateful to citi-
zens of Ekaterinburg, Krasnodar, St. Petersburg and Chelyabinsk for generous cooperation and participation
in the study.
Author contributions
I.V.Y. Conceptualization; Formal analysis; Funding acquisition; Visualization; Investigation; Methodology; Pro-
ject administration; Writing – review & editing; A.D.O. Data curation; Funding acquisition; Investigation; Writing
– original draft; G.P.M. Conceptualization; Formal analysis; Funding acquisition; Investigation; Writing – review
& editing; A.V.V. Conceptualization; Funding acquisition; Investigation; Validation; Writing – review & edit-
ing; E.I.N. Investigation; Data curation; Writing – review & editing; M.V.Z. Conceptualization; Methodology;
Supervision; Writing – review & editing.
Competing interests
The authors declare no competing interests.
Additional information
Correspondence and requests for materials should be addressed to I.V.Y.
Reprints and permissions information is available at www.nature.com/reprints.
Publisher’s note Springer Nature remains neutral with regard to jurisdictional claims in published maps and
institutional affiliations.
Scientific Reports | (2020) 10:18136 | https://doi.org/10.1038/s41598-020-75274-4 13
Vol.:(0123456789)You can also read