Rail freight and the Western Region - Western Development
←
→
Page content transcription
If your browser does not render page correctly, please read the page content below
Rail freight and the Western Region
               Final Report

              December 2015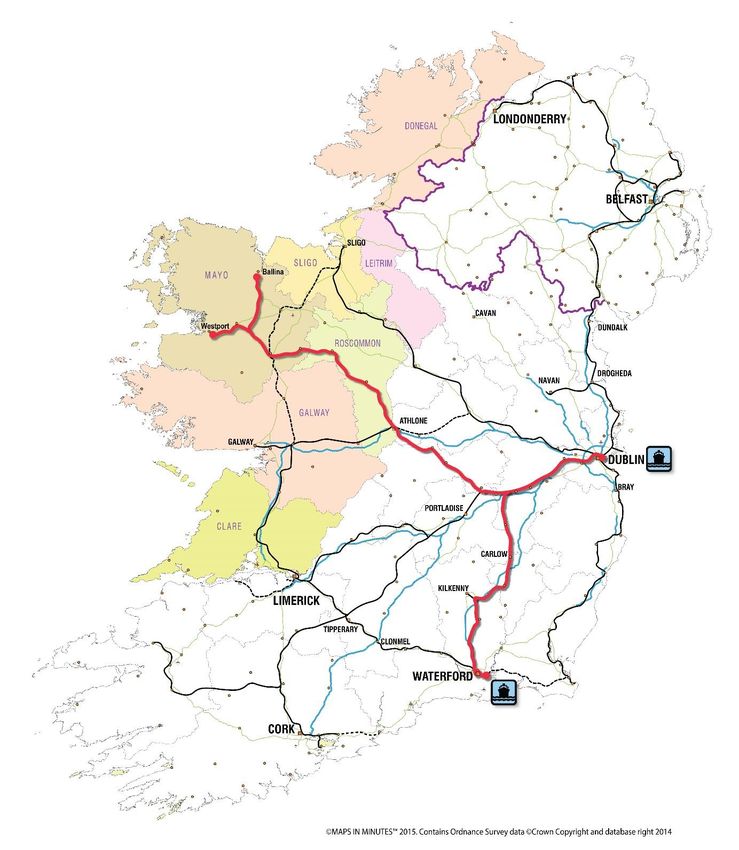
Copyright ©2015 Intermodality

All rights reserved. No part of this document may be reproduced or published in any form or by any means, including photocopying, storage
on computer or otherwise without the prior permission of the copyright holder.

                                                                                                                                 Page 2
Contents

1   Introduction....................................................................................................................................................... 4
    1.1      Remit ...................................................................................................................................................... 4
    1.2      Structure of this report ............................................................................................................................ 5
2   Rail freight international comparisons .............................................................................................................. 6
    2.1      Benefits of rail freight .............................................................................................................................. 6
    2.2      European Union...................................................................................................................................... 7
    2.3      Scotland ................................................................................................................................................ 10
    2.4      Denmark ............................................................................................................................................... 13
    2.5      New Zealand ........................................................................................................................................ 15
    2.6      United Kingdom (Great Britain) ............................................................................................................ 17
3   The national context for rail freight ................................................................................................................. 25
    3.1      Introduction ........................................................................................................................................... 25
    3.2      The role of transport in national public policy ....................................................................................... 25
    3.3      Port traffic ............................................................................................................................................. 29
    3.4      Road haulage traffic ............................................................................................................................. 29
    3.5      Rail freight traffic................................................................................................................................... 34

4   Opportunities for rail freight in the Western Region ....................................................................................... 38
    4.1      Economic activity .................................................................................................................................. 38
    4.2      Transport infrastructure ........................................................................................................................ 39
    4.3      Freight market potential ........................................................................................................................ 42
    4.4      Other prospects .................................................................................................................................... 58
    4.5      Summary .............................................................................................................................................. 59

5   Conclusions .................................................................................................................................................... 61
    5.1      Overview............................................................................................................................................... 61
    5.2      The potential for new rail freight traffic in, to and from the Western Region ........................................ 62
    5.3      The role of Government in fostering further mode shift to rail .............................................................. 64
    5.4      Conclusions & recommendations ......................................................................................................... 66
                    Types of rail freight service ........................................................................................................... 70
                    Review of incentives for intermodal (combined) transport ........................................................... 72
                    UK public policy framework for promoting rail freight ................................................................... 79
                    Table of previous rail services / commodities ............................................................................... 81
                    List of market research interview contacts ................................................................................... 82
                    Population by NUTS3 region, local authority and Western Region .............................................. 83

                                                                                                                                                                Page 3
1 Introduction
1.1 Remit
1.1.1 Ireland has a population of some 4.6 million in a landmass approaching 70,000km2 and an economy
generating around €164 billion of Gross Domestic Product (GDP), the seaports handling 46.7 million
tonnes of imports and exports. In 2014, road haulage lifted1 112 million tonnes and moved2 9.8 billion
tonne km, Irish Rail lifted 589,000 tonnes and moved 99 million tonne km, rail achieving a mode share
of all overland transport of 0.5% and 1.1% for tonnes lifted and tonnes moved respectively. In recent
years, Irish Rail has worked with end users to reverse the decline in rail freight traffic, and is exploring
opportunities to further grow traffic levels with the available resources at its disposal.
1.1.2 Three of the four rail freight services operated at present start or finish in the Western Region of Ireland,
at Ballina and Westport in County Mayo. The Western Development Commission (WDC), as part of its
remit to promote the economic and social development of the Western Region, has commissioned this
study to investigate the potential for further demand for rail freight services in, to and from the Western
Region, which comprises the counties of Donegal, Sligo, Leitrim, Roscommon, Mayo, Galway and
Clare.
1.1.3 As well as highlighting infrastructure deficits which may be impeding economic growth in the Western
Region, the WDC also supports the use of more sustainable transport modes, arising from the effects
on climate change. The WDC considers that as a more sustainable transport freight mode, especially
for high volume goods, coupled with the changed business model operated by Irish Rail and the growth
of revenue generating traffic, rail freight should be considered as an important element in the future land
transport mix for goods traffic.
1.1.4 The availability and further expansion of rail freight services (and the associated low carbon footprint
relative to road haulage) could help provide a regional advantage, attracting new enterprises which
might have a need for a high-volume, environmentally-sustainable transport solution. The WDC
therefore believes that it is important to understand and investigate whether there may be potential rail
freight clients who are not visible: this may be because they are not sure whether rail is an option for
them; and/or because they perceive no immediate price advantage to warrant use of rail. In addition,
economic growth and new enterprises, and any possible new policies and investment supporting
transport by rail, may generate new traffic which may not be evident in the short-term.
1.1.5 The purpose of this study is to prepare a report addressing the following key requirements:
To investigate the potential for new rail freight traffic in, to and from the Western Region;
To examine the extent to which new rail freight traffic might emerge if policy instruments change to
support a greater modal shift to rail freight.
1
“lifted” means the weight of goods carried by each mode of transport (in tonnes)
2
“moved” means the weight of goods carried, multiplied by the distance those goods were carried (tonnes multiplied by kilometres, known
as tonne km)
Page 4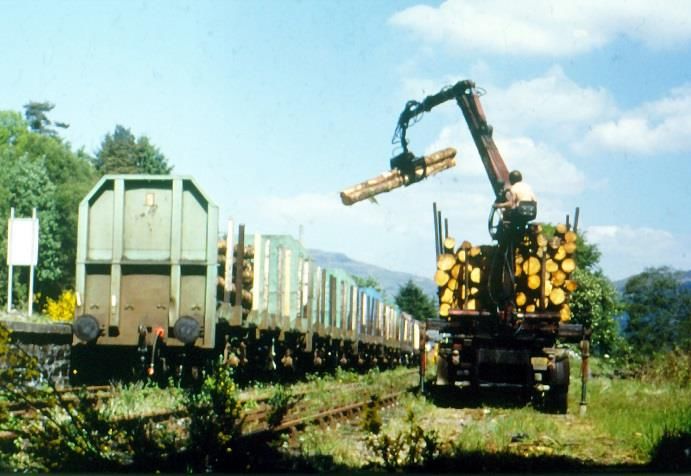
1.2 Structure of this report
1.2.1 This report sets out the main findings of the study, as follows:
Chapter 2 looks at the wider context of rail freight traffic development across Europe, followed by a
focus on selected countries including Scotland, New Zealand, Denmark and the UK, from which to
determine key factors influencing the changes in rail freight traffic in recent years;
Chapter 3 considers the Irish context for rail freight, from national economic, public policy and freight
market perspectives;
Chapter 4 sets out the opportunities for rail freight arising from market research and stakeholder
interviews;
Chapter 5 draws together the findings from the preceding sectors into a set of key conclusions and
recommendations.
1.2.2 In producing this report, we would like to express our thanks to the wide range of stakeholders who
have given up their time to give opinions and supply information, providing valuable local insight which
is reflected in the report.
1.2.3 This study has been undertaken within the context of the current rail network coverage and capability. In
the medium to long term, further development of the rail sector as a whole (passenger and freight) may
involve further investment in the network, including rolling stock, rail heads, strategic freight
interchanges and the reinstatement of disused routes.
Page 5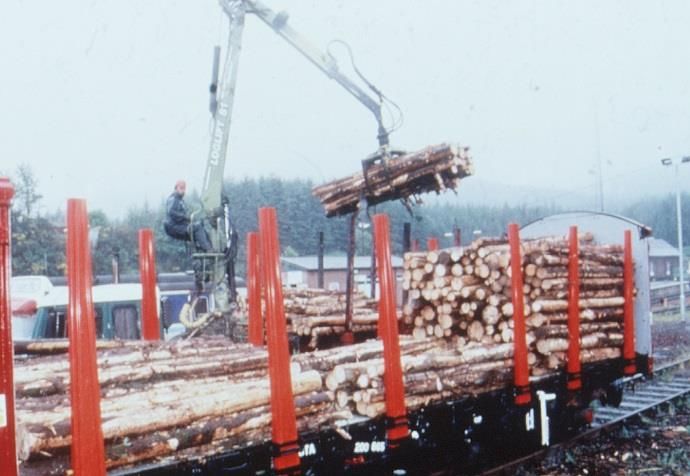
2 Rail freight international comparisons
2.1 Benefits of rail freight
2.1.1 Despite the relatively small volume of traffic moved by rail in Ireland compared to road, rail is often cited
by policy-makers (and the rail industry itself) as offering significant benefits over road haulage. These
can be summarised as follows:
Efficiency for transport users – a single locomotive and driver can move the equivalent of 18-50 lorry
loads of freight (based on current length / payload of freight trains in Ireland), simplifying transport
arrangements, particularly to and from sites where the road network would be unable to cope with
large volumes of goods vehicles (eg ports, quarries and power stations). Beyond simplifying
transport operations, movement of large traffic volumes by rail can help deliver direct economic
benefits to end users, not least by increasing inter-modal competition between road and rail;
Scheduling – the timetabling of freight trains implies a more predictable operation than relying on the
vagaries of the road network. The UK Freight Transport Association has undertaken end user
surveys in recent years which suggest that rail services achieve higher levels of reliability compared
to road haulage services on parallel routes, particularly across the motorway network;
Energy and emissions – for every tonne of freight moved one kilometre (ie 1 tonne km), UK statistics
indicate that rail generates 76% lower emissions than for road haulage (see below). This has a close
correlation with fuel consumption. Tesco has cited the use of rail within the UK in helping reduce its
overall carbon footprint by 50% in recent years, with its first dedicated daily rail freight service in the
UK (Rugby to Glasgow) saving around 3,000 tonnes of CO 2e in its first year of operation;
National economic benefits – beyond the direct economic benefits to end users from use of rail, the
economic activity associated with rail freight (investment, revenue and wages associated with rail
freight services, rail network infrastructure, rail-served ports and distribution parks) can make a
positive contribution to the national economy. The availability of rail freight facilities and services may
also help influence global decisions on foreign direct investment (FDI) between target countries. It
should be noted however that where a rail freight service displaces existing road haulage operations,
this may then create localised disbenefits (loss of income / employment) in the road haulage sector;
Other societal / indirect benefits: use of rail transport, in helping reduce road traffic (in absolute terms
of in its onward rate of growth), provides indirect support to reducing the impacts of road transport on
society. This may include reduced traffic congestion and the improved productivity of road transport
users, a reduction in road maintenance costs or reduced road traffic accidents. The Rail Delivery
Group estimates that rail freight in the UK prevents around 600 road casualties per annum.
2.1.2 In environmental terms, the latest UK data3 indicates that the combined emissions of greenhouse
gases4 for freight moved by rail is 0.02831 kg of CO2e per tonne km, compared to 0.08793 kg CO2e per
tonne km for articulated lorries and 0.1232 kg CO2e per tonne km for all lorries – rail therefore
generates between 23-32% of the level of emissions of road haulage.
3
DEFRA website http://www.ukconversionfactorscarbonsmart.co.uk/
4
Includes direct emissions of CO2, CH4 and N2O from the combustion of fuel from owned/controlled transport, and indirect emissions
associated with the extraction and transport of primary fuels as well as the refining, distribution, storage and retail of finished fuels
Page 6
2.1.3     In taxation alone, the UK Rail Delivery Group (railway industry body) estimates that the five largest rail
          freight operators pay over €200m a year to the Exchequer in directly attributable taxes5 and €91m a
          year in track access charges to Network Rail6. This needs to be considered against the c.€27m paid out
          by Government in rail freight grants (most of which ends up with the rail freight operators), as well as
          the fixed cost component of freight track access charges which are paid by Government or Network
          Rail, estimated at around €200m7. This suggests the rail freight industry makes a net contribution of
          €64m per annum.

2.1.4     At the wider societal level, a recent study for the UK Department of Transport suggests that every £1 of
          grant paid in support of intermodal rail services (Mode Shift Revenue Support) produces societal
          benefits estimated at £4.27.8

2.1.5     These benefits suggest that, at a European and national level, rail should enjoy a much greater share of
          freight traffic than at present. The challenges in recent years have been a highly-competitive road
          haulage industry (over 80,000 Irish-registered goods vehicles alone9), a general lack of visibility of the
          rail freight offer, a lack of detailed knowledge and understanding amongst train operators of the
          equivalent road haulage offer, and in some cases the quality of the rail offer itself.

2.1.6     In terms of economics, the need to rely on road haulage at one or both ends of a rail haul (given the
          relative lack of rail network coverage) brings a disproportionately high level of road costs (and
          roadrail transfer costs) into the overall “door-to-door” price set by road haulage, reducing the amount
          of revenue left for the train operator to cover the costs of the rail service. In Ireland, particular
          challenges have been a relatively small number of freight terminals, locomotives, wagons and staff, with
          high track access charges and a lack of any government rail freight incentives.

2.2       European Union

2.2.1     Achieving a definitive comparison between Ireland and other EU Member States is made more
          challenging by the peripheral island position of Ireland, lacking the cross-border rail freight flows of
          mainland Europe and, to an extent, the UK10. The experience of the UK is set out later in this chapter,
          but in an attempt to achieve more of a comparable assessment to Ireland, similar-sized states / regions
          (Scotland, New Zealand and Denmark) are then considered to provide alternative perspectives.

2.2.2     At a European Union (EU) level, the equivalent rail share of all road and rail transport (for tonnes
          moved) is 19% (17.8% if inland waterways are also included). Rail mode share ranges from 64% in
          Latvia (a country of similar size to Ireland) to 1.1% for Ireland, the lowest of all Member States.

2.2.3     This is not to suggest that Ireland is necessarily “off the scale” in terms of rail freight mode share, as
          Spain (six times the size and more than 10 times the population of Ireland) has a 4% mode share.
          However it remains the case that on average EU Member States have much greater levels of rail freight
          traffic and higher rail freight mode shares, which not only reflects the respective geography /
          topography, economics / trade, demographics and infrastructure, it also reflects greater emphasis on
          rail freight in public policy, including through grants and other fiscal instruments.

5
  Keeping the lights on and the traffic moving: Sustaining the benefits of rail freight for the UK economy, Rail Delivery Group May 2014
6
  Source UK Office for Rail & Road
7
  Estimating Freight Avoidable Costs: Final Report, LEK October 2012 (net cost estimates ranged from £42m to £249m per annum)
8
  Department for Transport Review of Revenue Support Freight Grant Schemes Summary Report, Arup 2014
9
  Source CSO
10
   Strictly speaking, Great Britain, as no freight services currently operate in Northern Ireland

                                                                                                                                     Page 7
2.2.4     A recent report for the European Commission DG-MOVE11 into the use and promotion of intermodal
          and multimodal freight transport12 has noted the benefits of rail in reducing greenhouse gas emissions,
          as well as road traffic / accidents and associated indirect costs. On some major trans-continental
          corridors (including to/from China) rail plays a major role in relieving parallel highway routes of lorry
          traffic. Yet the report also noted the challenges in making more use of rail, including problems with the
          marketing and quality of rail services and a lack of suitable infrastructure. In some cases, there remains
          an apparent lack of interest from some Member States in implementing EC policies (and a specific
          Directive13) designed to make rail transport more attractive, primarily by reducing the costs of road
          haulage at one of both ends of a rail service (ie by reducing vehicle taxes or driving restrictions for
          lorries moving containers to and from railheads). The report also reviewed a number of programmes in
          place amongst Member States for supporting rail and intermodal (road/rail) services, which is attached
          in Appendix B.

2.2.5     Part of the explanation for the difference in the level of rail freight traffic in Ireland over other Member
          States has been the cost of rail services in Ireland relative to road haulage, which in part reflects the
          costs of using the rail network. A study undertaken for the European Transport Forum in 2008 14 looked
          at track access charges for passenger and freight services across most EU Member States (excluding
          Ireland), with the key results for freight summarised in Figure 1 below. By comparison, the rate of track
          access currently applied in Ireland (€0.01 per gross tonne km) would equate to around €9.3 per train-
          km, higher than any of the rates shown below.

          Figure 1 Track access charges for a 960 tonne (gross) train, € per train km 15

                                                             IRELAND

11
   Analysis of the EU Combined Transport Final Report, KombiConsult, Internmodality, Planco and Gruppo CLAS for EC DG-MOVE
12
   “Intermodal” typically implies at least two modes of transport in a transport chain, eg a truck (mode 1) moves a container from a
despatching customer to a nearby railhead for onward shipment by rail (mode 2), with a truck (mode 1) collecting the container at the other
end to deliver to the receiving customer. “Multimodal” typically implies at least three modes of transport, eg a truck (mode 1) delivers a
container to a port, where a ship (mode 2) then moves the container to another port, where a train (mode 3) then moves the container to an
inland railhead where a truck (mode 1) makes the final delivery. As the terms “intermodal” and “multimodal” are often used to describe
similar transport operations, the European Commission tends to group these under the heading of “Combined Transport” or CT
13
   Council Directive 92/106/EEC of 7 December 1992 on the establishment of common rules for certain types of combined transport of
goods between MS. See http://eur-lex.europa.eu/legal-content/EN/TXT/?uri=CELEX:31992L0106 for further information
14
   http://ec.europa.eu/transport/modes/rail/doc/2008_rail_charges.pdf
15
   European Transport Forum http://ec.europa.eu/transport/modes/rail/doc/2008_rail_charges.pdf

                                                                                                                                   Page 8
Incentives for rail and intermodal freight services
2.2.6 The European Commission’s former “Marco Polo” mode shift programme (which closed in 2013)
provided grants to offset the costs of starting up new intermodal and multimodal freight projects, the
level of grant based on rail’s societal advantage over road estimated at €0.004 per tonne km. The
Commission is currently considering a possible replacement for the Marco Polo programme.
2.2.7 In the EU, the UK and four other Member States (BG, CZ, DK, PL), provide discounted track access
charges, either just for intermodal (container) trains, or for all freight trains (BG), compared to the
standard tariffs. The level of support varies considerably between Member States. In Poland rail
network access charges for intermodal services are reduced by 25%, in Bulgaria by 30-37%, and by
45% in the Czech Republic. Train operators in Denmark can even recover the total access charges if
they achieve a certain amount of tonne km.
2.2.8 The impact of this incentive on intermodal rail services primarily depends on the general level of access
charges and its relationship with taxes and fees charged on road freight transport. If the rail track
access charges were high prior to the reduction, even a strong cutback may not yield major growth in
traffic. There is also the risk of distorting on-rail competition by making intermodal services more cost-
effective than “conventional” rail services (ie those moving bulk products in purpose-built rail wagons). It
is also important to ensure, as far as possible, that (as anecdotal evidence in the UK suggests) train
operators do not deliberately inflate their haulage prices, so as to capture the benefits of the incentives
that would/should otherwise be passed onto the end customers.
2.2.9 Beyond reductions in track access charges, a wide range of other measures have been implemented in
other Member States to promote greater use of rail freight and/or intermodal rail services, with most of
these having secured State Aid clearance from the European Commission. In our recent study for DG-
MOVE we assessed the various measures and compared them as follows.
2.2.10 At EU level, the 1992 Directive on Combined Transport (the CT Directive) contains provisions which
oblige Member States to encourage greater use of rail and other modes by reducing the costs of road
haulage at either or both ends of the rail haul, primarily by reducing / reimbursing vehicle taxes for those
vehicles moving containers to and from a railhead. Other similar measures designed to support rail /
intermodal freight in the EU fall within the following groups:
Exemption from road vehicle tax (extending the scope of the CT Directive);
Exemption from or reimbursement of road infrastructure charges;
Derogation from Directive 96/53/EC16 allowing higher weights or dimensions of heavy good vehicles;
Exemptions from weekend / overnight driving bans for road vehicles, allowing movements to and
from railheads when other deliveries by road are not permitted;
Reduced rail network access charges;
Aids (direct grants) for operations;
Aids (direct grants) for investments in intermodal terminal infrastructure;
16
Council Directive 96/53/EC of 25 July 1996 laying down for certain road vehicles circulating within the Community the maximum
authorized dimensions in national and international traffic and the maximum authorized weights in international traffic
Page 9
Aids (direct grants) for investments in intermodal equipment.
2.2.11 Despite these measures and the CT Directive obligations, our analysis concluded as follows:
Ireland and 2 other Member States (Lithuania and Malta, the latter having no rail network) provide no
incentives and have yet to transpose the provisions of Article 6.1 of the CT Directive (on the
reduction of road vehicle tax for lorries moving freight to and from railheads) into national legislation;
17 out of the other 28 Member States fully comply with Article 6.1 of the CT Directive and have
adopted schemes for the reimbursement of vehicle taxes. This is also the type of incentive mostly
applied in the EU. Romania has prepared a vehicle tax incentive but has not yet implemented this,
due to public budget constraints;
7 other Member States (Cyprus, Estonia, Finland, Greece, Luxembourg, Romania, and Sweden)
have not enforced any other incentive for CT operations beyond that provided by the CT Directive.
2.2.12 Further analysis of the various incentives is given in Appendix B.
2.3 Scotland
2.3.1 Scotland is similar to Ireland in land mass, population, GDP and total road/rail freight market (see Table
1 below), and at first glance has much higher rail freight traffic and rail mode share:
Table 1 Ireland and Scotland key statistics17
Statistic Ireland Scotland Scotland / Ireland
Land mass (km2) 69,798 78,807 13%
Population 4,581,269 5,327,700 16%
GDP (bn) € 164 € 190 16%
Road network (route km) 96,525 55,961 -42%
Rail network (route km) 1,919 2,763 44%
Domestic road freight (m tonne km) 9,772 7,173 -27%
Domestic rail freight (m tonne km) 99 1,181 1093%
Total domestic road/rail freight (m tonne km) 9,871 8,354 -15%
Rail mode share (of above total market) 1% 14% 1358%
2.3.2 A number of observations can be made to help explain the difference in rail freight traffic between the
two countries, as follows:
Rail freight traffic in Scotland has been dominated by bulk mineral / ore traffic (mainly coal),
accounting for nearly 50% of all rail freight moved to, from or within Scotland (rail freight figure above
only relates to domestic freight, for which no commodity breakdown is available). In recent months,
coal traffic has been impacted by changes in UK policy on coal-fired power generation, which has
caused a dramatic reduction in coal moved by rail across the UK. This in turn will have caused a
significant reduction in the overall volume of domestic Scottish rail freight, albeit offset by the
17
Source CSO, DTTAS, Eurostat, Transport Scotland, 2011-2014 datasets
Page 10remaining cross-border traffic in other commodities (a further 1,426 million tonne km), particularly
intermodal services from ports and supermarket distribution centres;
The slightly larger land mass, greater population and GDP, as well as the considerable differences in
road and rail network coverage in Scotland (smaller road network and larger rail network relative to
Ireland) may partly explain why more traffic is moved by rail in Scotland;
Despite major rationalisation of railheads in the UK between the 1950s and 1990s, a number of
railheads remain in Scotland, including several in the Far North where road access is less
favourable;
Government policy in Scotland supports and promotes use of rail for freight movement, principally for
environmental reasons and relief of road traffic. Like the national Department for Transport, the
Scottish Government has produced transport policy documents, including an action plan for freight,
which inter alia seek to safeguard existing infrastructure and (in the case of the Borders Railway)
reinstate disused rail corridors (see also later in this section);
Rail freight grants are available to support both new capital investment (Freight Facilities Grant) and
revenue (Mode Shift Revenue Support), which have helped support trial services and longer-term
contract services. Scottish Enterprise (a publicly-funded development agency) has also supported
feasibility studies and pilots for new rail freight services, for example movement of timber out of
Scottish forests (see below), whilst the Scottish Forestry Commission has also provided grant
funding for a new permanent railhead to be established at Rannoch. State funding has also been
matched by European Regional Development Funding (ERDF) to support a trial service for whisky
traffic (outbound product and return loads of empty casks) between Elgin and Grangemouth;
Network Rail and its predecessor Railtrack have worked with end users to facilitate new services, an
example being flows of timber from forests in the Far North of Scotland, where loading on the main
line has been authorised during periods between passenger train services, to avoid the need to
create permanent interchanges and minimise the length of road haulage required between source
and railway (see Figure 2 below).
Figure 2 Timber being loaded on the main line in Scotland
Page 112.3.3 Excluding coal traffic, Scottish rail freight services include the following:
Domestic (within Scotland, 1,181 million tonne km)
Daily intermodal services linking Mossend (Glasgow) with Aberdeen (284km each way) and
Grangemouth with Inverness (215km each way), carrying northbound containers of largely
supermarket goods for store delivery, some backloaded with exports from Scottish suppliers
destined for distribution centres in England’s Midland region. A daily intermodal service has also
linked Grangemouth port with Elderslie (56km each way), related to whisky traffic;
Municipal waste moved in containers on a daily intermodal service from Edinburgh to a remote
landfill site at Oxwellmains (48km each way);
Cement from Oxwellmains to Motherwell (112km each way), Aberdeen (255km each way) and
Inverness (331km each way);
Petrochemicals from Grangemouth to Kilmarnock (79km each way), Prestwick Airport (98km each
way) and Lairg (368km);
Cross-border (with England and Channel Tunnel, 1,426 million tonne km)
Steel slab from the North East of England to Glasgow (for local steelworks);
Alumina and fuel oil from England to Fort William (for local aluminium factory);
China Clay from mainland Europe to Irvine and Aberdeen via the Channel Tunnel (for local paper
mills);
Cement from Oxwellmains to the North of England;
Petrochemicals from Grangemouth to the English Midlands and South East;
Steel pipes from the North East of England to the Far North of Scotland (for the offshore oil industry);
Municipal waste in containers from Manchester to landfill site at Oxwellmains;
Imported trade cars from London to Glasgow;
Deepsea intermodal services between Glasgow and English East / South coast ports;
Inland intermodal services linking Glasgow and Grangemouth with the English Midlands regions, for
logistics companies and supermarkets;
High-speed (160kph) mail traffic between Glasgow, Liverpool and London;
Wagonload traffic moved in trainload quantities for multiple end users to/from the North West and
South of England.
2.3.4 A recent Scottish Parliamentary Inquiry into freight 18 has produced a set of conclusions of relevance to
the discussion on the current policy framework in Ireland (see Chapter 3):
18
Scottish Parliament Infrastructure and Capital Investment Committee: Inquiry into freight transport in Scotland, report 29/06/15
Page 12The movement of freight is essential to the Scottish economy. The free flow of freight within Scotland,
between Scotland and the rest of the UK and between Scotland and the rest of the world is of critical
importance to the Scottish Government target of sustainable economic growth. At the same time, the
transition to a low carbon economy remains a key priority of the Scottish Government. Therefore,
increasing the efficiency and cost effectiveness of freight transport and providing the infrastructure for
unobstructed movement of goods are both cornerstones of this inquiry into freight transport in
Scotland.
Given the need to reduce greenhouse emissions, it is clear that a combination of model shift and the
development of new technology is essential in minimising carbon emissions. Whilst the Committee
acknowledges the need for all those involved in freight transport to contribute to this reduction in
emissions, it recommends that this should be a prevailing theme in an updated freight transport
policy.
A key recommendation of the Committee is for the Scottish Government to consider the need for an
urgently updated freight transport policy taking account of changing trends in the freight transport and
wider logistics sectors, addressing all modes and considering transport within its wider logistics
context.
The Committee recommends that the next National Planning Framework (NPF) ensures that rail
freight is treated as being of major strategic importance and that strategic rail hubs are given
appropriate priority. Whilst the Committee appreciates restrictions around state aid, it calls on the
Scottish Government to help maximise the drawdown of all available EU funding for freight transport
projects.
2.4 Denmark
2.4.1 Denmark has a larger population in a smaller land mass (see Table 2 below) which again has much
higher rail freight traffic and rail mode share than Ireland.
Table 2 Ireland and Denmark key statistics19
Statistic Ireland Denmark DK / Ireland
Land mass (km2) 69,798 42,895 -39%
Population 4,581,269 5,627,235 22%
GDP (bn) € 164 € 249 52%
Road network (route km) 96,525 73,574 -24%
Rail network (route km) 1,919 2,646 38%
Road freight (m tonne km) 9,772 16,120 65%
Rail freight (m tonne km) 99 2,614 2540%
Total road/rail freight (m tonne km) 9,871 18,734 90%
Rail mode share (of above total market) 1% 14% 1339%
19
Sources as above (for Ireland) and DK Ministry of Transport, 2011-2013 datasets
Page 132.4.2 Despite the smaller Danish land mass, some of the factors which can explain the higher use of rail
include a significant portion of cross-border rail freight (124m tonne km of intermodal rail traffic alone),
greater population, GDP and total freight market, and a larger rail network.
2.4.3 The Danish Government policy on freight is currently based on a 2008 initiative, “Sustainable Transport
– Better Infrastructure” and subsequent 2009 “A Green Transport Policy”. A policy paper issued in 2009
sets out the key features of freight policy, including:
The Danish Ministry of Transport works for an efficient, innovative and environmentally friendly freight
transport, in which the development and the dynamics are characterised by a close interaction
between all players. Freight transport is an important cornerstone in the Danish economy and a
declared focus area in realising the objective of creating a greener transport sector.
The [2009] political agreement involves a strengthening of the hinterland infrastructure to Danish
ports in the shape of better road and rail connections to ports of great national or regional importance.
The Danish Government and Parliament can make a difference, however port boards and harbour
companies must exploit the framework themselves in order to secure growth and prosperity in each
individual port. As far as rail is concerned, there seems in particular growth potential for increasing
the rail market share on long international distances within Europe, not least for transit traffic through
Denmark. Denmark is and will increasingly be a transit country for international freight transport. As a
nation we must face this fact and use it offensively.
Well-functioning transport and logistics systems are required for the products to get from
manufacturers to the industry and the consumers in the large cities and export markets. The markets
are seldom localised near the manufacturers. Jutland accounts for a great share of the Danish
production, whereas the consumers are spread throughout the country. Efficient transport systems
are a central competitive parameter for the respective countries and an important factor when
companies choose a location.
2.4.4 The policy paper sets out the three overall objectives for the freight transport sector:
An efficient, innovative and value generating freight transport (sector). The national freight transport
trade must contribute to Danish companies getting access to efficient logistics and each individual
person getting access to a wide variety of goods;
Freight transport trade must develop in healthy competition. Legislation and rules need to contribute
to fair competition and be as simple as possible. The costs of new regulation should bear
comparison with the benefits;
Freight transport needs to be greener. Freight transport must contribute to a reduction of the costs in
relation to the environment and greenhouse gases. The individual transport buyer ought to be the
one deciding the given type of transport, but the option and incentive to choose environmentally-
friendly solutions must be better. All forms of transport are to be developed in a more
environmentally-friendly direction, and the most environmentally-friendly types of transport must take
a larger share of traffic.
2.4.5 The state-owned rail freight operation was privatised in 2001 to Railion, the operation subsequently
absorbed into a 2008 joint venture between DB Schenker and Green Cargo (51:49 shareholding
respectively), known as DB Schenker Rail Scandinavia (DBSRS), which moves around 6 million tonnes
of freight per annum.
Page 142.4.6 Rail freight has attracted support from Government, which has led to a sustained increase in rail’s
modal share. From 1991 to 2009 rail had an average 7-9% share of inland freight, which has since
grown to 12-14% since 2009. Despite this, the local sentiment from DBSRS suggests this share
could/should be much higher. Gottfried Eymer, CEO of DBSRS, has expressed frustration with the
factors limiting further growth in rail freight. Citing the need for a sustainable and supportive political
environment to help utilise the potential for rail freight in Denmark, he believes the competitive
disadvantages for rail include:
No master plan for freight transport in Denmark;
Road fees for trucks have been abandoned;
Highest rail infrastructure and terminal costs in Europe;
Uncertain framework conditions for environmental subsidies and rail infrastructure investments.
2.4.7 Comparing the situation in Denmark with that in Austria (where rail has a 61% mode share against a
39% road share), Mr Eymer notes the various incentives available in Austria, including:
Up to 30% subsidy for investment in trailers, swap bodies or containers for intermodal use;
Up to 50% subsidy for investment in terminals;
Road pricing averaging €0.36 per km.
2.5 New Zealand
2.5.1 New Zealand is similar in population and GDP (see Table 3 below), but again has much higher rail
freight traffic and rail mode share.
Table 3 Ireland and New Zealand key statistics20
Statistic Ireland New Zealand NZ / Ireland
Land mass (km2) 69,798 268,021 284%
Population 4,581,269 4,578,900 0%
GDP (bn) € 164 € 149 -9%
Road network (route km) 96,525 94,301 -2%
Rail network (route km) 1,919 4,000 108%
Domestic road freight (m tonne km) 9,772 22,014 125%
Domestic rail freight (m tonne km) 99 4,585 4531%
Total domestic road/rail freight (m tonne km) 9,871 26,599 169%
Rail mode share (of above total market) 1% 17% 1677%
20
Sources as above (for Ireland) and NZ Ministry of Transport, 2011-2013 datasets
Page 152.5.2 In comparing the results, it is apparent that New Zealand has a much larger land mass and rail network
compared to Ireland. In addition, the New Zealand Government has invested heavily in its state-owned
rail network and services as part of a multi-modal approach to freight transport planning, noting:
Our rail, maritime and aviation sectors also have a critical role to play in our supply chains and
moving our people daily. We need to ensure the different modes are fully integrated.
When the government purchased the rail system in 2008, the business was in poor shape. After
careful review, the incoming government invested substantially in the rail network. Through the
KiwiRail Turnaround Plan, $4.6 billion will be invested in rail over 10 years to improve the quality of
rail infrastructure and to support KiwiRail to become a commercially viable business.
Rail currently moves 15 percent of the national freight task. With projected growth in freight over the
next 3 decades, an efficient rail freight network will play an important and complementary role to road
freight to maintain access to our key ports. Rail is well placed to move heavy products over longer
distances. The Turnaround Plan aims to improve rail’s overall capacity and ability to efficiently and
effectively meet the requirements of freight shippers. A successful turnaround will enable rail to
complement, as well as compete with, other modes.21
2.5.3 In July 2008 the Government purchased Toll New Zealand's rail and ferry businesses. The Crown
already owned the network infrastructure. From 1 October 2008, KiwiRail became the single entity
responsible for national rail services, some Cook Strait ferry services, and rail infrastructure.
2.5.4 In 2010 the Government agreed to contribute to the KiwiRail Turnaround Plan, a strategic plan which
aims to help the rail freight business become self-sustaining. The Government noted that the additional
investment in rail will help support the Government plans to improve New Zealand’s productivity and
export-led economic growth and increase the resilience of the transport system.
2.5.5 In 2012 KiwiRail restructured its balance sheet. KiwiRail Group’s freight, passenger, infrastructure and
ferry businesses, together with rolling stock, rail infrastructure and plant and equipment were transferred
from the New Zealand Railways Corporation into KiwiRail Holdings Limited. The KiwiRail Group
comprises KiwiRail Holdings Limited and its subsidiaries. The KiwiRail Group has been designated as a
Profit Oriented Entity. KiwiRail Group carries assets valued at approximately $1billion, reflecting the
revenue they generate, rather than the previous value of approximately $7.8 billion.
2.5.6 New Zealand Railways Corporation continues to hold 18,000 ha of rail network land, from which no
financial return will be expected. The sole purpose of New Zealand Railways Corporation is to retain the
railway land and make it available for use by KiwiRail.
2.5.7 In the first three years of the Turnaround Plan the Government contributed $750 million (around 0.1% of
national GDP), with a further $94 million in 2013/14 and $198 million in 2014/15. KiwiRail is also
contributing funding from its retained earnings to support the development of the Turnaround Plan. The
majority of this investment has been in the freight side of the business.
2.5.8 As a result of the investment, KiwiRail increased its revenue over the first three years of the Turnaround
Plan by over 25%, despite a trading climate affected by the global economic slowdown and the ongoing
impact of the Christchurch earthquakes. Rail services remain focused primarily on freight (particularly
bulk freight) with limited passenger services on some lines.
21
NZ Ministry of Transport
Page 162.5.9 KiwiRail now carries approximately 15% of freight moved in New Zealand (measured in tonne-
kilometres) by road, rail and coastal shipping. The freight business is based on four main components –
movement of bulk commodities such as coal and fertiliser, movement of goods to and from ports, a
specialised forestry business, and a domestic business which largely serves the freight-forwarding
sector.
2.5.10 The Government has noted that the Turnaround Plan has provided wider economic benefits, including:
Enabling the option of port aggregation to ensure New Zealand exports remain competitive - rail has
been used to convey cargoes over longer distances to larger ports (the withdrawal of major liner
services from Timaru and New Plymouth are two examples where this has happened);
Providing alternative transport options to enable a more efficient domestic freight market;
The freight forwarder market has continued to grow and some of the major players in the sector have
invested in rail-served depots to take advantage of cost savings, capacity flexibility and rail’s “green”
credentials - Mainfreight has allocated $60 million for investment in new railheads, while Fonterra
has invested $130m in a new rail hub complex in Hamilton and another planned for Mosgiel;
Major exporters and importers have increased the use of rail. More than 30% of New Zealand’s
export goods travel on rail. Rail offers service flexibility to optimise shipping and port selection;
Contributing to resilience in the freight transport system - KiwiRail ensured the movement of cargo
during the Port of Auckland strike, the Manawatu Gorge closure, and after the Christchurch
earthquake;
Providing direct economic savings - direct economic savings include fuel and driver time savings
compared to road, avoided road maintenance costs, and reduction in externalities such as road
accidents and greenhouse gases.
2.6 United Kingdom (Great Britain)
Background
2.6.1 At the time of privatisation in the mid-1990’s, rail freight traffic levels in GB had fallen to an all-time low
(excluding the impact of the miner’s strike in 1984): from 36 billion tonne kilometres in 1954, when rail
had a 40% share of all freight moved in the UK, to 13 billion by 1993 when rail’s share had fallen to just
6%22. By this time, most of the non-bulk traffic (eg manufactured goods, general merchandise and
parcels) had stopped being carried by rail, with little or no traffic carried for supermarkets or logistics
operators.
2.6.2 The reasons for the post-war decline in rail freight were varied, but major causes included structural
decline in the core bulk markets (eg coal, steel, petrochemicals) and in domestic manufacturing
(including automotive), at a time of rapid expansion of the trunk road network and the road haulage
industry, a period marked by consistent under-investment in the rail network, and rail freight services in
particular.
2.6.3 The decline in rail freight traffic led to (and in some cases was led by) rationalisation of freight train
services, particularly for non-bulk traffic such as manufactured goods. This traffic tended at the time to
be carried in individual wagonloads, requiring time-consuming and costly shunting at each end between
marshalling yards and small private rail terminals. Most of this traffic had disappeared by the time of
privatisation.
22
Collated statistics from UK Department for Transport and Office of Road & Rail
Page 172.6.4 Government officials at the time were reportedly expecting an almost complete exit for rail from the
freight market post-privatisation, with the exception of specific commodities which could not easily be
moved by road (eg power station coal, aggregates and nuclear material).
2.6.5 In parallel, the extensive network of rail freight terminals and ‘hub’ marshalling yards (which previously
fed a wide range of non-bulk and wagonload traffic into the rail system) saw continuous rationalisation
from the 1950’s onwards, from 4,500 to less than 1,000 by the time of privatisation, with most of the
remaining facilities being geared more for bulk commodities such as aggregates than for general
merchandise and logistics traffic.
2.6.6 In the intervening years, Britain’s economy has become increasingly dependent on road haulage to
distribute goods, both for long-distance ‘trunking’ and for local delivery. From the 1990’s onwards the
sustainability of this approach has been challenged commercially by road congestion and fuel prices
(protests in 2000, 2005 and 2007 caused major disruption to transport and logistics), together with
concerns from business and society about climate change. In response, the Corporate Social
Responsibility (CSR) policies of major companies have become increasingly focussed on means to
promote more sustainable business methods, such as Marks & Spencer’s ‘Plan A’. 23
Public Policy
2.6.7 Since 1999, the UK Government has set out a strategy for addressing climate change by promoting
more sustainable means of development and distribution, through a policy framework for land use and
transport planning, which spans both national and regional agendas. These policies have been the
subject of intense review in recent years, through pivotal reports produced by Sir Nicholas Stern, Kate
Barker and Sir Rod Eddington.
2.6.8 Government policy acknowledged the emerging challenge on ‘sustainability’ concerns raised at the
Kyoto summit in 1997 about the wider effect of greenhouse gases on climate change. Since then, a
comprehensive framework of policies has developed to create conditions favourable to, and
fundamentally in support of, the planning and development of rail freight services and infrastructure (see
Appendix C)
2.6.9 In terms of rail track access charges, the principle of charging freight on a marginal wear and tear basis
(as opposed to full cost recovery) has been established in the UK for several years, with the Rail
Regulator setting charges on this basis back in 2001. The Regulator concluded at the time24 that freight
train operators should not pay either the fixed costs related to freight use of the network, or those costs
which were common between freight and passenger operations for use of the existing network. Freight
track access charges should reflect the variable costs of freight operations, incorporating a factor to
take account of reduced costs imposed by “track-friendly” wagon suspension.
2.6.10 Where the capacity or capability of the existing network was improved and the new facility was then
used by freight operators, the Regulator expected freight operators to pay for any associated fixed costs
not funded from other sources. A similar principle would apply to freight-only lines.
2.6.11 The Regulator determined that freight track access charges should be set taking a longer-term view of
efficiency which takes account of the differences between passenger and freight operations, ie:
23
Marks & Spencer website http://corporate.marksandspencer.com/plan-a/about-plan-a
24
http://webarchive.nationalarchives.gov.uk/20131001175041/http://www.rail-reg.gov.uk/server/show/nav.181
Page 18 Some freight traffic faced significant competition from other modes meaning that some freight traffic,
which would be economic in the longer-term based on realistic improvements in efficiency, might not
be viable unless these efficiencies were immediately reflected in charges;
Freight customers often had to incur significant sunk costs when they switched between transport
modes, meaning that traffic priced off the network as a result of higher access charges in the short
term might not return to rail for the foreseeable future; and
The sunk costs of entry into rail freight markets meant that high or uncertain access charges were
likely to act as a significant barrier to entry.
2.6.12 The long-run efficiency assumptions were not applied to movements of coal for the electricity supply
industry or iron ore on the basis that in these markets rail already had a high market share with a clear
competitive advantage over road.
2.6.13 These principles have remained in place ever since, with further minor reductions in access charges in
the intervening years to reflect continued work by (and pressure on) Network Rail to reduce its costs. In
practical terms, the 2001 decision effectively removed most of the fixed access charge element for rail
freight, reducing track access charges from a headline rate of €0.006 per gross tonne km to €0.002 per
gross tonne km, 40% lower than the current rate of track access applied in Ireland.
Performance since restructuring
2.6.14 As the main alternative mode of inland transport to road haulage, the UK rail freight industry has during
the last 50 years moved from being the dominant mode of freight transport, to near extinction, to a
dramatic turnaround in fortunes. Rail freight traffic has now grown by 75% 25 since the mid-1990’s, and
after rapid and substantial investment, the industry structure is now consolidating and maturing, to the
extent that major shipping lines, manufacturers, retailers and distributors now use rail as an integral part
of their supply chains and are looking to increase the volume of goods moved by rail.
2.6.15 Despite the recent economic downturn, total rail freight volumes (excluding Network Rail maintenance
traffic) grew by 20% between 2003-4 and 2013-4. Bulk traffic (primarily coal, construction materials, iron
and steel, petrochemicals) continued to represent the majority (65%) of freight carried by rail, with new
growth sectors including biomass and feedstock for waste-to-energy plants. Yet the main source of new
traffic growth has been in the non-bulk sector of the market, particularly in traffic for major supermarkets
and third-party logistics companies (3PLs), where rail is increasingly used between ports and inland
distribution centres (DC) as well as between inland DCs.
2.6.16 The Network Rail Freight Market Study (2013) described current and forecast levels of rail freight traffic.
Overall, since 1995 rail has increased its market share of domestic freight moved in Great Britain to
11%. Average haul length per train has increased in recent years and average payload per train has
increased by about 19% since 2005, a significant improvement in productivity. Growth has been
particularly marked in the intermodal sector, as noted by Network Rail:
25
Collated DfT and ORR statistics
Page 19Ports and Channel Tunnel intermodal has grown at about 4% per annum. Domestic intermodal traffic
has also increased by about 4% per annum, but the underlying growth in this traffic, related to fast
moving consumer goods (FMCG), is about 9% per annum. By 2011 total intermodal traffic, at over 18
million tonnes, was at a similar level to construction tonnage, and was only exceeded by coal traffic
(44 million tonnes). Within the intermodal total, ports intermodal traffic predominates, at 15 million
tonnes compared with less than 3 million tonnes for domestic intermodal traffic and less than 1 million
tonnes for Channel Tunnel intermodal.
2.6.17 In terms of tonnes moved by rail, growth in tonne kilometres has been even more dramatic, doubling
over the last 10 years. Network Rail noted that:
Ports and domestic intermodal (excluding Channel Tunnel through rail intermodal traffic) has
increased by an average of 6% per annum over the decade to 2011. The intermodal sector has
performed well during the current recession. In 2011, ports and domestic intermodal traffic, at over 6
billion tonne kilometres, was at a similar level as coal and was almost twice the size of the
construction sector. The fact that intermodal tonne kilometres are now at a similar level to coal is
remarkable given that intermodal goods are generally lower density than coal.
2.6.18 The scale of this growth is all the more significant given it has been achieved against a background of
major unforeseen events eg the introduction of heavier 44-tonne goods vehicles, the aftermath of the
Hatfield derailment in 2000 (which led to blanket speed restrictions on train services) and the Channel
Tunnel security crisis around the same time (which led to a decline in cross-Channel rail freight
services), as well as further structural changes in the rail industry and its customer base. The industry
continues to face strong competition from road haulage on price and service levels, as well as further
change in the traffic base; recent changes in Government environment policy have seen a sudden and
dramatic reduction in power station coal traffic (82% fall in tonne km between 2014 and 2015).
2.6.19 Moving freight by rail will inevitably require interchange with other modes, and whilst most of the UK’s
major ports are enhancing or reinstating their rail links, most of the inland rail freight interchanges which
served the non-bulk freight market (eg consumer goods) have been lost to redevelopment during the
past 50 years, or no longer suit the requirements of modern industry. Growth in rail freight traffic has in
part been fostered by new Rail Freight Interchanges (RFI) within the UK, a combination of larger
‘Strategic’ (SRFI) developments with rail facilities integrated into large distribution parks at key rail /
motorway intersections, as well as smaller satellite railheads. The latest National Policy Statement on
National Networks reiterates the Government support for further rail freight interchange capacity. 26
2.6.20 The majority of SRFI developments to date have been in the Midlands, sites such as Daventry (DIRFT),
Hams Hall and BIFT located close to the ‘Golden Triangle’ concentration of national distribution activity
around the M1, M6 and M69 motorways. The success of these developments reflects:
The existing concentration of national distribution activity (ie longer-distance and/or higher-volume
traffic where rail is most competitive) in the Midlands;
Strategic locations on road and rail networks (the latter on routes able to carry 9’6” high containers);
The ability to create large-scale development on site, as much in the overall quantum of floorspace
as in the size of individual buildings (delivering significant potential rail traffic alongside the rail
network);
26
https://www.gov.uk/government/publications/national-policy-statement-for-national-networks
Page 20You can also read