Ralph: A Visible/Infrared Imager for the New Horizons Pluto/Kuiper Belt Mission
←
→
Page content transcription
If your browser does not render page correctly, please read the page content below
Ralph: A Visible/Infrared Imager for the New Horizons Pluto/Kuiper
                                Belt Mission

Dennis C. Reuter1, S. Alan Stern2, John Scherrer3, Donald E. Jennings1, James Baer4, John Hanley3,
Lisa Hardaway4, Allen Lunsford1, Stuart McMuldroch5, Jeffrey Moore6, Cathy Olkin7, Robert
Parizek4, Harold Reitsma4, Derek Sabatke4, John Spencer7, John Stone3, Henry Throop7, Jeffrey Van
Cleve4, Gerald E. Weigle3 and Leslie A.Young7
1
  NASA/GSFC, Code 693, Greenbelt, MD 20771
2
  Space Sciences and Engineering Division, Southwest Research Institute (SwRI), 1050 Walnut St.,
Suite 400, Boulder CO, 80302
3
  SwRI, 6220 Culebra Rd., San Antonio TX, 78228
4
  Ball Aerospace and Technology Corporation (BATC), 1600 Commerce St, Boulder, CO 80301
5
  SSG Precision Optronics, 65 Jonspin Rd., Wilmington MA, 01887
6
  NASA/Ames Research Center, MS 245-3, Moffett Field, CA 94035-1000
7
  Dept. of Space Studies, Southwest Research Institute (SwRI), 1050 Walnut St., Suite 400, Boulder
CO, 80302

                                                     ABSTRACT
The New Horizons instrument named Ralph is a visible/near infrared multi-spectral imager and a short wavelength
infrared spectral imager. It is one of the core instruments on New Horizons, NASA’s first mission to the Pluto/Charon
system and the Kuiper Belt. Ralph combines panchromatic and color imaging capabilities with IR imaging
spectroscopy. Its primary purpose is to map the surface geology and composition of these objects, but it will also be
used for atmospheric studies and to map the surface temperature. It is a compact, low-mass (10.5 kg) power efficient
(7.1 W peak), and robust instrument with good sensitivity and excellent imaging characteristics. Other than a door
opened once in flight, it has no moving parts. These characteristics and its high degree of redundancy make Ralph ideally
suited to this long-duration flyby reconnaissance mission.

                                                 1. INTRODUCTION

New Horizons, a flyby mission to the Pluto/Charon system and the Kuiper Belt, is the first in NASA’s New Frontiers
line of moderate-scale planetary missions and is the first mission to explore Pluto and its moons Charon, Nix and Hydra.
Launched on January 19, 2006, it is scheduled for a closest approach of about 10,000 km on July 14, 2015. The scientific
rationale for New Horizons and the overall mission planning are described in detail in several papers in this issue (Stern,
Young et al and Fountain et al.). The New Horizons mission is led by Principal Investigator Alan Stern of the Southwest
Research Institute of Boulder, CO and is managed by SwRI and the Johns Hopkins Applied Physics Laboratory in
Laurel, MD. A core remote-sensing instrument on New Horizons is Ralph, a visible/NIR camera and infrared spectral
mapper. The instrument’s primary purpose is to measure surface characteristics, including geological processes,
geomorphology, photometric properties, and surface composition. In addition, surface temperature will be inferred from
the shapes and positions of well-established, thermally diagnostic reflectance spectral features in H2O, CH4, and N2 ices.
Ralph will also be used to measure haze optical depths (if present) and to search for rings and small satellites. This paper
describes Ralph and specifies its characteristics (See also Reuter et al., 2005).

The Ralph instrument is mounted to the exterior of the New Horizons spacecraft (Fountain et al., this issue). Ralph
consists of a single telescope that feeds two sets of focal planes: 1) the Multi-spectral Visible Imaging Camera (MVIC), a
visible, near-IR imager and 2) the Linear Etalon Imaging Spectral Array (LEISA), a short-wavelength, IR, spectral
imager. The telescope uses an unobscurred, off-axis, three-mirror anastigmat design. The entire telescope assembly,
including the three diamond turned mirrors, is constructed from grain aligned 6061-T6 aluminum. The optical mounts,
housing and baffles are diamond turned from a single Al block. This combination of an all Al structure and optics is
lightweight, athermal and thermally conductive. It ensures that the optical performance of the system is minimally

                                                                                                                          1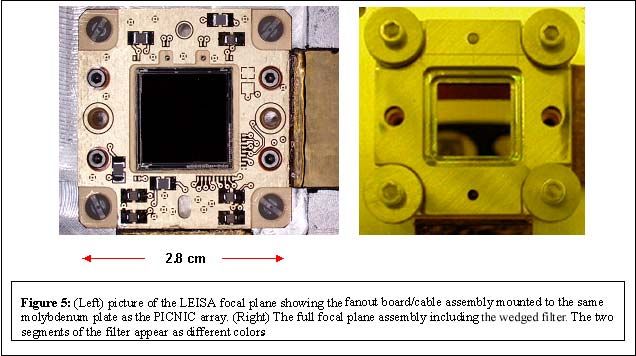
sensitive to temperature and that thermal gradients are minimized. The highly baffled 75 mm aperture, VIS/IR telescope
provides ample sensitivity at Pluto/Charon, while minimizing size and mass. The f/8.7 system’s approximately 658 mm
Effective Focal Length offers a good compromise between photometric throughput and alignment stability. Stray light
control is improved by using a field baffle at an intermediate focus between the secondary and tertiary mirrors, and by
using a Lyot stop at the exit pupil after the tertiary mirror. A dichroic beamsplitter transmits IR wavelengths longer than
1.1 µm to LEISA and reflects shorter wavelengths to MVIC.

MVIC is composed of 7 independent CCD arrays on a single substrate. It uses two of its large format (5024x32 pixel)
CCD arrays, operated in time delay integration (TDI) mode, to provide panchromatic (400 to 975 nm) images. Four
additional 5024x32 CCDs, combined with the appropriate filters and also operated in TDI mode, provide the capability
of mapping in blue (400-550 nm), red (540-700 nm), near IR (780 – 975 nm) and narrow band methane (860 – 910 nm)
channels. TDI operates by synchronizing the parallel transfer rate of each of the CCDs thirty-two 5024 pixel wide rows
to the relative motion of the image across the detector’s surface. In this way, very large format images are obtained as
the spacecraft scans the FOV rapidly across the surface. The presence of 32 rows effectively increases the integration
time by that same factor, allowing high signal-to-noise measurements. The FOV of a single MVIC pixel is 20x20
µradian2. The panchromatic (pan) channels of MVIC will be used to produce hemispheric maps of Pluto and Charon at a
double sampled spatial resolution of 1 km2 or better. The static FOV of each of the TDI arrays is 5.7°x0.037°. In
addition to the TDI arrays, MVIC has a 5024x128 element, frame transfer panchromatic array operated in staring mode,
with an FOV of 5.7°x0.15°. The primary purpose of the framing array is to provide data for optical navigation (OpNav)
of the spacecraft.

LEISA is a wedged filter infra-red spectral imager that creates spectral maps in the compositionally important 1.25-2.5
micron short wave infrared (SWIR) spectral region. It images a scene through a wedged filter (linear variable filter,
Rosenberg et al., 1994) placed about 100 µm above a 256x256 pixel Mercury Cadmium Telluride (HgCdTe) detector
array (a PICNIC array). An image is formed on both the wedged filter and the array simultaneously (there is less than
5% spectral broadening by the f/8.7 beam). LEISA forms a spectral map by scanning the FOV across the surface in a
push broom fashion, similar to that of the MVIC TDI channels. The frame rate is synchronized to the rate of the scan, so
that a frame is read out each time the image moves by the single pixel IFOV. The LVF is fabricated such that the
wavelength varies along one dimension, the scan direction. The difference between a LEISA scan and a TDI scan is
that in LEISA the row-to-row image motion builds up a spectrum while in TDI the motion increases the signal over a
single spectral interval. The filter is made in two segments. The first covers from 1.25 to 2.5 microns at an average
spectral resolving power (λ/∆λ) of 240. This section of LEISA will be used to obtain composition maps. The second
segment covers 2.1 to 2.25 microns with an average spectral resolving power of 560. It will be used to obtain both
compositional information and surface temperature maps by measuring the spectral shape of solid N2.

The MVIC and LEISA components of Ralph were originally developed in 1993 for what was then called the “Pluto Fast
Flyby” mission using grants from NASA’s “Advanced Technology Insertion” (ATI) project. At the time, they were
combined with a UV mapping spectrometer (also developed under the ATI grant) into a fully integrated remote-sensing
package called HIPPS (Highly Integrated Pluto Payload System, Stern et al, 1995). For the New Horizons mission,
HIPPS evolved into the Pluto Exploration Remote Sensing Instrument (PERSI), in which the UV spectrometer, now
named Alice, was decoupled from the MVIC and LEISA components. This allowed the UV and Vis/IR optics to be
separately optimized and reduced the chances of contamination of the sensitive UV optics. Versions of Alice are flying
on the Rosetta comet orbiter mission and have been chosen for the Lunar Reconnaissance Orbiter (see Stern et al., in this
issue and references therein). Instruments based on the ATI LEISA concept have flown on the Lewis mission (Reuter et
al., 1996) and the EO-1 mission (Reuter et al., 2001, Unger et al, 2003). The Lewis spacecraft prematurely re-entered
the atmosphere before any instrument aboard could take data, but the version of LEISA aboard EO-1 provided numerous
images. Now that the UV Alice spectrometer is a separate entity from the MVIC/LEISA sub-assembly, the latter is
named Ralph in honor of Ralph and Alice Kramden of “Honeymooner’s” fame. New Horizons is the first mission on
which the Ralph instrument has flown.

Ralph is a joint effort of the Southwest Research Institute (SwRI, San Antonio, TX and Boulder, CO which is the home
institution of Alan Stern, the Ralph Principal Investigator), Ball Aerospace and Technologies Corp. (BATC, Boulder,
CO) and NASA’s Goddard Space Flight Center (GSFC, Greenbelt, MD).

                                                                                                                         2
2. RALPH SCIENCE OVERVIEW

The scientific rationale for the New Horizons mission to the Pluto system (and beyond into the deeper Kuiper Belt) is
given in detail in another paper in this volume (Young et al.) and will not be repeated at length here. In brief, the Kuiper
Belt is an extended disk containing numerous primordial bodies whose planetary evolution was arrested early in Solar
System formation. In essence, Kuiper Belt Objects (KBOs) are the “fossils” of planetary evolution and the Kuiper Belt
is the prime “archeological site” in the Solar System. Pluto is among the largest known KBOs and is a full-fledged
dwarf planet. Because Charon is approximately half of Pluto’s size, the center of mass of the Pluto-Charon system lies
between the two objects, making it a true binary system. The first exploration of the Pluto-Charon system and the
Kuiper Belt is both scientifically and publicly exciting. It will provide invaluable insights into the origin of the outer
solar system and the ancient outer solar nebula. It will explore the origin and evolution of planet–satellite systems and
the comparative geology, geochemistry, tidal evolution, atmospheres, and volatile transport mechanics of icy worlds.

The Ralph instrument will play a leading role in this exploration. It directly addresses two of the three Group 1, or
primary, mission requirements (see Stern, this volume): 1) to characterize the global geology and morphology of Pluto
and Charon and 2) to map the surface composition of Pluto and Charon. It also contributes to the third Group 1
requirement of searching for atmospheric haze. High spatial resolution (≤1 km/line pair) panchromatic maps generated
by the MVIC component of Ralph will be used to address the first Group 1 requirement. These maps will be obtained
for the hemisphere visible at closest approach, and will address many of the outstanding questions about these bodies.
What is their cratering history? What types of structures are found on their surfaces? What is the spatial variability and
scale size of surface features? What is the effect of seasonal volatile transport on the “smoothness” of surface features?
Answers to these questions will revolutionize our understanding of the formation and evolution of the Pluto/Charon
system.

The second Group 1 goal will be addressed both by MVIC and by LEISA. LEISA will obtain hemispheric maps in the
1.25 to 2.5 µm spectral region with an average resolving power (λ/∆λ) of 240 and a spatial resolution of less than 10 km.
Similarly, MVIC will provide hemispheric surface color maps and maps of surface methane (CH4) at even higher spatial
resolutions. Pluto’s surface is known to contain the species CH4, N2, and CO, while Charon’s is primarily H2O but is also
likely to contain ammonium hydrates. LEISA’s hemispheric maps will allow us to address questions pertaining to
composition. What is the surface distribution of the main species? Are there areas of pure frost and mixed areas? What
is the effect of seasonal transport? Are there more complex species in selected regions of the surface? Is there a
connection between geology and composition? Answers to these questions will significantly advance our understanding
of the chemical and physical processes that occur on icy objects and of the processes that occurred in the cold outer
regions of our solar system during its formation. Figure 1 shows simulated spectra for Pluto and Charon. As is evident
from this figure, there is a wealth of information to be gleaned from this spectral region even from globally averaged
spectra. LEISA’s spectral maps will permit the correlation of composition with both geology and atmospheric transport
of volatiles. They will also enable the study of Pluto’s crustal composition where craters or other windows into the
interior so permit.
.
In addition to the primary, Group 1 objectives, Ralph will address numerous Group 2 and Group 3 measurement goals.
These include: obtaining stereo images of Pluto and Charon (MVIC), mapping the terminators (MVIC), obtaining high
resolution maps in selected regions (MVIC and LEISA), refining the bulk parameters and orbits of the Pluto system and
searching for rings and additional satellites (MVIC). LEISA will use its high resolution ( = 560) 2.1 to 2.25 µm
segment to obtain surface temperature maps of Pluto employing a technique that relates temperature to the spectral shape
of the N2 transition near 2.15 µm. This technique is particularly sensitive for temperatures near 35 K, the temperature at
which N2 undergoes a transition from α phase to β phase (Grundy et al., 1993). Thirty five K is close to the predicted
surface temperature of Pluto at the time of the flyby in 2015. For Pluto, additional temperature information will be
obtained from the band shape of the CH4 features measured using the lower resolution LEISA filter. For Charon which
does not have a prominent N2 band, reasonably accurate temperature maps can be deduced from the shape of the water
bands observed with the lower resolution LEISA filter. These secondary and tertiary objectives, while not mission
critical like the Group 1 goals, will add substantially to our understanding of Pluto and Charon. MVIC panchromatic
and color maps and LEISA spectral maps will also be obtained of Nix and Hydra, two recently discovered satellites in
the Pluto system.

                                                                                                                          3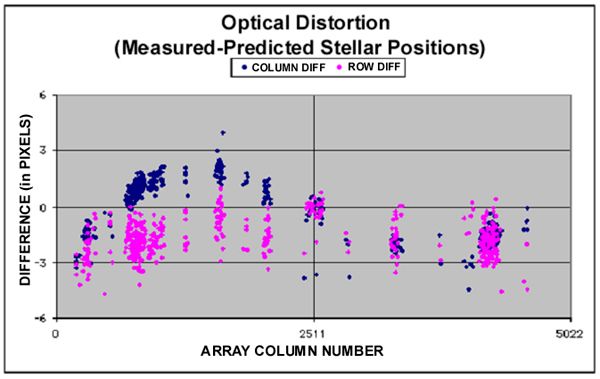
Table 1 summarizes the science objectives
                                                                              that determined the Ralph design, the
                                                                              measurement strategies that address these
                                                                              objectives and the derived instrument
                                                                              performance requirements. Except for the
                                                                              spectral resolution and coverage of the
                                                                              high-resolution segment of LEISA, the
                                                                              performance         requirements       were
                                                                              determined by the need to address the
                                                                              Group 1 goals.         The high-resolution
                                                                              LEISA segment was added specifically to
                                                                              address the Group 2 goal of mapping
                                                                              Pluto’s surface temperature, but it will
                                                                              prove useful in the surface composition
                                                                              mapping as well. The MVIC framing
                                                                              camera will be used to perform optical
                                                                              navigation.     This gives rise to the
                                                                              additional requirement that it be capable
                                                                              of measuring a 10th magnitude star with a
                                                                              signal-to-noise ratio of 7 in a 0.25 second
                                                                              exposure.

                                                                              3. OPTO-MECHANICAL DESIGN

                                                                               Figure 2 shows a model of Ralph and a
                                                                               picture of the assembled instrument before
                                                                               addition of the final MLI. The major
                                                                               elements are labeled in the model. The
                                                                               mass of the instrument is 10.5 Kg and the
                                                                               maximum peak power load is 7.1 Watts.
                                                                               The low power and mass are especially
                                                                               important for the New Horizons mission
                                                                               where both of these resources are at a
                                                                               premium. As shown in Fig. 2, Ralph has
   Figure 1: Reflectance spectra of Pluto (top) and Charon (bottom) in the     two assemblies, the telescope detector
   LEISA spectral range at the LEISA spectral resolution (Dale                 assembly (TDA) and the electronics
   Cruikshank and Cristina M. Dalle Ore, private communication, 2000).         assembly. The TDA consists of the
   Pluto’s known spectrum contains CH4, N2 and CO bands, while                 telescope optical elements, the baffling,
   Charon’s is dominated by H2O.                                               the MVIC and LEISA focal planes, the
                                                                               two-stage passive radiator that cools the
focal planes and the flat fielding Solar Illumination Assembly (SIA). The aperture of the TDA was closed by a one-time
use door with a partially transmitting window (about 20% throughput). The door protected the optics from
contamination prior to and during launch and protected the focal planes from accidental solar exposure during the early
flight stage. The door was opened when the spacecraft was 2.3 AU from the sun and can not be closed. The TDA is
mounted to the spacecraft by thermally isolating titanium flexures. The in-flight temperature of the TDA is about 220 K,
The temperature of the electronics box, which is mounted directly to the spacecraft, is about 290 K. The low
temperature of the TDA reduces the conductive and radiative thermal load on the focal planes. It also limits the
background signal at the long wavelength end of LEISA. The inner stage of the externally mounted passive radiator
cools the LEISA detector to < 130 K. The outer annulus maintains the MVIC CCDs at temperatures below 175 K and
lowers the temperature of an f/2.4 cold shield for LEISA to below 190 K. The 75 mm aperture, 657.5 mm focal length,
f/8.7 telescope provides good image quality over the 5.7°x1.0° field of view spanned by the MVIC and LEISA arrays.
The instrument parameters for Ralph are summarized in Table 2. Figure 3 shows a model of the TDA interior with a
raytrace diagram.

                                                                                                                       4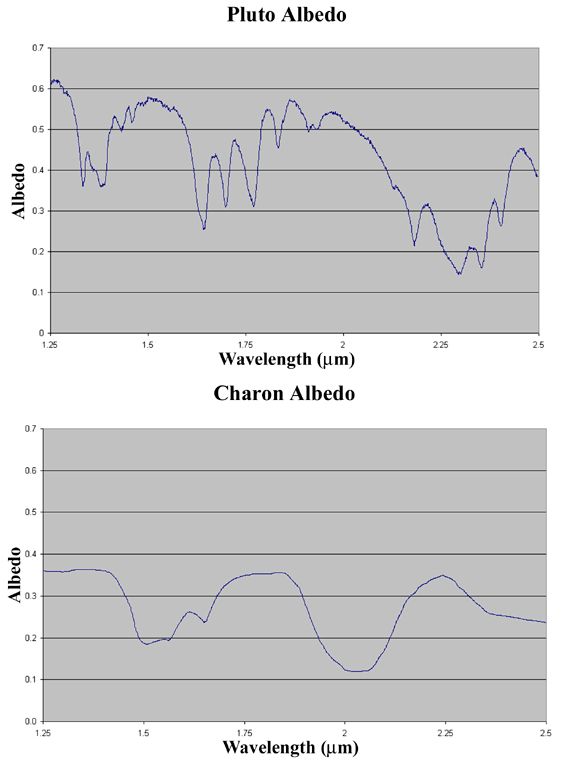
Table 1: Science Objectives and Derived Instrument Requirements
     Science           Measurement                             Derived Instrument Requirements
    Objective             Strategy         Spectral coverage     Resolution   Image Quality        Signal-to-noise
 Global geology         Panchromatic          400 – 975 nm          N/A      MTF ≥0.15 @ 20 50 (33 AU, 0.35 I/F)
 and morphology        images: spatial                                       cycles/milliradian
 of Pluto/Charon       resolution of 1
                         km/line pair
 Map the surface        Color images:      400 – 550 nm (blue)      N/A        No additional    50 (33 AU, 0.35 I/F)
 composition of       spatial resolution   540 – 700 nm (red)                  requirement.     50 (33 AU, 0.35 I/F)
  Pluto/Charon
Figure 3: (Left) Interior of the Ralph TDA Showing the light path. Note the stainless steel tube loop forming
the SIA fiber path. (Right) Raytrace diagram showing the path to the LEISA and MVIC focal planes.
array. The filter, which was provided by Barr Associates, is mounted about 700 microns above the surface of the array.
It has five segments, four with the passbands described in Table 2 placed directly over the four CCDs forming the color
segment of MVIC. The remaining two TDI CCDs and the frame transfer array are overlain by a clear filter so that the
focus position is the same for all seven arrays. In TDI mode, the spacecraft is rotated to scan the image of each segment
of the surface across the focal plane in a pushbroom fashion. The entire surface may be imaged in this way. The
nominal rotation rates are about 1600
Table 2: Ralph Instrument Parameters
µrad/sec for the pan band and about
Mass: 10.5 Kg 1000 µrad/sec for the color bands.
Power: 7.1 Watt (maximum) These correspond to integration times of
Telescope Aperture: 75 mm about 0.4 and 0.6 seconds respectively.
Focal Length: 657.5 mm The clocking of each 5024 element pixel
f/#: 8.7 row is synchronized with the spacecraft
MVIC: Time Delay and Integrate (TDI) and framing arrays motion using attitude control knowledge
2 Redundant 5024x32 Pixel Panchromatic TDI CCDs (400 – 975 nm) obtained from the spacecraft so that the
Four 5024x32 Pixel Color TDI CCDs effective integration time is 32 times the
Blue (400 – 550 nm) row transfer period. In this way, the
Red (540 – 700 nm) signal-to-noise ratio of the observations
NIR (780 – 975 nm) is increased while the time required to
Methane (860 – 910 nm) obtain a full image is reduced. TDI
5024x128 Frame Transfer Pan CCD mode takes advantage of the ability of
the spacecraft to scan smoothly in
13µm x 13µm pixels
attitude and does not need the multiple
Single pixel Field of View: 19.77µrad x 19.77µrad
pointing operations that a mosaic of
TDI array FOV: 5.7°x0.037° framing images would require. In flight,
Framing camera FOV: 5.7°x0.146° the CCD clocking rate errors in the TDI
Focal plane temperature:responsive to only a narrow band of
4 Color-band TDI Detectors, 5000 x 32 wavelengths, so that, conceptually, the
filter may be considered as consisting of
2 Panchromatic TDI Detectors, 5000 x
32 256 adjacent narrow band filters. As
1 Frame-Transfer Detector, 5000 x 128 with MVIC, the image is scanned over
the LEISA focal plane by rotating the
spacecraft. The nominal rotation rate is
about 120 µrad/sec for a frame rate of 2
Hz. Here again, the frame rate is
synchronized to the spacecraft-measured
rotation rate, so that the image moves
one column per frame.
The LEISA detector is a 1.2 to 2.5 µm
HgCdTe PICNIC array, supplied by
Rockwell Scientific Corporation of
Camarillo CA. The array is a 256x256
pixel array and each pixel is 40x40µm2
in area. However, several modifications
were made to the standard PICNIC
array. The HgCdTe was grown on a
CdTe substrate using Molecular Beam
Epitaxy (MBE) to provide good lattice
matching and low dark currents. The
detector was bump bonded to a standard
PICNIC multiplexer and the resulting
hybrid was mounted to molybdenum
pad. This process reduces mechanical
stress induced during cooling to
operational temperature. It is estimated
that the assembly can safely undergo at
least 1000 thermal cycles. The electrical
interface to the array is provided by two
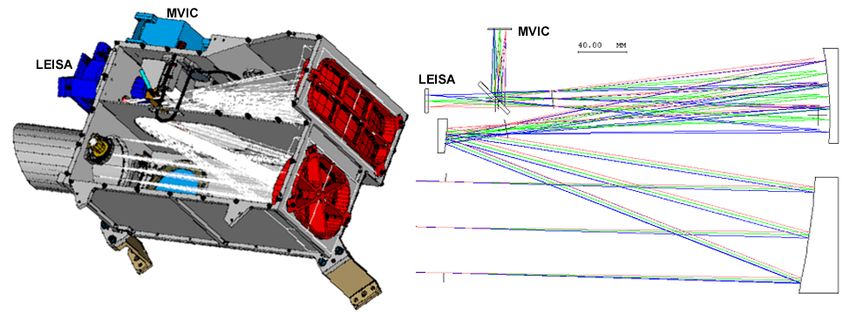
Figure 4: (Top) Schematic showing the arrangement of the CCDs on ribbon cables and a multilayer fan-out
the MVIC focal Plane. The shaded areas are photo-active regions. board that were fabricated into a single
The white strips are the serial readouts. (Bottom) Photograph of the element. The LEISA array is back
flight MVIC focal plane in its mounting holder. illuminated, but the substrate has been
thinned from 800 µm to 200 µm so that
the active area of the array is significantly closer to the surface than is usual. This puts both the filter and the array
within the depth of focus. The filter, supplied by JDSU Uniphase/ Optical Coating Laboratories Inc. of Santa Rosa CA,
was made in two segments. The first, covering from 1.25 to 2.5 µm at a constant resolving power (constant ∆λ/λ) of
about 240, provides information primarily for surface composition mapping. The second, covering from 2.1 to 2.25 µm
at a constant resolving power of about 560, uses temperature dependent changes in the spectral structure of solid N2 near
the α to β phase transition at 35 K to provide surface temperature maps. In both segments, a constant resolving power is
achieved by making the transmitted wavelength depend logarithmically on position. The two segments were bonded
together to form a single filter element. This filter was, in turn, bonded into a holder and mounted such that the filter
surface is about 100 µm above the surface of the array. The refractive index of the array is approximately 2.7 so that the
total optical path between the filter and photo-active area of the array is less than 200 µm. In this distance, the f/8.7
beam spreads about 0.5 pixel, so when the focus position is optimized between the array and filter surface, the convolved
image smear is about 0.04 pixel. A picture of the array and the complete focal plane assembly is shown in Figure 5.
3.3 The Solar Illumination Assembly (SIA)
The SIA is a second input port whose FOV is along the spacecraft antenna pointing direction at 90 degrees with respect
to the main aperture. It is designed to provide diffuse solar illumination to both the MVIC and LEISA focal planes. In
7practice, it illuminates all of the LEISA array and about 3000 pixels of the each MVIC array with a reproducible pattern
that can be used for determining the stability of the pixel-to-pixel response (flat-fielding) during the mission. The SIA
consists of a small fused silica lens (4 mm aperture, 10 mm focal length) that images the sun onto the input end of a 125
µm core fiber. The output end of the fiber illuminates a pair of lenses, which are directly under the Lyot stop (the exit
pupil) and about 10 cm from both focal planes. To obtain an SIA measurement, the spacecraft is oriented so that the
SIA lens images the sun onto the fiber. At Pluto, the diameter of the image of the Sun on the fiber would be about 50
µm. This is significantly larger than the diffraction limited image size because of chromatic aberration in the single
element lens. Nevertheless, the solar image underfills the fiber, so the intensity level is relatively insensitive to pointing
errors. The fiber is about 10 cm long and is contained in a stainless steel tube. It is more than 50% transmitting over the
full spectral band from 0.4 to 2.5 µm. There is a second fiber in the SIA with an attenuation factor of about 40 that can
be used for flat fielding nearer the Sun (e.g. at Jupiter).
A second possible use of the SIA is as a solar limb viewing port. In this mode, an atmospheric spectrum can be
measured as a function of tangent height as a planet’s atmosphere occludes the Sun. Vertical spectral profiles would be
obtained using this capability. To increase sensitivity in sparse atmospheres, such as Pluto’s, the spectra from all rows
may be summed into a single spectrum. The SIA is co-aligned with the Alice solar occultation (SOC) port (Stern et al.,
this volume).
4.0 ELECTRONICS
The Ralph control electronics consist of three boards; detector electronics (DE), command and data handling (C&DH)
and a low voltage power supply (LVPS). These are contained within an electronics box (EB) mounted directly to the
spacecraft, below the TDA (see Fig. 2), and operate essentially at the spacecraft surface temperature, which is near
ambient. The DE board provides biases and clocks to both focal planes, amplifies the signals from the arrays and
performs the A/D conversion of the imaging data. The science data are converted with 12 bits per pixel. The C&DH
board interprets the commands, does the A/D conversion of the low speed engineering data and provides both the high
speed imaging data interface and the low speed housekeeping data interface. The LVPS converts the 30V spacecraft
power to the various voltages required by Ralph.
In a long duration mission such as New Horizons, reliability of the electronics is of paramount importance, particularly
for a core instrument that addresses all three Group 1 objectives. To ensure that Ralph is robust, almost all of the
electronics are redundant. As illustrated in Figure 6, Ralph can operate on two separate sides (side A or B) which have
8very few components in
common. The only
common elements are:
1) the relays that choose
whether side A or side B
is to be powered, 2) The
arrays themselves and 3)
the interface to the
spacecraft. However,
the spacecraft interface
has two identical circuits
and is inherently
redundant. For MVIC,
the potential single point
failure mode of the array
is mitigated by dividing
the six TDI arrays into
two groupings, each
containing two color
CCDs and one
panchromatic CCD. The
first grouping is
composed of a pan band
and the red and CH4
Figure 6: Schematic diagram of Ralph electronics showing the high degree of channels. The second
redundancy in the system. grouping is composed of
the other pan band and
the blue and NIR channels. If either group should fail, the other would still be able to meet the science requirement of
observations in 2 color bands and 1 panchromatic band. LEISA has 4 outputs corresponding to the four 128x128
quadrants of the array. If any one quadrant should fail, all science can still be completed. The same is true for the four
out of six possible two-quadrant failures that still have active pixels at all wavelengths.
MVIC always produces image data in correlated double sample (CDS) mode in which the reset level is subtracted from
the integrated level. LEISA can send either CDS data, which is its standard operating mode, or “raw” data that contains
both the reset levels and the integrated levels. The “raw” mode produces twice the data volume of the CDS mode and is
used to set the LEISA A/D converter offset level for each quadrant of the array. The same offset is used in both CDS
and “raw” modes. The selectable offset compensates for voltage drifts in the analog signal train over the life of the
mission, maintaining dynamic range without sacrificing signal resolution (increasing quantization noise). For both focal
planes the measured spacecraft rotation rate is fed back to the instrument to optimize the TDI or frame rate. That is, after
a scan has been initiated the spacecraft determines the actual rotation rate and sends that information to Ralph, which
uses it to calculate a TDI or frame rate such that the image moves a single row during a clock period. This reduces
smear in the along-track direction.
For both MVIC and LEISA, the dominant noise source at low light levels is the system electronics noise, including array
read noise. For MVIC this is about 30 e- (~ 200 µV) and for LEISA it is about 50 e- (~ 100 µV). The overall average
gain for MVIC is about 58.6 e-/DN (Digital Number, or least significant bit), while for LEISA it is approximately 11 e-
/DN.
5.0 PRE-LAUNCH INSTRUMENT CHARACTERIZATION
An extensive pre-launch program of performance verification measurements was carried out for Ralph at both the
component level and the full instrument level. The component level characterization included measurements of the
wavelength dependent quantum efficiency for the MVIC and LEISA array/filter assemblies and measurements of the
wavelength dependence of the other optical elements (i.e. reflectance of the mirrors, transmission of the filters and
throughput of the beamsplitter). Full instrument level testing was carried out under spaceflight-like conditions in a
thermal vacuum chamber at BATC. The primary performance characteristics verified in these tests were relative system
9throughput (relative radiometric sensitivity) and image quality. The directional characteristics of the SIA were also
measured.
5.1 Component Level Measurements
LEISA Spectral Lineshape: The instrument line shape was determined for the LEISA filter/array focal plane assembly
over the entire 1.25 to 2.5 µm band by using a combination of multi-order grating and narrow band filter measurements.
In this way a pixel-by-pixel table of the central wavelength, resolving power and out-of-band transmission was
generated. Figure 7a shows an example of the readout along a single LEISA row when the focal plane assembly was
Figure 7: (a) A single row of LEISA showing multiple orders of a grating. Note the non-linear (logarithmic)
wavelength scale and the presence of the 2.2 µm order in both the low resolution (2.5 to 1.25 µm, λ/∆λ ~ 240)
and the high resolution (2.1 to 2.25 µm, λ/∆λ ~ 560) filter segments. (b) Wavelength dependence of
transmitted intensity (instrument lineshape function) at a single pixel as the wavelength is varied from 2133
to 2200 nm in 0.3 nm steps.
illuminated using the output of a
grating monochromator. The first five
peaks correspond to orders 6 through
10 of the grating. The intensity
decrease is primarily caused by the
spectral shape of the source and by the
decreasing efficiency of the grating at
higher order. The line at 2.2 µm
occurs in both segments of the filter.
Figure 7b shows the intensity
measured at a single pixel as the
grating is scanned in small wavelength
increments (0.33 nm). This instrument
lineshape is representative of all pixels
and is approximately gaussian. At this
wavelength (2165 nm), the full width
at half maximum (FWHM) is 8.3 nm,
giving a resolving power of 260.
Figure 8 shows the average resolving
Figure 8: Measured resolving power (λ/∆λ) of the LEISA array/filter power for both filter segments of
assembly for the lower-resolution (1.25 – 2.5 µm) and higher- LEISA generated using the
resolution (2.1 – 2.25 µm) segments. measurement technique described
above. As may be seen from this
figure, the average resolving power for
10the lower resolution segment is
MVIC Quantum Efficiency
240, with variations of 10 to 15
percent lower and higher. This is
slightly below the requirement of
0.4000
250. The resolution determines
the reliability with which pure
0.3500
materials may be differentiated
0.3000 from mixtures and the accuracy
FT1
of temperatures determined from
0.2500 FT2 line shapes. The slight decrease
Q.E. (e-/photon)
NIR
Methane
in accuracy in the lower
0.2000 Red resolution regions will not have
Blue
Pan1 significant scientific impact.
0.1500
Pan2
Temperatures will be determined
0.1000
most accurately using the high-
resolution segment. As required,
0.0500 the resolving power of the
higher-resolution segment is
0.0000
300 400 500 600 700 800 900 1000 1100
greater than 550 in the region of
Wavelength (nm) the 2.15-µm N2 band.
Figure 9: Spectral dependence of the sensitivity of the MVIC filter/CCD MVIC spectral response: The
assembly in each channel in terms of quantum efficiency (e-/photon). spectral resolution of the MVIC
Measured in 50 nm steps channels is much lower than for
LEISA and the CCD response
varies relatively slowly, so a
coarser measurement of the
wavelength dependence of the
filter/CCD assembly is
acceptable. Figure 9 shows the
measured sensitivity of the
combined array/filter focal plane
assembly. These measurements
were obtained at 50 nm intervals
using a broad spectral source
filtered with 50 nm wide spectral
filters as an input. In order to
account for observational sources
with greater spectral variation,
the spectral responses of the
filters were determined at higher
spectral resolution and finer point
spacing. Figure 10 shows the
spectral response curves for the
MVIC color filters. In addition to
allowing for the retrieval of more
accurate spectral models, these
data will be used to calculate the
Figure 10: Wavelength dependent transmissions for the four MVIC color sensitivity of MVIC to the source
filters. At wavelengths above 950 nm, the responsivity of the CCD falls spectral distribution (e.g. a solar
rapidly, which limits the long wavelength NIR system response cutoff to reflectance spectrum vs. the
975 nm. Similarly, the short wavelength system response cutoff for the blackbody spectrum of a volcano
blue filter is 400 nm because of fall-off of the CCD responsivity at shorter on Io).
wavelengths.
115.2 Full Instrument Level Measurements
Absolute Radiometry: A spectrally calibrated integrating sphere filling about a 1° field of view was used as the
radiometric source. Radiometric response over the full MVIC image plane was measured by rotating the sphere
illumination using a cryomirror assembly in the chamber. This technique was used to determine accurate relative
radiometry (flatfields). The MVIC absolute radiometry was determined with an accuracy of approximately ±30%. The
accuracy of the LEISA absolute radiometry was lower because water contamination in the integrating sphere caused
significant absorption at some wavelengths. Radiometric calibration is being performed in-flight and the combined
results of the pre-flight and in-flight calibration are shown in the next section.
Image Quality: The image quality, defined in terms of system MTF (Modulation Tranfer Function), was determined
using a collimated point source to simulate a distant object. Collimation was verified interferometrically, as were
corrections for pressure and thermally induced optical power in the chamber window. By defocussing the point source
in a controlled fashion, this system could also be used to determine the best focus position for the focal planes. At the
best focus position, a point source produced a spot in the focal plane whose FWHM was 1.2 ±0.1 pixel. After the tests
were completed, it was found that there was some optical power in the cryomirror that was not accounted for in
determining the focus. However it was determined that for the Ralph system with its 650-mm focal length, the focus
error caused by the cryomirror curvature was negligible. The pre-flight image quality measurements were used to
determine an expected budget for the full system MTF that is shown in the next section.
SIA Pointing: The pointing direction and spatial distribution of focal plane illumination for the SIA were also determined
in the instrument level tests. When illuminated by a source simulating the angular size of the sun at Pluto, the SIA
produced a stable pattern in both the MVIC and LEISA focal planes that was insensitive to the exact source position over
a range of 0.5° in each dimension.
6.0 COMBINED PRE-LAUNCH AND IN-FLIGHT INSTRUMENT CALIBRATION RESULTS
Calibration of Ralph is being carried out in flight. To date, standard stars and Jupiter observations are being used to
determine image quality, to measure over-all system radiometric sensitivity and, for LEISA, to verify the spectral
calibration. Additionally, dense star-fields are being used to determine overall optical distortion. A Jupiter gravity assist
will occur in 2007 with closest approach on February 28. It will provide additional opportunities for measuring the flat
field response, and will permit radiometric and spectral calibration. Afterwards, every year during the flight, there will
be a 50-day checkout period during which calibration will be checked. Extensive calibration will also be carried out
during the 6-month period prior to and after the planned Pluto encounter on 14 July, 2015. Because the initial in-flight
calibration analyses are not complete, the following results should be considered to be preliminary estimates.
So far in flight, the MVIC and LEISA system random noises have remained at their pre-launch values: ≤ 1 count (≤60 e-)
for all the MVIC CCDs and 4.5 counts (50 e-) for LEISA. In addition to the random noise, the MVIC CCDs have some
periodic noise (as much as 2 counts) that may be removed by post-processing. This noise was present before launch.
The MVIC dark current is completely negligible; it is not measurable for the integration times allowed by the Ralph
electronics. The LEISA dark current is ~40 counts/second (~440 e-/sec), and does not contribute significantly to the
noise even for the longest allowed integration time (4 sec.). So far, the Ralph decontamination heaters have been left on
except for 24-hour periods around data collection events in order to minimize the condensation of contaminants
produced by spacecraft outgassing and thruster operation. This means that, as of this writing, the LEISA focal plane has
not reached its quiescent operating temperature when acquiring data. A cool-down period of greater than 24 hours is
common in low temperature, passively cooled systems. When the heaters are left off for longer periods, it is expected
that the focal plane temperature will drop a few more degrees. The dark current will decrease by about a factor of two
for every five degrees drop in the focal plane temperature.
6.1 Image Quality and MTF
The point spread function of MVIC’s panchromatic TDI channels determined in-flight is well represented by a 2-D
gaussian function. Fittings of the point source intensity distribution to this PSF for about 30 relatively bright stars has
yielded FWHMs of 1.48±0.13 pixels in the in-track direction and 1.40±0.1 pixels in the cross-track direction. These
12observations are all for integration times of 0.5 seconds or less, for which the contribution of the uncorrected spacecraft
motion is less than half a pixel. Taking the Fourier transform of the fitted PSF yields the expression:
MTF(d) = e-(dπ0.01977FWHM/(2(ln2)
1/2))2
(1)
for the value of the MTF at spatial frequency, d (cycles/milliradian). Using this expression, MTF(20) = 0.30±0.07 (in-
track) and MTF(20) = 0.34±0.06 (cross-track). Both the in-track and cross-track MTF(20) values surpass the
requirement that they must be greater than 0.15 (see Table 1). These results are summarized in Figure 11, which shows
the pre-launch MTF curves, determined solely by the optical characteristics, and the pre-flight model of the full system.
In this figure the top area in each panel (“measured spots”) represents the measured contribution of the instrumental
characteristics to the MTF. Off array integration is a term that accounts for the effect of insufficient masking of the bulk
silicon from the light. The other factors are based on predicted spacecraft behavior at the 3σ level. The temporal
aperture and the TDI error have to do with uncompensated spacecraft motion. The point labeled “requirement” is the
15% minimum overall MTF at 20 cycles/milliraian (0.4 cycles/pixel) that satisfies the science requirements. The
measured in-flight image characteristics clearly exceed requirements and agree remarkably well with the predicted
behavior based on the pre-flight instrument level measurements.
The MVIC color channels and the
LEISA spectral channels have no
additional requirements on image
quality beyond the requirement that
they be in focus to within 0.5 pixel.
This is because the required spatial
resolutions for the observations using
the MVIC color and LEISA channels
are significantly lower than for the
MVIC panchromatic channel. The
MVIC color channels are at the same
focal distance as the panchromatic
channel by virtue of being on the same
substrate. The LEISA focal plane was
focused separately. Table 3
summarizes the preliminary results of
the analysis of the PSF for all the
Ralph channels. The effect of
diffraction is apparent in the FWHM
measurements for the MVIC color
channels. The LEISA results are based
on a single stellar observation that only
covered from 1.25 to 1.8 µm.
Diffraction effects are not apparent in
these LEISA measurements because
the LEISA pixels are three times larger
Figure 11: Modeled and measured MTF for the MVIC panchromatic than the MVIC pixels.
TDI channel. “Measured spots” represents the measured contribution
of the optical characteristics to the MTF, while the other factors are 6.2 Optical Distortion
based on predicted behavior at the 3σ level. The temporal aperture
and the TDI error have to do with uncompensated spacecraft motion. The MVIC focal plane covers 5.7° in
the cross track direction, which means
Off array integration is a term that comes about because of
that it is expected that there will be
insufficient masking of the bulk silicon from the light. The points
optical distortion of on the order of a
labeled “measured in-flight” are derived from stellar observations and
represent the full system MTF. These clearly exceed the requirement. few pixels at the ends of the FOV. In
addition, the three-mirror anastigmat
design is known to be anamorphic. That is, the spatial scale in the cross track direction is slightly different from that in
the along track direction. These effects both make the apparent position of objects different from their true position. In
13order to account for this
Table 3: Summary of Full Width at Half Maximum for Ralph Channels1 effect, both to maintain
Channel In-Track FWHM Cross-Track FWHM spatial fidelity in the
MVIC Pan 1.48±0.13 1.40±0.10 science data and to allow
MVIC Blue 1.48±0.10 1.29±0.07 accurate observations for
MVIC Red 1.55±0.12 1.38±0.08 optical navigation, a
MVIC NIR distortion correction must
1.95±0.15 1.97±0.15
be found that maps the
MVIC CH4 1.78±0.13 1.81±0.20
2 apparent position to the
LEISA 1.40±0.13 1.40±0.10 true position. The
1
Initial results for FWHM in units of pixels. distortion effect is
2
This is the result of a single stellar observation and is the average FWHM for illustrated in Figure 12 for
wavelengths from 1.25 to 1.8 µm. There is no apparent wavelength dependence over a set of observations of a
this range. dense star field using
MVIC’s panchromatic
framing camera. This
plot shows the difference
between the true position
of a star and the position
obtained assuming that
each pixel is 19.77 µm
square. The stellar
positions are typically
known to better than 5
µrad. As may be seen
from this figure, there is
about a three-pixel
distortion at the ends of
the focal plane. Note that
the column distortion is
sinusoidal about the center
of the FOV, while the row
distortion is the same sign
on opposite sides of the
array. The anamorphism
is the principle driver for
Figure 12: Effect of optical distortion for MVIC framing camera. The plotted the row distortion. These
points are the differences between predicted row and column stellar positions and results are preliminary and
true row and column stellar positions as determined using dense star fields. The are being refined further,
differences are plotted as a function of array column number. but they indicate the
effects are easily modeled.
6.3 Radiometric Calibration
The absolute radiometric calibration of the MVIC and LEISA components of Ralph is primarily being carried out in-
flight, using point sources (standard stars) and Jupiter. The flatfields determined during the pre-launch testing are used
to interpolate the stellar and Jupiter results over the entire focal planes. This work is still progressing. The results below
are preliminary, and are expected to be accurate to about 10%. Figure 13 shows an example of the stellar source
calibration measurements for the MVIC framing array. This figure shows a plot of the integrated signal at the focal
plane vs the visual magnitude of a star, for a number of A-, B- and K-type stars. A fit was done using data for B9-type
stars that is linear to a very high degree of accuracy (it accounts for 99.5% of the standard deviation of the data). The
other A- and B- type stars are well described by this fit as well. The colder, K-type star is a bit of an outlier, but no
correction has been made for color temperatures of the stars. These data indicate that, for the framing array, a 14th
magnitude B9 star will produce an integrated signal of one count per second. Given the MVIC frame noise
characteristics (~ 0.6 counts of noise at low illumination levels), a tenth magnitude star will produce a measurement with
14a signal-to-noise ratio of 14 in 0.25
seconds if it is focused onto a single
pixel. If the same signal is spread out
over 4 adjacent pixels it produces an
average SNR of 8, which still meets
the OpNav requirement.
Table 4 shows the sensitivities and the
predicted signal-to-noise ratios for the
MVIC channels and for the LEISA
wavelengths at which the LEISA SNR
performance requirements were
defined. The predictions are made for
the conditions specified in Table 1
which are representative of the flux
levels expected at Pluto. The table
also lists the noise performance
requirements set forth in the
Announcement of Opportunity (AO)
for the mission. As can be seen from
this table, all MVIC channels easily
meet their sensitivity requirements.
Figure 13: MVIC frame camera. Log of integrated signal vs visual Similarly, LEISA meets the AO
magnitude for a number of stars. The B9-type stars are fitted to a line radiometric performance
that explains 99.5% of the standard deviation. The A- and B-type specifications, but with significantly
stars not included in the fit align very well with the fitted line. The fit smaller margin, particularly at shorter
indicates a 14th magnitude star will produce one count per second wavelengths. The decreased
above the background. performance in this spectral region is
caused by a known drop in quantum
efficiency of the array at wavelengths shorter than 1.6 µm, and by lower transmittance of the filter at shorter
wavelengths. However, solar flux increases at the shorter wavelengths so the decreased efficiency is compensated for by
Table 4: Ralph Radiometric Sensitivity, Predicted Signal-to-Noise Ratios and Mission Requirements
Channel Sensitivity (DN/photon)1 Predicted SNR2 Required SNR
MVIC Pan 1.89x10⁻³ 150 50
MVIC Blue 1.38x10⁻³ 68 50
MVIC Red 2.25x10⁻³ 122 50
MVIC NIR 1.59x10⁻³ 106 50
MVIC CH4 2.00x10⁻³ 48 153
LEISA 1.25 µm
4 -3
2.45x10 32 31
4
LEISA 2.00 µm 5.82x10⁻³ 35 27
4
LEISA 2.15 µm 8.32x10⁻³ 24 18
1
For MVIC, there are on the average, 58.6 e- per DN, where DN (digital number) is the least significant bit of the
A/D. For LEISA there are about 11 e- per DN.
2
Predicted SNR at Pluto. MVIC: Assumes 35% albedo; LEISA: Assumes Pluto model albedo in Figure 1. MVIC
Pan is for 0.4 sec integration, MVIC color is for 0.6 sec integration, LEISA is for 0.5 sec integration.
3
The methane specification is an internal goal, not a requirement
4
The LEISA SNRs are for the average of two planned scans
the larger flux. Figure 14 shows the LEISA radiometric sensitivity as a function of wavelength. Figure 15 shows the
predicted signal-to-noise ratio of LEISA observations (average of two scans, 0.5 second /pixel integration time) of Pluto
and Charon for the nominal albedos plotted in Figure 1. At the Pluto flux levels the noise is dominated by the system
noise (read noise), so that the signal-to-noise ratio grows nearly linearly with increased integration time.
156.4 Anomalous Solar
Light Leak
In-flight testing of Ralph
has shown the presence of
an anomalous background
signal in the LEISA
imager that appears to be
caused by the transmission
of a very small fraction of
the ambient solar flux into
the area behind the focal
plane. These photons pass
between the filter and the
array and give rise to a
“solar light leak” signal
that, in the worst case, is
less than 1 part in 107 of
the ambient solar flux.
The background may be
eliminated by using
structures on the
Figure 14: LEISA wavelength dependent sensitivity in terms of e-/photon. This is spacecraft to shield Ralph
for the flux contained in a LEISA spectral resolution element and within the from the sun. This
LEISA single pixel AΩ of 1.66x10⁻⁷ cm2sr. behavior, and the Rsun2
dependence of the
magnitude of the background signal are both evidence of the sun as the source of this anomaly. Ralph can not always be
shielded. When Ralph is not shielded, the magnitude of the effect is a slowly varying function of the position of the sun
relative to Ralph and it may be removed to a high degree of accuracy. This means that the primary result of the light
leak is to increase the system noise because of photon counting statistics. At Pluto’s heliocentric distance, and for the
integration times that are possible with LEISA, the excess background introduced by the effect is at least a factor of two
Figure 15: The predicted SNRs for the LEISA observations of Pluto (a) and Charon (b), assuming the albedo
spectrum shown in Figure 1. The specified requirements for the Pluto scan are shown in green. The predicted
SNRs are for the sum of two 0.5 second integration spectral maps with 10 km spatial resolution.
less than the read-noise equivalent input flux. Therefore, after the background is removed, there will be little or no
measurable effect of this excess flux on the LEISA observational results. As of yet, the root manufacturing cause of the
light leak has not been determined. It is possible that light is more of less uniformly penetrating the multi-layer
16insulation (MLI) thermal shield that encloses the instrument, and propagating along LEISA’s interface cables to the focal
plane. However, definitive answers, if they can be determined, await further laboratory and in-flight measurements.
Nevertheless, for practical purposes, the phenomenology is well understood. MVIC shows no evidence of this effect.
7.0 IN-FLIGHT INSTRUMENT OPERATION
Ralph data collection operations fall into one of four categories: 1) panchromatic MVIC TDI, 2) color MVIC TDI, 3)
LEISA and 4) panchromatic MVIC framing. Ralph may operate in only one of these categories at any time meaning, for
example, that LEISA data may not be taken simultaneously with MVIC data. The panchromatic MVIC TDI category
covers operation in either of the panchromatic TDI CCD arrays, but only one pan array can be operated at any time. All
four color TDI CCDs operate simultaneously. As a result, a color MVIC scan is slightly longer than the equivalent Pan
TDI scan, because the target must be scanned over all 4 color CCDs. The category is chosen by command and
implemented by a set of relays.
For the MVIC TDI and LEISA data categories operation may be either in calculated rate mode or forced rate mode. In
calculated rate mode, the array read-out rate is set using the measured rotation rate about the scan axis (the Z-axis) as
determined by the spacecraft’s star trackers and gyroscopes. This scan rate is provided to Ralph at the beginning of a
scan by the spacecraft’s guidance and control (G&C) system. The array readout rate is set such that the scan moves a
spot on the image a single row between reads. In calculated rate mode, the MVIC TDI arrays may scan only in one
direction, but LEISA may scan in either direction. In forced rate mode, the array readout rate is set by a command and is
not coupled to the G&C scan rate. For all categories, data collection is initiated with a start command and continues until
a stop command is received. MVIC framing data is always obtained in forced rate mode.
There are two types of scans. The normal scan type is used when the target is sufficiently distant that the effective scan
rate of the boresight caused by the relative motion of the target and the spacecraft remains constant during the scan. For
a normal scan, once the rotation rate has stabilized, the along track thrusters are disabled and the spacecraft is allowed to
rotate at a constant rate. In calculated rate mode the rotation rate, measured to a 3σ accuracy of ±7µrad/sec is passed to
Ralph and the calculated frame rate is matched to the boresight motion. A normal type scan using calculated rate mode
is the most common form of either MVIC TDI or LEISA operation. Typically, in a normal LEISA scan, the cross track
thrusters are enabled so that the target does not drift off the focal plane in the direction perpendicular to the scan during
the data collection event. For a given target, the MVIC scans are usually almost an order of magnitude faster than the
LEISA scans, so the cross track thrusters are typically disabled in MVIC TDI scans. Correct operation of the normal
scan type has been verified in flight for both MVIC and LEISA using stellar sources.
When the target is sufficiently close that the effective rotation rate induced by the relative motion of the target and the
spacecraft changes during the scan, the scan becomes more complex. In this case, the rotation rate of the spacecraft is
changed during the scan by thruster firings. This type of scan, called a pseudo CB3 scan, is implemented by making the
boresight track an artificial object whose ephemeris is defined in such a fashion to keep the combined boresight rotation
rate constant. The frame rate is set by the commanded scan rate, and not by the changing spacecraft rotation rate as
measured by the G&C system. The scan is controlled to within ±34µrad/sec. Pseudo CB3 scans are only used when the
target is close to the spacecraft, such as the near closest approach LEISA and MVIC Pluto scans. For this type of
operation, both the in track and cross track thrusters are enabled during LEISA scans, while only the in track thrusters are
enabled during MVIC scans. Correct operation of the pseudo CB3 scan type has been verified in flight for both MVIC
and LEISA using an asteroid near encounter (Olkin et al, 2007).
8.0 CONCLUSION
This paper describes the design, operation and performance of Ralph, a highly capable remote sensing imager/IR spectral
imager flying on the New Horizons mission to the Pluto/Charon system and the Kuiper belt beyond. Ralph consists of a
telescope feeding two focal planes, the visible/NIR MVIC imager and the LEISA IR spectral imager. MVIC will provide
very sensitive, high fidelity, full hemispheric panchromatic maps of Pluto and Charon at a spatial resolution of 1
km/linepair and VIS/NIR color maps at a spatial resolution of better than 4km/linepair. LEISA will provide full
hemispheric, SWIR, spectral maps with spatial resolutions of 7 km/pixel or better. These will be used to accurately
characterize the surface composition. At closest approach, MVIC will obtain images with spatial resolutions on the
order of a few hundred meters in selected areas, while LEISA will measure spectra at the 1-2 km spatial scale. Ralph has
17been extensively tested at the component and full instrument level and its in-flight operation has verified that it meets all
its performance requirements with margin. Ralph will provide a wealth of information on the geology, composition,
morphology and thermal characteristics of the Pluto/Charon system. The data it produces during its flyby will
revolutionize our understanding of Pluto and its neighbors and will shed new light on the evolution of our solar system
and the nature of the objects in the Pluto system.
Eight years prior to arriving at Pluto, Ralph will observe Jupiter for a period of about 4 months during its close approach
for a gravity assist, starting in January of 2007. The closest approach of ~33 RJ will occur on 28 February, 2007. During
this period, numerous Ralph observations of Jupiter and its moons are planned to provide encounter practice and to
obtain calibration measurements on the last fully resolved object prior to the Pluto encounter 8 years hence. The LEISA
observation obtained at this time will be some of the highest spectral/spatial data ever obtained of Jupiter in the SWIR
spectral range. Thus New Horizons will provide exciting new science, even before its rendezvous with Pluto.
ACKNOWLEDGEMENTS
The authors would like to thank the entire Ralph support teams at BATC and SwRI and the LEISA support team at
GSFC for their untiring efforts in making Ralph a reality. The support of JDSU/Uniphase, E2V, Barr Associates and
Rockwell Scientific Corporation is also gratefully acknowledged.
9.0 REFERENCES
Cruikshank, Dale and Cristina M. Dalle Ore (private communication, 2000).
Grundy, W. M., B. Schmitt and E Quirico, "The Temperature Dependent Spectra of Alpha and Beta Nitrogen Ice with
Application to Triton." Icarus, 105, 254, 1993.
Olkin, C. B., D. C. Reuter, A. Lunsford, R. P. Binzel, S. A. Stern, ”The New Horizons Distant Flyby of Asteroid 2002
JF56.”, in preparation
Reuter, D. C., D. E. Jennings, G. H. McCabe, J. W. Travis, V. T. Bly, A. T. La, T. L. Nguyen, M. D. Jhabvala, P. K. Shu
and R. D. Endres, "Hyperspectral Sensing Using the Linear Etalon Imaging Spectral Array." SPIE Proceedings of the
European Symposium on Satellite Remote Sensing III: Conference on Sensors, Systems, and Next Generation Satellites
II, 2957, 154-161, September 23-26, 1996, Taorima, Sicily, Italy.
Reuter, D. C., G. H. McCabe, R. Dimitrov, S. M. Graham, D. E. Jennings, M. M. Matsumura, D. A. Rapchun and J. W.
Travis, “The LEISA/ Atmospheric Corrector (LAC) on EO-1”, IGARS Proceedings; IEEE 2001 International
Geoscience and Remote Sensing Symposium, Volume 1, 46–48, July 9–13, 2001, Sydney, Australia.
Reuter, Dennis, Alan Stern, James Baer, Lisa Hardaway, Donald Jennings, Stuart McMuldroch, Jeffrey Moore, Cathy
Olkin, Robert Parizek, Derek Sabatke, John Scherrer, John Stone, Jeffrey Van Cleve and Leslie Young, paper 5906-51,
“Ralph: A visible/infrared imager for the New Horizons Pluto/Kuiper Belt Mission”, SPIE Proceedings of the Optics and
Photonics Conference, Astrobiology and Planetary Missions, Vol. 5906, 59061F-1 to 59061F-11, July 31- August 4,
2005, San Diego CA.
Rosenberg, K. P., K. D. Hendrix, D. E. Jennings, D. C. Reuter, M. D. Jhabvala, and A. T. La, "Logarithmically Variable
Infrared Etalon Filters.", SPIE Proceedings, Optical Thin Films IV: New Developments, 2262, 25 - 27 July, 1994, San
Diego, CA.
Stern, S. A., D. C. Slater, W. Gibson, H. J. Reitsema, Alan Delamere, D. E. Jennings, D. C. Reuter, J. T. Clarke, C. C.
Porco, E. M. Shoemaker and J. R. Spencer, "The Highly Integrated Pluto Payload System (HIPPS): A Sciencecraft
Instrument for the Pluto Mission.", SPIE Proceedings, EUV, X-RAY and Gamma-Ray Instrumentation for Astronomy VI,
2518, 39 - 58, San Diego, CA; July 1995.
Ungar, S. G., J. S. Pearlman, J. A. Mendenhall, D. Reuter, “Overview of the Earth Observing One (EO-1) mission”,
IEEE Transactions on Geoscience and Remote Sensing, 41 (part 1), 1149-1159, 2003.
18You can also read