Rapid Coastal Assessment of the Marine Environment of Tuna Bay, Bootless Inlet, Port Moresby, Papua New Guinea
←
→
Page content transcription
If your browser does not render page correctly, please read the page content below
Rapid Coastal Assessment of the Marine Environment of
 Tuna Bay, Bootless Inlet, Port Moresby, Papua New Guinea

Rapid Coastal Assessment
of the Marine Environment
of Tuna Bay, Bootless Inlet,
Port Moresby,
Papua New Guinea

 1
Rapid Coastal Assessment of the
Marine Environment of Tuna Bay, Bootless Inlet,
 Port Moresby, Papua New Guinea
 Prepared for the Pacific Ridge to Reef Programme,
 Geoscience, Energy and Maritime Division,
 Pacific Community (SPC), Suva, Fiji

 Suva, Fiji, 2021
© Pacific Community (SPC) 2021
 All rights for commercial/for profit reproduction or translation, in any form, reserved.
 SPC authorises the partial reproduction or translation of this material for scientific,
 educational or research purposes, provided that SPC and the source document are
 properly acknowledged. Permission to reproduce the document and/or translate in whole,
 in any form, whether for commercial/for profit or non-profit purposes, must be requested
 in writing. Original SPC artwork may not be altered or separately published without
 permission.

 Original text: English

Citation: Simon Saulei, Pius Piskaut, Alfred Ko’ou, Beatrix Waiin, Robin Totome, Dan Kundun, Denica
Sapakali and Philomena Sengu. 2021. Rapid coastal assessment of the marine environment of
Tuna Bay, Bootless Inlet, Port Moresby, Papua New Guinea. Suva, Fiji SPC, 72 pp

Reviewed by: George Naboutuiloma, Samasoni Sauni, Dr. Antoine de Ramon N’Yeurt, Dr. Jade
Delevaux, John Carreon, Dr. Fononga Vainga Mangisi-Mafileo, Jose Antonio, Dr. Milika Sobey

Writing and editing support: Seema Deo (Footprints in the Sand Consulting)

Layout and Design by Navneet Lal / Pacific Community (SPC)

Produced by GEF Pacific International Waters Ridge to Reef Regional Project,
Pacific Community (SPC), Suva, Fiji.

 Prepared for publication at SPC’s Suva Regional Office, Private Mail Bag, Suva, Fiji, 2021
 www.spc.int | spc@spc.int

 Printed by Quality Print, Suva, Fiji, 2021
Rapid Coastal Assessment of the Marine Environment of
 Tuna Bay, Bootless Inlet, Port Moresby, Papua New Guinea

Contents
Abbreviations................................................................................................................................. v
List of Figures................................................................................................................................ vi
List of Tables................................................................................................................................. vii
Acknowledgement.......................................................................................................................viii
Introduction.................................................................................................................................... 1
 Project Background...................................................................................................................................................2
 Project Terms of Reference.......................................................................................................................................3
Project Objectives.......................................................................................................................... 3
 Rapid Assessment Approach....................................................................................................................................3
General Background to Tuna Bay................................................................................................... 5
 Geology.....................................................................................................................................................................5
 Topography...............................................................................................................................................................5
 Hydrology.................................................................................................................................................................5
 Soils ....................................................................................................................................................................... 5
 Vegetation.................................................................................................................................................................6
 Biodiversity Within Tuna Bay area............................................................................................................................6
 Population................................................................................................................................................................6
 Land- and Seascapes Use Patterns............................................................................................................................6
 Dogura and Taurama Development Plans................................................................................................................7
Biodiversity Assessment................................................................................................................. 8
 Mangrove Ecosystems..............................................................................................................................................8
 Introduction..........................................................................................................................................................8
 Study Sites............................................................................................................................................................9
 Methodology......................................................................................................................................................10
 Results................................................................................................................................................................10
 Discussion...........................................................................................................................................................14
 Conclusion..........................................................................................................................................................14
 Recommendation...............................................................................................................................................14
 Marine Ecosystems.................................................................................................................................................15
 Introduction........................................................................................................................................................15
 Study Site............................................................................................................................................................17
 Methodology......................................................................................................................................................17
 Marine Cover and Species Diversity...................................................................................................................17
 Data Analysis......................................................................................................................................................18
 Results................................................................................................................................................................19
 Habitat and Species Diversity.............................................................................................................................19
 Seagrasses..........................................................................................................................................................19
 Macroalgae.........................................................................................................................................................20
 Coral Diversity....................................................................................................................................................20
 Fish Assemblage.................................................................................................................................................21
 Discussion...........................................................................................................................................................23
 Conclusion..........................................................................................................................................................24
 Recommendation...............................................................................................................................................24

 iii
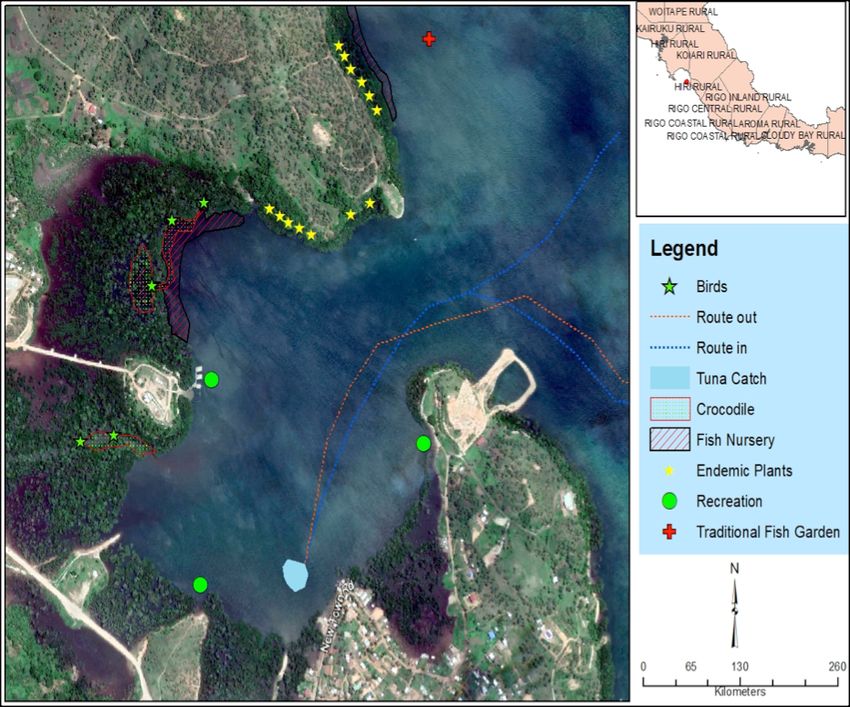
Significant Sites............................................................................................................................ 25
 Introduction............................................................................................................................................................25
 Methods.................................................................................................................................................................25
 Analysis...................................................................................................................................................................25
 Results....................................................................................................................................................................26
 Discussion...............................................................................................................................................................27
 Conclusion..............................................................................................................................................................28
 Recommendation...................................................................................................................................................28
 Water Quality Assessment........................................................................................................... 29
 Introduction............................................................................................................................................................29
 Study Site................................................................................................................................................................29
 Methodology..........................................................................................................................................................29
 Physico-chemical................................................................................................................................................29
 Microbiological Tests..........................................................................................................................................29
 Result ..................................................................................................................................................................... 30
 Physico-Chemical Parameters............................................................................................................................30
 Salinity and Conductivity....................................................................................................................................31
 Nitrate and Nitrite..............................................................................................................................................31
 Total Suspended Solids.......................................................................................................................................32
 Dissolved Oxygen (DO), Chemical Oxygen Demand (COD) and Biological Oxygen Demand (BOD)....................32
 Microbiological Tests..............................................................................................................................................33
 Coliform Counts..................................................................................................................................................33
 Discussion...............................................................................................................................................................36
 General Conclusion...................................................................................................................... 37
 Status of Tuna Bay..................................................................................................................................................37
 Biodiversity.............................................................................................................................................................38
 Water Quality.........................................................................................................................................................38
 References.................................................................................................................................... 39

 Appendices................................................................................................................................... 42
 Appendix 1: Mangroves of Bootless Bay................................................................................................................52
 Appendix 2: Seagrasses of Bootless Bay.................................................................................................................43
 Appendix 3: Cnidarians of Bootless Bay.................................................................................................................44
 Appendix 4: Crustaceans of Bootless Bay...............................................................................................................47
 Appendix 5: Echinoderms of Bootless Bay.............................................................................................................49
 Appendix 6: Molluscs of Bootless Bay....................................................................................................................52
 Appendix 7: Sponges of Bootless Bay.....................................................................................................................56
 Appendix 8: Macro-Algae of Bootless Bay..............................................................................................................57
 Appendix 9: Fishes of Bootless Bay........................................................................................................................58
 Appendix 10: Marine Mammals of Bootless Bay....................................................................................................72
 Appendix 11: Marine Reptiles of Bootless Bay.......................................................................................................72

iv
Rapid Coastal Assessment of the Marine Environment of
 Tuna Bay, Bootless Inlet, Port Moresby, Papua New Guinea

Abbreviations
BOD biological oxygen demand
CBNP Centre for Biodiversity and Natural Products
CEPA Conservation and Environment Protection Authority
CFU colony forming units
COD chemical oxygen demand
CPUE catch per unit effort
DO dissolved oxygen
GEF Global Environment Facility
HCV high conservation value
IW R2R International Waters Ridge to Reef project
MPN most probable number
UPNG University of Papua New Guinea
SPC Pacific Community
TDS total suspended solids
NCD National Capital District
NCDC National Capital District Commission
NGO/CBO non-government organisation/community-based organisation
TBC total bacteria count

 v
List of Figures
 Figure 1. Tuna Bay relative to Central Province and the National Capital District......................... 1
 Figure 2. Tuna Bay area................................................................................................................. 2
 Figure 3. Pictures from the first site visit to Tuna Bay. Removal of back mangroves were
 observed on the western portion of Tuna Bay............................................................... 4
 Figure 4. Pictures from the second site visit. Healthy mangroves were observed at the
 western portion of Tuna Bay........................................................................................... 4
 Figure 5. Dogura/ Taurama local development plan. Source: NCDC............................................. 7
 Figure 6. Mangrove belt transects................................................................................................. 9
 Figure 7. Mangrove percentage cover relative to disturbances.................................................. 11
 Figure 8. Diameter class distribution for Tuna Bay mangrove forest (all sites pooled)............... 12
 Figure 9. Mangrove profile diagram of site 3, depicting the community structure.
 Codes: EC = Eucalyptus confertiflora; BG = Bruguiera gymnorrhiza; CD = Ceriops
 decandra; RA = Rhizophora apiculata; RS = Rhizophora stylosa................................... 13
 Figure 11. Example of seagrass cover............................................................................................ 16
 Figure 10. Marine survey points transect survey and fishing net layouts..................................... 17
 Figure 12. Schematic diagram illustrating the marine sampling method...................................... 18
 Figure 13. The marine environment within Tuna Bay and its peripheries.................................... 19
 Figure 14. The occurrence of coral forms per 40 plots of 1 m x 1 m magnitude.......................... 20
 Figure 15. Significant sites within Tuna Bay................................................................................... 26
 Figure 16. Tuna Bay. The 4 poles mark the site where yellowfin tuna are caught as
 they travel in shoals (school) into the bay (see Figure 15)........................................... 27
 Figure 17. Reclamation of land at the east mouth of the bay. See also Figure 15........................ 28
 Figure 18. Tuna Bay showing water sampling sites. WQ represents microbial water
 quality tests. WC stands for water chemistry where major elements of
 interest and water parameters were tested................................................................. 30
 Figure 19. Results of salinity and conductivity analysis of water samples from
 various at sites Tuna Bay............................................................................................... 31
 Figure 20. Results of nitrate and nitrite concentration (mg/L) in water samples of Tuna Bay...... 32
 Figure 21. Total suspended solids in the bay................................................................................. 32
 Figure 22. Dissolved oxygen, biological oxygen demand and chemical oxygen demand.............. 33
 Figure 23. MPN results during wet and dry seasons and at high and low tides for all 8 sites...... 35
 Figure 24. TBC results during high and low tide and wet and dry seasons for all 8 sites.............. 35

vi
Rapid Coastal Assessment of the Marine Environment of
 Tuna Bay, Bootless Inlet, Port Moresby, Papua New Guinea

List of TABLES
Table 1. Floral diversity of Tuna Bay..............................................................................................10
Table 2. True mangrove species sampled and observed at Tuna Bay and around the
 Taurama area...................................................................................................................14
Table 3. Seagrasses species recorded in 1 m x 1 m plots (data pooled) .......................................20
Table 4. Common macroalgae recorded at the Tuna Bay..............................................................20
Table 5. Common corals recorded at Tuna Bay.............................................................................21
Table 6. Species richness in seven transects established at site 1................................................21
Table 7. Common fish catch in Tuna Bay and surrounding areas..................................................22
Table 8. Common coral families and other benthic life forms observed in all sites......................23
Table 9. High conservation value criteria for Tuna Bay.................................................................26
Table 10. Water quality tests of parameters..................................................................................30
Table 11. Preliminary results for MPN and TBC from eight sites....................................................34
Table 12. Results of positive E.coli, Salmonella and Vibrio detection in all 8 samples....................34

 vii
Acknowledgements
 The Authors and the University of Papua New Guinea Centre for Biodiversity and Natural Products
 would like to thank the Conservation and Environment Protection Authority (CEPA) and the Pacific
 Community (SPC) for awarding this project under the International Waters Ridge to Reef (IW
 R2R) Programme to Centre for Biodiversity and Natural Products (CBNP). The PNG IW R2R Project
 Coordinator, Mr. Senson Hornby Mark is gratefully acknowledged for his full support in producing
 this R2R Tuna Bay Rapid Assessment Report. The Authors also appreciate and thank the Acting
 Director of Motupore Island Research Centre, Mr John Genolangni and his staff (Roga Gabiobu, Elias
 Tovue and Togia) for their support during the fieldwork. Finally, CBNP would like to thank the staff of
 the Division of Biological Sciences, School of Natural and Physical Sciences, University of Papua New
 Guinea, for their tireless support to CBNP.

viii
Rapid Coastal Assessment of the Marine Environment of
 Tuna Bay, Bootless Inlet, Port Moresby, Papua New Guinea

Introduction
This report presents the review and rapid coastal assessment results of the Tuna Bay biodiversity
and water quality conducted from 27 November to 10 December, 2018.

The Conservation and Environment Protection Authority (CEPA) initiated the Tuna Bay marine
biodiversity and water quality rapid assessments. However, the actual work and evaluations were
carried out by the Centre for Biodiversity and Natural Products (CBNP) and the University of Papua
New Guinea (UPNG).

The area of Tuna Bay is approximately 2.0 km2 of land and seascape on the waterfront of Port
Moresby South Electorate in the National Capital District (NCD), Papua New Guinea. Eucalyptus-
savannah grasses and mangrove forests of high biodiversity surround Tuna Bay. There is a relatively
small and shallow (15 m depth) inlet on the Northwest side of Bootless Bay, a historical site and area
for tuna spawning and feeding. Figure 1 shows the features of Tuna Bay relative to Central Province
and Capital District.

Figure 1. Tuna Bay relative to Central Province and the National Capital District.

 1
Figure 2. Tuna Bay area
 Tuna Bay hosts the last remaining cultural heritage of the Motu-Koita people who are the landowners
 of the Tuna Bay and Port Moresby areas. There are villages within the vicinity of the bay and
 surrounding areas such as Pari and Tuna Bay/Taurama Villages.

 The Tuna Bay area is under imminent threat from the expansion of the city as well as from settlements
 that are sprawling around the bay and city area. This would lead to rapid environmental degradation
 that is facilitated by weak governance and increasing land sales by the local landowners.

 Project Background
 CEPA is the host agency of the PNG National International Waters Ridge to Reef (IW R2R) project.
 The IW R2R project is coordinated and administered by the Pacific Community (SPC) and reports to
 the United Nations Development Programme as the implementing Agency. The Global Environment
 Facility (GEF) funds the IW R2R project along with the STAR1 R2R project, as child projects of the GEF
 Pacific R2R Program.

 The GEF Pacific R2R Program’s objective is to maintain and enhance ecosystem goods and services
 of Pacific islands countries through integrated approaches to land, water, forest, biodiversity, and
 coastal management that contribute to poverty reduction, sustainable livelihoods and climate
 resilience. This report is the result of a rapid assessment of priority coastal areas conducted in Tuna
 Bay, and is an activity of the IW R2R project. The GEF funded IW R2R project tests the mainstreaming
 of R2R, climate resilience approaches to integrated land, water, forest and coastal management in
 14 PICs through strategic planning, capacity building and piloted local actions to sustain livelihoods
 and preserve ecosystem services.

 1
 STAR is the GEF System for Transparent Allocation of Resources

2
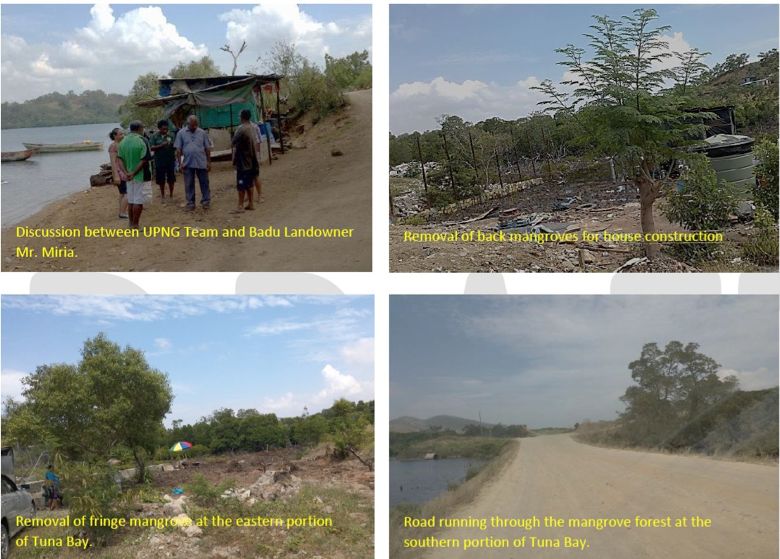
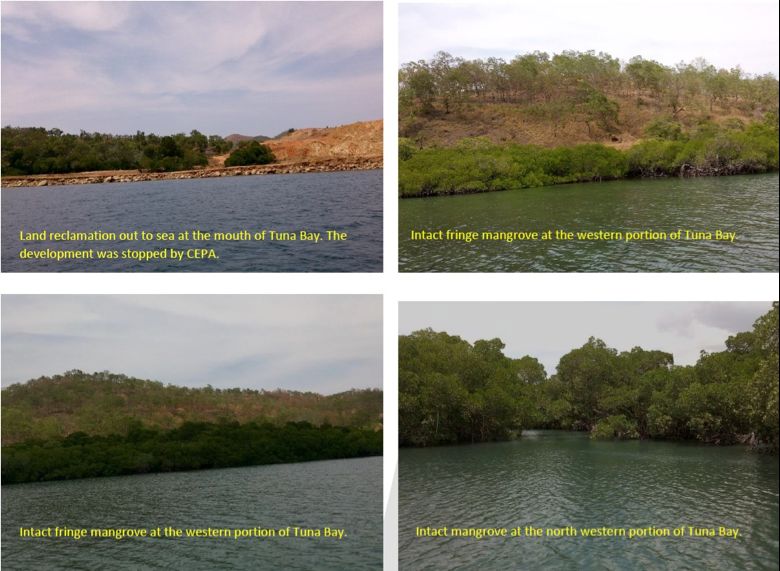
Rapid Coastal Assessment of the Marine Environment of
 Tuna Bay, Bootless Inlet, Port Moresby, Papua New Guinea

The PNG IW R2R demonstration project site is the Tuna Bay Area, which aimed to deliver on stress
reduction target of 220 ha area conserved and protected. The IW R2R project site runs alongside
the Bootless Bay Marine Conservation Initiative (BBMCI) Project, which includes the entire Bootless
Bay supported by JICA.

The PNG Project Coordination Unit (PCU), with supervision from CEPA and the Regional Project
Coordination Unit housed with the Pacific Community (RPCU-SPC), set up a Project Steering
Committee (PSC) to provide oversight and guidance to the PNG IW R2R Project. The PSC membership
is cross-sectoral and multi-disciplinary, covering relevant agencies in government and civil society,
including representatives from community groups, landowners and settlers. The current members
are representatives from CEPA as Chair, National Fisheries Authority (NFA), University of PNG (UPNG),
National Capital District Commission (NCDC), and relevant Government Agencies with support and
collaboration from non-government and community-based organisations (NGOs/CBOs) and private
sector.

Project Terms of Reference
There are two main terms of reference (TORs) for this IW R2R Project on Rapid Coastal Assessment
for the Tuna Bay Project, which are the Rapid (i) Biodiversity Assessments (mangroves and marine
ecosystems) and (ii) Water Quality Assessment.

Project Objectives
This project will enable CEPA to test its Protected Area Policy. This policy ensures sustainable
livelihood development for the local communities within the Tuna Bay area, the Bootless Bay area
and both the National Capital District and Central Province. If successfully implemented and targets
are achieved, the IW R2R project would have assisted in delivering PNG’s first Marine Protected
Area.

Rapid Assessment Approach
In this rapid coastal assessment, the Consultants considered several assessment approaches, planned
and executed a study strategy. The assessment team conducted scoping and initial visits to the sites.
The group visited and held discussions with traditional landowners and the new settlers to reach
mutual understanding and agreement for the rapid coastal assessment to proceed. All stakeholders
were advised of their roles in the project implementation.

The Consultants conducted two reconnaissance visits before sampling, the first on 8 November,
2018, and the second on 27 November, 2018. We accessed Tuna Bay from land on the first visit and
by sea on a follow-up visit. There was considerable degradation of mangrove habitats on the eastern
portion of the bay (Figure 3, 4).

 3
Figure 3. Pictures from the first site visit to Tuna Bay. Removal of back mangroves were observed on the
 western portion of Tuna Bay.

 Figure 4. Pictures from the second site visit. Healthy mangroves were observed at the western portion of
 Tuna Bay.

4
Rapid Coastal Assessment of the Marine Environment of
 Tuna Bay, Bootless Inlet, Port Moresby, Papua New Guinea

For the biodiversity assessment, the initial approach was to conduct an inventory assessment of
the biodiversity of the entire area encompassing all habitats observed in Tuna Bay. The focus of
the inventory assessment was on overall biodiversity patterns rather than an extensive or detailed
assessment of specific taxa or habitats.

We compared the results from the assessment of Tuna Bay with the results of a recent biodiversity
survey (Piskaut et al. 2018) conducted on the adjacent Bogoro Inlet and Motupore Island 5.0 km
south-east of Tuna Bay, within Bootless Bay.

General Background to Tuna Bay
Geology
The geology of the general Port Moresby area consists of Late to Middle Eocene beds, separated into
three distinct beds − Paga beds, Baruni limestone and Nebiri Limestone (JICA 1998). The Paga Beds
are common throughout the Tuna Bay area.

Topography
Tuna Bay is generally within a denudational landform, mainly characterised by undulating hills, ridges
and low coastal plains. The bay area is also flat to gently sloping with some roving hills, and ridges
mostly inland of Pari and Taurama have more relief. Elevations throughout the Bay area generally
range from sea level to 120 m (Bryan and Shearman 2008).

Hydrology
Within the bay area, there are several existing creeks and waterways discharging into the bay.
For most of these creeks and waterways, during the rainy periods, large volumes of freshwater,
sediment and debris export downstream at various flow rates and enter the bay (Hall 1984). In the
last 10 years, the quantities of rainwater and sediments passing through these creeks and waterways
and discharging into the bay have increased due to denudation of land cover from vegetation by
settlements (Pacific Climate Change Science Program 2011; Papua New Guinea National Weather
Service 2021). This also includes domestic and some industrial wastes – an additional source of
pollution into the bay.

Soils
The Tuna Bay area is characterised by the surrounding low mountains, hills and valleys with different
soil compositions and depth in each landform (Bleeker 1983). The hilly regions have Ustorthents soils,
which are typical of relatively dry and strongly seasonal climate areas and vary in colour from black,
dark grey to greyish brown sandy loams and clays (McIntosh and Doyle 2015). The plains and valley
areas are prominently Tropopsamments. This is a well-drained soil with thin dark topsoil. These
soils are generally poorly graded and sometimes contain moderate amounts of erodible materials
(Bleeker 1988).

 5
Vegetation
 Apart from the mangroves surrounding the Tuna Bay area, much of the area is generally featured by
 disturbed eucalyptus-savannah grassland vegetation.

 Biodiversity within Tuna Bay area
 The biodiversity status within the Tuna Bay is yet to be determined by this study. However, past
 research around the Bootless Bay area of which Tuna Bay is a part (Baine and Harasti 2007, Drew
 et al. 2012), suggests that Tuna Bay may have a high biodiversity of marine and terrestrial plants
 and animals. This study seeks to identify sites of high conservation values within the bay and its
 surrounding areas.

 Population
 The original landowners of Tuna Bay area, before the recent migrations of people settling in the
 area, live in the villages of Pari and Taurama (Stone 1876). They are the Motu and Koita speaking
 people (Groves et al. 1958). Recent demographic data put the Port Moresby population at around
 365,000 inhabitants, or 5 per cent of the total PNG population, with an annual growth rate of around
 3 per cent (National Statistical Office 2015). Such a large influx of population would inevitably stress
 available natural resources in the larger Port Moresby and Bootless Bay area, especially if liquid and
 solid waste disposal methods are not adequately controlled.

 Land- and Seascapes Use Patterns
 Due to the increasing demand for housing in Port Moresby, the traditional landowners of the
 Taurama area have been issuing leasehold agreements to settlers, mainly from Port Moresby. They
 have been building homes with no proper settlement plan (Tull 2011). Originally, people accessed
 the Taurama area through the Taurama Army Barracks, which is strictly controlled by the Papua New
 Guinea Defence Force (PNGDF). In 2012, a road was built around the Taurama Barracks through the
 mangroves. This road has enabled secure access to the Taurama area. Recently in 2015, a sealed road
 linking the Taurama and Dogura areas has enabled more people to have access to lands surrounding
 the Tuna Bay.

 Since 2012, more people have moved into Taurama, and this trend will continue until demand for
 settling in the area subsides. In contrast to the Taurama Army Barracks, the new settlers in the
 area have no municipal services. While the new settlers will demand municipal services from Port
 Moresby city, many residents of Port Moresby now access Taurama and Tuna Bay areas for recreation.
 Several stakeholders in the Taurama area are concerned about the unregulated, unapproved and
 unplanned development (Tull 2011). This concern is a management issue of paramount importance
 due to anthropogenic impacts related to these issues. As more people have access to the Taurama
 area, there will be an increase in the demand for resources to sustain the needs brought about by
 this change. Consequently, the degradation of habitats and waste pollution will increase over time.

6
Rapid Coastal Assessment of the Marine Environment of
 Tuna Bay, Bootless Inlet, Port Moresby, Papua New Guinea

Dogura and Taurama Development Plans
In time, the expanding city of Port Moresby will inevitably engulf Tuna Bay. The National Capital
District Commission (NCDC) has proposed the Dogura and Taurama Local Development Plan (Tull
2011). The plan (Figure 5) is currently being implemented, and the locals (traditional landowners)
within the development areas are responding to these new societal changes.

Figure 5. Dogura/ Taurama local development plan. Source: NCDC.

From 2012 to 2015, the Government constructed roads linking Port Moresby with the Taurama
and Dogura areas. These roads have enabled people to have easy access to the lands and natural
resources of the north-west side of Bootless Bay. The Tuna Bay area features prominently here,
providing space for settlements.

Consequently, the Tuna Bay ecosystem is changing rapidly, but changes have not been monitored
and documented. Therefore, relevant ecological information is lacking, which is necessary to ensure
that changes brought about by the development plan are environmentally friendly while allowing
the natural resources to continue supporting the original and new inhabitants of the area.

Large scale changes such as removal of mangroves are visible and receive immediate attention. Still,
changes to habitats will change the environmental (trophic structures) systems in the long term with
ramifications on human livelihoods. Importantly, the negative impacts of the Dogura/Taurama local
development plan on natural resources, such as loss of local species and degradation of habitats and
subsequent impact on the local people, in these areas, are of concern to all stakeholders and need
to be prevented or alleviated.

The local development plan has a 500 m protection zone around the NCD’s north-west side of
Bootless Bay. However, this zone is probably not implementable since much of it is under customary
land tenure, and consent is required to avoid future legal challenges.

 7
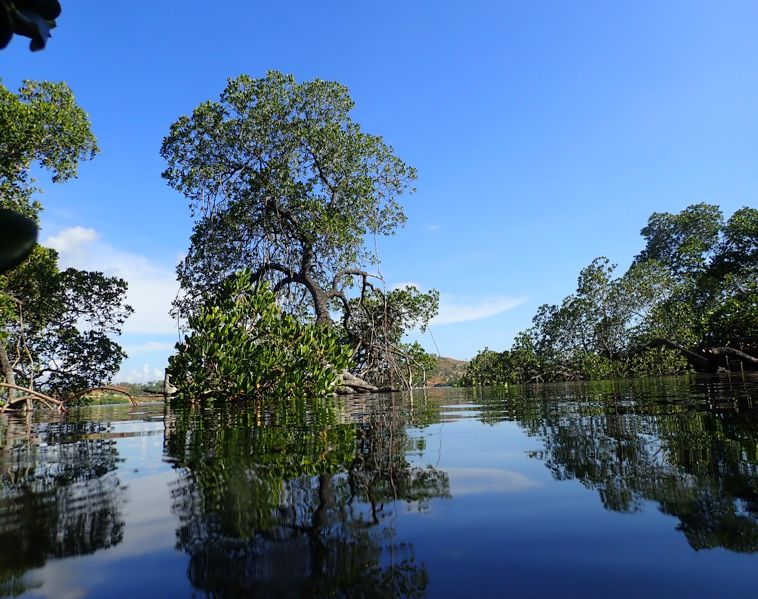
The development plan should also include strategies for the sustainable use and development of
 natural resources, especially natural scenic land and seascapes and essential food and commercial
 species. In the absence of such policies, the changes relating to development prospects are increasing
 the pressures on natural resources. Currently, the sustainability of natural resource utilisation in
 Tuna Bay is uncertain, and it is a significant challenge for both the landowners and the government.

 Biodiversity Assessment
 The Tuna Bay biodiversity assessment has two components:

 1. Mangrove Ecosystem Assessment.
 2. Marine Ecosystem Assessment.

 The Terms of Reference for this biodiversity assessment are: -

 i. Conduct a desktop review of historical and present environmental, socioeconomic and
 cultural information of the area;
 ii. Sample and assess the landscape, mangroves, estuaries and the sea of the Tuna Bay
 area; and
 iii. Provide in a report a bibliography; and lists of habitat types and of known species of
 mangroves, seagrasses, macroalgae, corals, crustaceans, echinoderms, fishes, reptiles,
 mammals and birds of the Tuna Bay area. The list of observed species fauna and flora is
 annexed to the report and their spatial distributions indicated on maps.
 This report documents the biodiversity of Tuna Bay. It establishes a baseline status of the area, and
 the outcomes useful to inform policy planning and decision making for Tuna Bay and to upscale future
 R2R investments and Integrated Coastal Management planning to other regions in the country.

 Mangrove Ecosystems

 Introduction
 Mangrove ecosystems occur in the estuaries and intertidal zones of many coastal areas in the tropics,
 including the Tuna Bay near Port Moresby (Ellison 1997; Maniwavie 2007 and Piskaut et al. 2018).
 Estuaries and intertidal zones are often characterised by freshwater runoff, sedimentation, tidal
 currents, waves and weather. These environmental factors are highly variable and their patterns
 affect salinity, temperature, pH, nutrient levels and microbial community. Despite this variability and
 changing trends, mangrove species are well adapted to the estuaries and intertidal zones, forming
 integrated ecosystems capable of functions comparable to that of marine and terrestrial ecosystems.

 Mangrove ecosystems function as habitat for both terrestrial and marine fauna (Nagelkerken et al.
 2008). Mangroves provide ecosystem services such as foods, fuelwoods and construction materials
 for many people who dwell in the mangrove ecosystems area (Raga 2006). The mangrove ecosystem
 of Tuna Bay is relatively small compared to the adjacent Galey Reach mangrove area. However,
 Tuna Bay mangroves contribute potentially to the overall ecological functions of the broader field
 of Bootless Bay. They also prevent soil erosion and sedimentation, which harms the seagrass beds
 and coral reefs; provide foraging, breeding and nursery grounds for many important food fishes
 (Laegdsgaard and Johnson 1995; Paillon et al. 2014); space for human habitation and are an important
 resource for supporting livelihoods in the area (Aye et al. 2019).

8
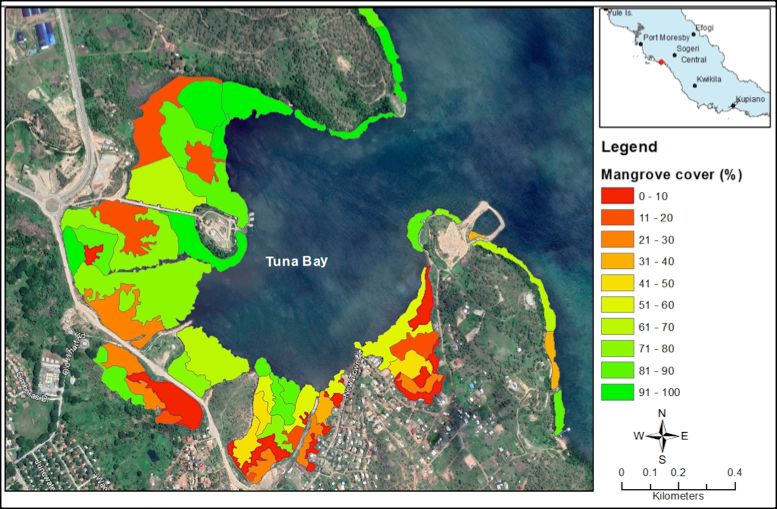
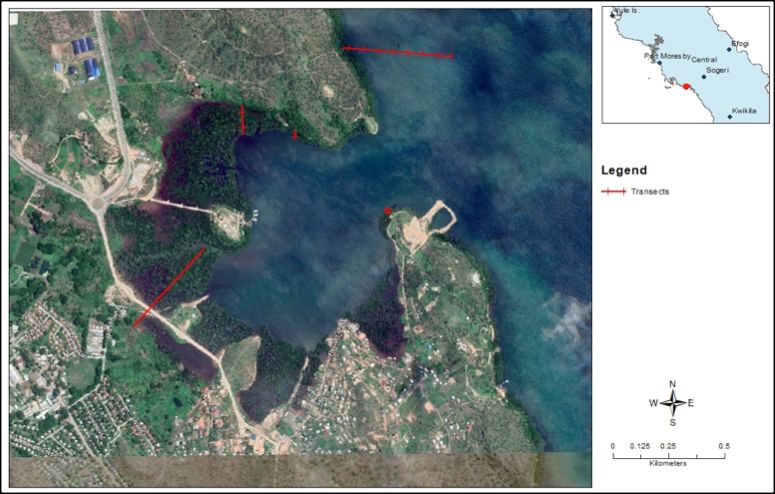
Rapid Coastal Assessment of the Marine Environment of
 Tuna Bay, Bootless Inlet, Port Moresby, Papua New Guinea

Mangrove litter is transformed into detritus, which (together with plankton and algae) supports the
mangrove ecosystem food-web. Mangrove detritus also supports the food-webs of the surrounding
ecosystems of seagrass and coral reefs (along with algae and seagrass) (Muro-Torres et al. 2020).

There are over thirty (30) mangrove species recorded within the Bootless Bay area (Maniwavie 2007
and Piskaut et al. 2018). True mangroves account for about 23 species in the Bogoro Inlet area,
including the islands (Piskaut et al. 2018). The majority of these species possibly coexist with other
resources in residence in Tuna Bay.

However, casual observations of the Tuna Bay area since 2010 indicate that the mangrove ecosystem
there is deteriorating rapidly. There are relatively large tracks of mangrove ecosystems transformed
into human-occupied settlements and constructions of linear structures such as roads.

Observed fauna within Tuna Bay mangrove ecosystem include birds, reptiles, mammals, insects,
crustaceans (crabs and shrimps), gastropods (shells), echinoderms (sea urchins and starfish), marine
worms, and fishes. This biological diversity is recorded under different taxa groups and listed in
appendices to this report.

Study Sites
Sites were preselected during the reconnaissance visits to Tuna Bay. A total of five sites were marked
as indicated in Figure 6.

Figure 6. Mangrove belt transects

 9
Methodology
 Four belt transects of 10 m width and varying lengths, traversing perpendicular to the coastline,
 were established (Figure 6). In each belt transect, all plants >1 m tall were identified to species
 level if possible (using available field guides and/or consulting with botanical experts at UPNG)
 and enumerated. The coordinates of each plant, relative to the tape measure, were recorded.
 Additionally, total height, bole height and stem diameter were taken at 1.3 m above ground or above
 prop roots, which were all recorded.

 All data were input to MS10 Excel spreadsheets and migrated into STATISCA 10 and SPSS 22 for
 analysis. Profile diagram of the mangrove forest was prepared from XY scatter plot in Excel and
 drawn in Paintbrush (MS Windows Accessories). Diameter analysis was categorised in STATISTICA
 and a pooled histogram produced (to avoid biases to recruitment, shrubs with diameter ≤5 cm, were
 excluded from the analysis).

 The mangrove percentage cover was assessed through satellite imagery (earth.google.com) and
 confirmed by ground truthing the entire area. The mangrove cover was scored from 0 per cent
 (bare land) to 100 per cent mangrove and classified into 10 classes, with intervals of 10 units. The
 percentage cover classes are: 0−10, 11−20, 21−30, 31−40, 41−-50, 51−60, 61−70, 71−80, 81−90,
 91−100. These classes were verified in ArcGIS 10.1 (Ezri 2012), then rectified through ground truthing.

 Results
 A total of 785 mangrove individuals was recorded from the 4 transects, comprising 23 species. Of
 this total, 7 species are mangrove associates (Table 1).

 Table 1. Mangrove and mangrove-associated floral diversity of Tuna Bay.

 Species Frequency Proportion Status
 Eucalyptus confertiflora 1 0.13 Savanna grassland
 Desmodium umbellatum 1 0.13 Mangrove associate
 Clerodendron inerme 2 0.25 Mangrove associate
 Xylocarpus granatum 5 0.64 True mangrove
 Ceriops decandra 173 22.04 True mangrove
 Rhizophora apiculata 202 25.73 True mangrove
 Bruguiera gymnorrhiza 225 28.66 True mangrove
 Bruguiera sexangula 3 0.38 True mangrove
 Rhizophora stylosa 32 4.08 True mangrove
 Canthium suborbiculare 1 0.13 Endemic, mangrove associate
 Avicennia marina 62 7.90 True mangrove
 Osbornia octodonta 1 0.13 True mangrove
 Ceriops tagal 26 3.31 True mangrove
 Rhizophora mucronata 7 0.89 True mangrove
 Pluchea indica 4 0.51 True mangrove
 Azadirachta indica 2 0.25 Invasive, mangrove associate

10
Rapid Coastal Assessment of the Marine Environment of
 Tuna Bay, Bootless Inlet, Port Moresby, Papua New Guinea

 Species Frequency Proportion Status
 Acrostichum aureum 9 1.15 Fern, true mangrove
 Excoecaria agallocha 9 1.15 True mangrove
 Bruguiera cylindrica 2 0.25 True mangrove
 Scyphiphora hydrophylacea 10 1.27 True mangrove
 Bruguiera exaristata 1 0.13 True mangrove
 Albizia carii 1 0.13 Endemic, mangrove associate
 Bruguiera x hybrid 6 0.76 Hybrid

The dominant mangrove species are Bruguiera gymnorrhiza, Ceriops decandra and Rhizophora
apiculata. Several mangrove individuals recorded in the middle zone of transect 4 appeared to be a
hybrid of Bruguiera gymnorrhiza x B. cylindrica; and has been given an identification of Bruguiera x
hybrid. There were also a few true mangrove species not recorded in the transects but which were
observed in other parts of Tuna Bay.

Two endemic species (Albizia carrii and Canthium suborbiculare) were observed at sites 2 and 3
(eastern mangrove forest), while an introduced/invasive species was recorded as back-mangrove
associate at site 4, near the Taurama Army Barracks.

As shown in the figure below, a good portion of the mangrove forest (south-eastern portion) is
deteriorating rapidly due to clearance for human settlement. Mangrove cover analysis indicates a
prevalence of less than 50 per cent cover at the south-eastern coastline of Tuna Bay, where new
settlements are quickly emerging.

Figure 7. Mangrove percentage cover relative to disturbances.

 11
Overall, the mangrove forest displayed a very depauperate structure (Figure 6 and 7). Diameter
 size analysis shows plants, ≤10 cm diameter, attributed over 80 per cent of the total stems sampled
 (Figure 8). The mangrove profile diagram shows smaller, stunted trees at the back, and progressively
 increases in height toward the sea edge (Figure 9). The forest is also fragmented as indicated by
 mangrove cover analysis (Figure 7) and the profile diagram (Figure 9).

 Figure 8. Diameter class
 distribution for Tuna Bay
 mangrove forest (all sites
 pooled).

12
Figure 9. Mangrove profile diagram of site 3, depicting the community structure. Codes: EC = Eucalyptus confertiflora; BG = Bruguiera gymnorrhiza; CD = Ceriops
decandra; RA = Rhizophora apiculata; RS = Rhizophora stylosa

 13
Discussion
 Maniwavie et al. (2007) and Piskaut et al. (2018) recorded 31 mangrove species within the entire
 Bootless Inlet. This study identified 15 true mangroves species occurring at the Tuna Bay and the
 surrounding Taurama area (Table 2).
 Table 2. True mangrove species sampled and observed at Tuna Bay and around the Taurama area.

 Family Scientific name Common name
 Combretaceae Lumnitzera racemosa White-flowered black mangrove
 Meliaceae Xylocarpus granatum Cannonball mangrove
 Myrtaceae Osbornia octodonta Myrtle mangrove
 Rhizophoraceae Bruguiera gymnorrhiza Large-leaf orange mangrove
 Ceriops decandra
 Ceriops tagal var. tagal Rib-fruited yellow mangrove
 Rhizophora apiculata Corky stilt mangrove
 Rhizophora lamarckii Southern hybrid stilt mangrove
 Rhizophora mucronata Upstream stilt mangrove
 Bruguiera sexangula Upriver orange mangrove
 Bruguiera x hybrid
 Rhizophora stylosa Long-styled stilt mangrove
 Sonneratiaceae Sonneratia alba White-flowered apple mangrove
 Verbenaceae Avicennia marina Grey/white mangrove
 Avicennia eucalyptifolia Grey/white mangrove

 Frodin (1983), Hopkins and Menzies (1995) and Piskaut et al. (2018) recorded 11 endemic species
 occurring within the Bootless Bay area. Within Tuna Bay, only two endemic species were recorded
 behind the mangrove on raised rocky outcrops at the western part (mouth) of the bay. Confined to
 rocky outcrops are the endemic plant species of the Eastern Papua coastline. Mangroves dominate
 coverage of the mudflat in the bay. Rocky outcrops are uncommon in the bay, but most had been
 cleared for human settlement, hence, the demise of other endemic flora and fauna.

 The mangrove forest displays a very depauperate community. The abundance of mangrove plants,
Rapid Coastal Assessment of the Marine Environment of
 Tuna Bay, Bootless Inlet, Port Moresby, Papua New Guinea

Marine Ecosystems

Introduction
The marine ecosystems of Bootless Bay are comprised of estuaries (saltmarshes and mudflats),
exposed and sheltered rocky shores, intertidal flats consisting mainly of seagrass beds and sand
flats, fringing coral reefs, and the barrier reef.

The sea surface temperature, salinity and pH ranges are 25°C−31°C (average about 28°C), 28 ppt−35
ppt (average about 32 ppt), and 7.92−8.24 respectively (Ko’ou 2014). The salinity has commonly
been recorded at approximately 35 ppt with estuarine hypersaline conditions reaching up to 38 ppt,
especially during dry seasons.

The tidal fluctuations caused by high and low tides, winds and waves are the main forces driving
the sea surface current within Bootless Bay. The high tide reaches up to 2 m high, and tidal flushing
keeps the bay saltwater clean.

Tuna Bay is an estuarine and marine ecosystem, which provides many essential goods and services
to the local population even as far as Port Moresby. Essentially, every component of marine
biodiversity has an important ecological role to play in maintaining ecosystem health and function
(Baine and Harasti 2007). The integrity, stability and sustainability of marine biodiversity cannot be
compromised by humans whose lives depend on this biodiversity.

While the Tuna Bay environment is dynamic and changes to its marine ecosystems are inevitable, its
inhabitants need to understand these changes and adapt in ways that ensure long-term sustainable
livelihoods. Ecological information and understanding of Tuna Bay area dynamics and its biodiversity
is critical as a sound basis for the conservation of threatened biodiversity, spatial management of
natural resources, and development planning.

Biodiversity is defined as the diversity of life forms and includes the richness, evenness and
composition of species, genes and ecological processes, which make up the terrestrial, freshwater
and marine ecosystems (Nagelkerken et al. 2008). The functions (productivity), integrity and stability
of these ecosystems depend on the existing biodiversity in these ecosystems. Unfortunately, available
evidence suggests that biodiversity is rapidly declining in many areas of the world (Nagelkerken et al.
2008) including PNG, where declines are obvious and prevalent in the settlement, mined and logged
areas. Biodiversity decline through species loss and habitat degradation is directly affecting human
wellbeing as a result of decrease in the services that ecosystems can provide.

The causes and consequences of biodiversity decline have been the focus of discussions in the past
two decades and are well documented (Nagelkerken et al. 2008). However, causes and consequences
of biodiversity decline are location-specific and requires local inhabitants to understand this so
that appropriate development and management strategies can be implemented at local scales to
mitigate the causes and prevent their consequential impacts. Indeed, the natural and anthropogenic
processes that influence biodiversity decline and their consequences on both the natural systems
and human livelihoods need to be understood and managed where it is possible. The people’s and
government’s ability to understand these processes helps in the prevention of biodiversity decline
and sustainable management of the biodiversity that many livelihoods depend upon.

Generally, there has been limited research on the marine biodiversity of Tuna Bay. Optimistically,
Tuna Bay is part of Bootless Bay and is expected to have biodiversity assemblages similar to that for
other sites (i.e., Bogoro Inlet) within Bootless Bay. Therefore, extrapolations of available information
from studies done in Bootless Bay as well as adjacent to Port Moresby Harbour and Caution Bay, will

 15
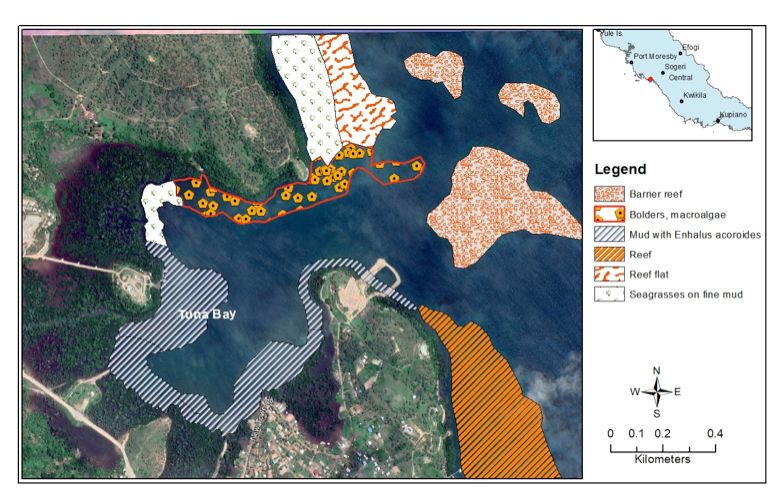
help document the biodiversity of Tuna Bay. Inventory assessment of biodiversity of Tuna Bay can
 distinguish which species and ecological processes are active within the Tuna Bay area.

 Known species and biodiversity inhabiting Bootless Bay, including the Tuna Bay area, are listed in
 the ensuing subsections and in the appendices. Bootless Bay has 283 species of terrestrial plants, 24
 species of mangroves, 10 species of seagrasses, 81 species of birds, 4 species of marine mammals, 1
 species of crocodile, 3 species of sea snakes, 3 species of turtles, 512,488 species of marine fishes,
 284 species of reef corals, and many species of marine algae, crustaceans, echinoderms and molluscs
 (Piskaut et al. 2018; Drew et al. 2012; Baine and Harasti 2007; Coleman 1998).

 The biodiversity of Bootless Bay is comparable to many marine ecosystems in PNG and the region
 and is characterised by many important features of high socio-economic and conservation value.
 These features include:

 • many ecosystems, for example, forest, saltmarsh, mangrove, mudflats, seagrass beds
 and coral reefs;
 • presence of seven endemic plant species;
 • breeding and nursery grounds for many species, for example, turtle nesting site;
 • foraging grounds for many species, for example, pelagic tuna species; and
 • presence of valuable commercial species, e.g., sea cucumbers.

 Piskaut et al. (2018) noted that these important features are slowly being wiped out through the
 destruction of natural habitats and over-exploitation of natural resources. This may be a result of
 the expansion of Port Moresby City and the increasing population of Central Province (Piskaut et al.
 2018).

 5% 25% 40%

 55% 65% 80%
 Figure 11. Example of seagrass cover.

16
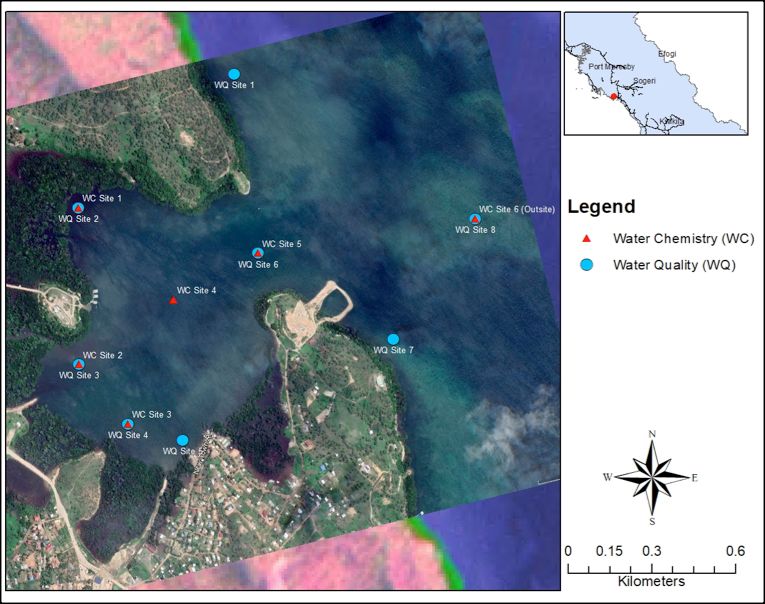
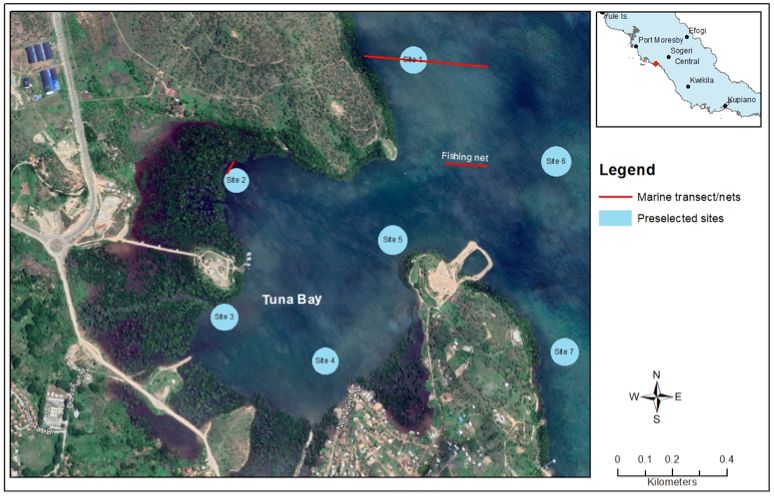
Rapid Coastal Assessment of the Marine Environment of
 Tuna Bay, Bootless Inlet, Port Moresby, Papua New Guinea

Study Site
Using maps, seven sites were preselected based on the distribution of observed habitats. These are
indicated in Figure 10, including placement of fishing nets.

Figure 10. Marine survey points transect survey and fishing net layouts.

Methodology

Marine Cover and Species Diversity
Within the bay enclosure, visibility was very poor due to high turbidity during the survey period (28
November to 15 December, 2018), making it impossible to survey all the sites. A detailed survey
was conducted at site 1 while other sites were visually observed, where observations of seagrasses,
corals, substrates and fish species were casually recorded. Two fishing nets (1” and 4”) were placed
as indicated in Figure 10.

Benthic cover was assessed at site 1. Transects of 40 m x 1 m were employed to determine the cover
type and biodiversity. Seven transects were established perpendicular to the coastline and placed at
50 m intervals from each other. Figure 10 shows a schematic layout of the transects.

Cover types were assessed in 1 m x 1 m quadrats. Forty (40) quadrats were established along
the transect. In each quadrat, the percentage cover, relative to the quadrat, was scored for the
following cover categories: seagrass, coral, macroalgae, sand, mud, rubble, and rocks (Figure 11).
The cover categories represent the microhabitats common within the bay. All organisms (seagrasses,
macroalgae, fishes, sea cucumbers, sea stars, molluscs, etc.) present in the 1 m x 1 m quadrats were
also recorded.

 17
Coastline
 Mangrove /beach fo

 Coastline
 rest

 Figure 12. Schematic 12. SCHEMATIC
 FIGUREdiagram DIAGRAM
 illustrating ILLUSTRATING
 the marine samplingTHE MARINE SAMPLING METHOD.
 method.

 FishSurvey
 Fish Survey
 Underwater visual
 Underwater visualcensus
 census(UVC)
 (UVC)waswasused to conduct
 used the fish
 to conduct thesurvey. Commonly,
 fish survey. 5 m x 405mmtransects
 Commonly, x 40 m
 were established parallel to the coastline at site 1 (Figure 8) and set at 50 m intervals
 transects were established parallel to the coastline at site 1 (Figure 8) and set at 50 m intervalstoward the reef
 slope at depths of approximately 1 m (low tide) to 5 m. Six such transects were established. At each
 toward the reef slope at depths of approximately 1 m (low tide) to 5 m. Six such transects were
 transect, the recorder snorkels along the transect and records any fish that is seen along the line of
 established.
 travel. At each transect, the recorder snorkels along the transect and records any fish that
 is seen along the line of travel.
 The study also employed a capture method through the use of the fishing net and handline fishing
 techniques.
 The A 4”employed
 study also mesh size agillnet (5 mmethod
 capture x 50 m)through
 was set the
 at the
 usemouth
 of theof fishing
 the bay,net
 andand
 a smaller
 handline1”
 mesh-size
 fishing net was utilised
 techniques. at thesize
 A 4” mesh mangrove edge
 gillnet (5 m xof50site
 m)3 was
 (see set
 Figure 8). The
 at the mouthnet soak times
 of the bay,were
 and 2a
 hours for the 1” net and 5 hours for the 4” net.
 smaller 1” mesh-size net was utilised at the mangrove edge of site 3 (see Figure 8). The net soak
 times were
 Handline 2 hours
 fishing wasfor the 1” netatand
 conducted site51.hours for the 4” spent
 The fishermen net. up to one hour of fishing using 10
 pounds to 20 pounds nylon strings.
 Handline fishing was conducted at site 1. The fishermen spent up to one hour of fishing using
 The researchers also conducted an ad-hoc survey to determine fish commonly caught. Parameters
 10 pounds to 20 pounds nylon strings.
 recorded included the time of day, type of fishing method used (diving, line, fishing nets and
 dynamite) and vessel type (canoe or dinghy).

 Data Analysis
 22
 All data were entered into an MS Excel spreadsheet and, for each site, the average cover was
 calculated. Records of other organisms were also entered into the same spreadsheet. All data were
 subjected to quality checks to verify correct identification, spelling and correct site of collection.

18
You can also read