Rapid environmental responses to climate-induced hydrographic changes in the Baltic Sea entrance - Biogeosciences
←
→
Page content transcription
If your browser does not render page correctly, please read the page content below
Biogeosciences, 16, 3835–3852, 2019
https://doi.org/10.5194/bg-16-3835-2019
© Author(s) 2019. This work is distributed under
the Creative Commons Attribution 4.0 License.

Rapid environmental responses to climate-induced hydrographic
changes in the Baltic Sea entrance
Laurie M. Charrieau1 , Karl Ljung1 , Frederik Schenk2 , Ute Daewel3 , Emma Kritzberg4 , and Helena L. Filipsson1
1 Department of Geology, Lund University, Lund, Sweden
2 BolinCentre for Climate Research and Department of Geological Sciences, Stockholm University, Stockholm, Sweden
3 Department of System Analysis and Modelling, Centre for Materials and Coastal Research, Geesthacht, Germany
4 Department of Biology, Lund University, Lund, Sweden

Correspondence: Helena L. Filipsson (helena.filipsson@geol.lu.se)

Received: 22 May 2019 – Discussion started: 12 June 2019
Revised: 19 August 2019 – Accepted: 25 August 2019 – Published: 7 October 2019

Abstract. The Öresund (the Sound), which is a part of the        the foraminiferal assemblage did not rebound. Instead, the
Danish straits, is linking the marine North Sea and the brack-   foraminiferal faunas displayed a new equilibrium state.
ish Baltic Sea. It is a transition zone where ecosystems
are subjected to large gradients in terms of salinity, tem-
perature, carbonate chemistry, and dissolved oxygen con-
centration. In addition to the highly variable environmental     1   Introduction
conditions, the area is responding to anthropogenic distur-
bances in, e.g., nutrient loading, temperature, and pH. We       The Öresund (the Sound) is one part of the Danish straits be-
have reconstructed environmental changes in the Öresund          tween Sweden and Denmark. Together with the Great and
during the last ca. 200 years, and especially dissolved oxy-     Little belts, they link the open-ocean waters of the North
gen concentration, salinity, organic matter content, and pol-    Sea and the brackish waters of the Baltic Sea. The con-
lution levels, using benthic foraminifera and sediment geo-      fluence of the water masses creates a north–south gradi-
chemistry. Five zones with characteristic foraminiferal as-      ent as well as a strong vertical stratification of the water in
semblages were identified, each reflecting the environmen-       terms of salinity, carbonate chemistry, and dissolved oxygen
tal conditions for the respective period. The largest changes    concentration ([O2 ]) (Leppäranta and Myrberg, 2009). The
occurred around 1950, when the foraminiferal assemblage          depth of the halocline mainly depends of the outflows from
shifted from a low diversity fauna dominated by the species      the Baltic Sea; a strong thermocline develops during spring
Stainforthia fusiformis to higher diversity and abundance and    and summer, which further strengthens the vertical stratifi-
dominance of the Elphidium species. Concurrently, the grain-     cation. Thus, the ecosystems in the Öresund are exposed –
size distribution shifted from clayey to sandier sediment. To    and adapted – to a unique transitional environment. The re-
explore the causes of the environmental changes, we used         gion is also characterized by intense human activities, with
time series of reconstructed wind conditions coupled with        4 million people living in the vicinity of the Öresund and
large-scale climate variations as recorded by the North At-      85 million people living in the catchment area of the Baltic
lantic Oscillation (NAO) index as well as the ECOSMO II          Sea (HELCOM, 2009). Discharge from agriculture, indus-
model of currents in the Öresund area. The results indicate      try, and urban areas on both the Swedish and Danish sides
increased changes in the water circulation towards stronger      of the strait and the considerable impact of marine traffic –
currents in the area after the 1950s. The foraminiferal fauna    the strait is one of the busiest waterways in the world – gen-
responded quickly (
3836                    L. M. Charrieau et al.: Rapid environmental responses to climate-induced hydrographic changes

coming from river run-off (Nausch et al., 1999; Carstensen         culation changes in the Öresund area during the period 1948–
et al., 2006; Rydberg et al., 2006). However, these efforts in     2013.
decreasing nutrient loads have not resulted in improved water
quality, due to the long timescales of biogeochemical cycles
in reaching equilibrium in the Baltic Sea region (Gustafsson       2   Study site
et al., 2012). The Öresund, like most of the Baltic Sea, is
still assessed to be eutrophic, and hypoxic events are frequent    The Öresund is a 118 km long narrow strait (Fig. 1). The
(Rosenberg et al., 1996; Conley et al., 2007, 2011; HEL-           water depth in the northern part is on average 24 m, but it
COM, 2009; Wesslander et al., 2016). Moreover, increas-            reaches 53 m south of the island of Ven. The Öresund is an
ing temperatures and declining pH, linked to global climate        important link between the North Sea, Skagerrak, Kattegat,
change and ocean acidification, have been reported for sur-        and the Baltic Sea (Fig. 1), and up to 30 % of the water ex-
face and bottom waters in the area (Andersson et al., 2008;        change in the region goes through the Öresund (Sayin and
Göransson, 2017). As a result, ecosystems in the Öresund           Krauß, 1996; Leppäranta and Myrberg, 2009). The remain-
are currently under the combined impact of natural and an-         ing part goes through the Great and Little belts. The width of
thropogenic stressors (Henriksson, 1969; Göransson et al.,         the Öresund varies between 4 and 28 km, and the water has
2002; HELCOM, 2009; ICES, 2010). The multiple stressors            overall high current velocities, up to 1.5 m s−1 at the upper
currently affecting the environment make this region particu-      water layer in the northern part (Nielsen, 2001). The fully
larly interesting to study and also highlight the need to obtain   marine Skagerrak consists of water masses from the North
records of decadal and centennial environmental changes. As        Sea and the North Atlantic and in general a thin surface layer
noted above, both recent human-induced impacts and climate         with water originating from the Baltic Sea and rivers drain-
variability have been substantial in the region. Therefore the     ing into the sea; the water circulation forms a cyclonic gyre
question arises whether these factors have affected the ben-       (cf. Erbs-Hansen et al., 2012). Parts of the Skagerrak waters
thic environment. Furthermore, sediment records of past en-        reach the Kattegat and the Baltic Sea, where they are succes-
vironmental changes can provide a crucial context for ongo-        sively diluted with the large amounts of freshwater (around
ing and future predicted changes in the Öresund and Baltic         15 000 m3 s−1 , Bergström and Carlsson, 1994) draining into
Sea regions.                                                       the Baltic Sea from numerous large rivers. The low-saline
   We used the marine sediment record and its contents             Baltic Sea surface water is transported by the Baltic Current,
of foraminifera as well as sediment geochemistry to ob-            which is typically confined along the Swedish western coast
tain records of decadal environmental changes. Benthic             in the Kattegat but which may cover a larger surface area to-
foraminifera are widely used for environmental recon-              wards the west, depending on wind direction. The Baltic Cur-
structions, based on their rapid response to environmental         rent later joins the Norwegian Coastal Current in the Skager-
changes, broad distribution, high densities, and often well-       rak (Fig. 1). The large freshwater input and the subsequent
preserved tests (shells) in the sediment (e.g., Sen Gupta,         large salinity difference between the Kattegat and Baltic Sea
1999b; Murray, 2006). For instance, distributions of benthic       result in a two-layer structure in the Öresund (Fig. 2) (She et
foraminifera have been used for historical environmental re-       al., 2007; Leppäranta and Myrberg, 2009). The water strati-
constructions of fjords on decadal to centennial timescales        fication is influenced by the surface water from the Arkona
on the Swedish western coast (Nordberg et al., 2000; Fil-          Basin (salinity 7.5–8.5), the surface water from the Kattegat
ipsson and Nordberg, 2004a, b; Polovodova Asteman and              upper layer (salinity 18–26), and the lower layer of the Kat-
Nordberg, 2013; Polovodova Asteman et al., 2015) and in            tegat (salinity 32–34).
the Kattegat (Seidenkrantz, 1993; Christiansen et al., 1996).         Salinity, temperature, pH, [O2 ], and nutrient content, here
In the Öresund, living foraminiferal assemblages have been         represented by dissolved inorganic nitrogen concentration
studied (Hansen, 1965; Charrieau et al., 2018), but to the         [DIN] (nitrate + nitrite + ammonium), in the surface and bot-
best of our knowledge, no studies of past foraminiferal as-        tom waters of the Öresund vary seasonally (Fig. 3, Sup-
semblages have been performed. The objective of this study         plement Fig. S1). At the surface and bottom water, salin-
was to reconstruct the environmental conditions of benthic         ity ranges between ∼ 8 and ∼ 18 and between ∼ 29 and
systems during the last 2 centuries in the Öresund by us-          ∼ 34, respectively, and it is more stable between April and
ing foraminiferal fauna analysis in combination with sedi-         July, when the stratification is strongest (Fig. 3). Tempera-
ment geochemistry and grain size. Furthermore, we analyzed         ture ranges between ∼ 1 ◦ C in February and ∼ 19 ◦ C in July
long time series of wind conditions in the area to evaluate        in the surface water, while in the bottom water, the low-
the coupling between local changes in ecosystem variables          est temperature is found in March–April with ∼ 5◦ C, and
and variations in atmospheric and subsequent hydrographic          the highest temperature in October–November with ∼ 13 ◦ C.
conditions, and a possible link with large-scale variations ex-    The pH varies between ∼ 8.1 and ∼ 8.6 in the surface wa-
pressed through the North Atlantic Oscillation (NAO) index.        ter, and between ∼ 7.8 and ∼ 8.6 in the bottom water, with-
Finally, we compared our data with the ECOSMO II model             out a clear seasonal pattern (Fig. 3). [O2 ] in the bottom wa-
(Daewel and Schrum, 2013, 2017) of currents and water cir-         ter reaches ∼ 7 mL L−1 in January, and it is typically below

Biogeosciences, 16, 3835–3852, 2019                                                    www.biogeosciences.net/16/3835/2019/

L. M. Charrieau et al.: Rapid environmental responses to climate-induced hydrographic changes                                         3837

Figure 1. Map of the studied area. The star shows the focused station of this study. General water circulation: main surface currents (black
arrows) and main deep currents (grey arrows). GB: Great Belt; LB: Little Belt; AW: Atlantic Water; CNSW: Central North Sea Water; JCW;
Jutland Coastal Water; NCC: Norwegian Coastal Current; BW: Baltic Water. Insert source: ©BSHC.

2 mL L−1 in October, approaching hypoxic values. In the sur-            eter) were collected using a GEMAX twin-barrel corer. The
face water, [DIN] can reach ∼ 7 µmol L−1 in January, and it             corer allowed sampling of 30 and 36 cm long sediment cores
is ∼ 0 µmol L−1 between April and August (Fig. 3).                      (referred to in this study as cores DV1-G and DV1-I, respec-
                                                                        tively), which were sliced into 1 cm sections. The samples
                                                                        from the DV1-G core were analyzed for carbon and nitro-
3     Materials and methods                                             gen content and grain size distribution, and were dated us-
                                                                        ing Gamma spectroscopy. The samples from the DV1-I core
3.1    Sampling                                                         were analyzed with respect to foraminiferal fauna and carbon
                                                                        and nitrogen content. The distinct carbon content profiles,
A suite of sediment cores, as well as water samples from                measured on both cores, were used to correlate the 210 Pb
the water column, were collected in November 2013 dur-                  dated DV1-G core with the DV1-I core used for foraminiferal
ing a cruise with R/V Skagerak. Here we present the data                analyses.
from two sediment cores sampled at Öresund station DV-
1 (55◦ 55.590 N, 12◦ 42.660 E) (Fig. 1), north of the island of
Ven. The water depth was 45 m, and CTD (conductivity, tem-              3.2    Chronology
perature, depth) casts were taken to measure salinity, temper-
ature, and [O2 ] in the water column. Water samples were col-           The age–depth model was established using 210 Pb and 137 Cs
lected at 10, 15, 20, 30, and 43 m from the Niskin bottles for          techniques on samples from the DV1-G core. The samples
carbonate chemistry analyses. The CTD and carbonate chem-               were measured with an ORTEC HPGe (High-Purity Ger-
istry data are presented in Charrieau et al. (2018). In general,        manium) Gamma Detector at the Department of Geology
it is challenging to obtain sediment cores in the Öresund, due          at Lund University, Sweden. Corrections for self-absorption
to the high current velocities up to 1.5 m s−1 (Nielsen, 2001),         were made for 210 Pb following Cutshall et al. (1983). The
human-induced disturbances, and limited areas of recent sed-            instruments were calibrated against in-house standards and
iment deposition (Lumborg, 2005), but our site north of Ven             the maximum error was 0.5 years in the measurements. Ex-
represents an accumulation area. The cores (9 cm inner diam-            cess (unsupported) 210 Pb was measured down to 23 cm and

www.biogeosciences.net/16/3835/2019/                                                             Biogeosciences, 16, 3835–3852, 2019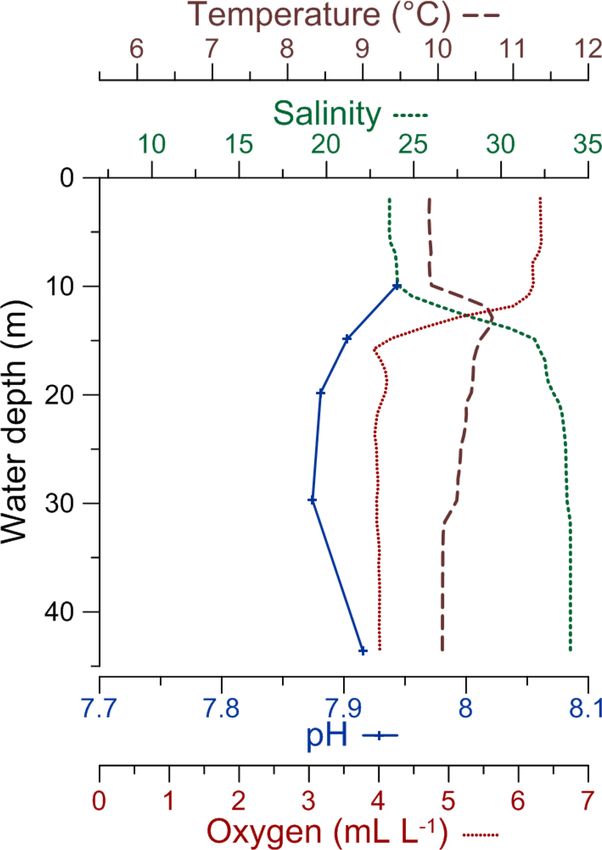
3838                     L. M. Charrieau et al.: Rapid environmental responses to climate-induced hydrographic changes

                                                                     Skagerrak–Kattegat region (Asteman and Schönfeld, 2016).
                                                                     However, a comparison of N. stella DNA sequences from
                                                                     the Santa Barbara Basin (USA) (Bernhard et al., 1997) with
                                                                     the Swedish western coast specimens demonstrates that they
                                                                     represent two closely related species but are not conspecific
                                                                     (Deldicq et al., 2019). Therefore, we have referred to the
                                                                     species found here as Nonionella sp. T1, following Deldicq
                                                                     et al. (2019). The species Verneuilina media (here referred to
                                                                     as the genus Eggerelloides), which has often been reported
                                                                     in previous studies from the Skagerrak–Kattegat area (e.g.,
                                                                     Conradsen et al., 1994), was morphologically close to Eg-
                                                                     gerelloides scabrus in the present material, and these two
                                                                     species have been grouped as E. medius/scabrus. The taxon
                                                                     Elphidium excavatum forma clavata (cf. Feyling-Hanssen,
                                                                     1972) was referred to as Elphidium clavatum following
                                                                     Darling et al. (2016). Elphidium clavatum and Elphidium
                                                                     selseyense (Heron-Allen and Earland, 1911) were morpho-
                                                                     logically difficult to separate in this region, as transitional
                                                                     forms occur. The dominant species was E. clavatum, but we
                                                                     acknowledge that a few individuals of E. selseyense could
                                                                     have been included in the counts. The taxon Ammonia bec-
                                                                     carii was referred to as Ammonia batava, following recent
                                                                     molecular work done on the taxon Ammonia in the Kattegat
                                                                     region (Groeneveld et al., 2018; Bird et al., 2019).
                                                                        Foraminiferal density was calculated and normalized to
Figure 2. CTD profiles of temperature, salinity, pH, and dissolved
oxygen concentration in the water column for the DV-1 station        the number of specimens per 50 cm3 . Data of densities for
(modified from Charrieau et al., 2018).                              the first 2 cm of the core are from Charrieau et al. (2018).
                                                                     Some specimens displayed decalcified tests; however, the in-
                                                                     ner organic linings were preserved. These inner organic lin-
the age model was calculated based on the Constant Rate of           ings were reported separately and not included in the to-
210 Pb Supply (CRS) model (Appleby, 2001).                           tal foraminiferal counts. Benthic foraminiferal accumulation
                                                                     rates were calculated as follows:
3.3    Foraminifera analyses
                                                                     BFAR (number of specimens cm−2 yr−1 ) = BF × SAR,
Approximately 10 g of freeze-dried sediment per sample was
wet-sieved thought a 63 µm mesh screen and dried on fil-             where BF is the number of benthic foraminifera per cm3
ter paper at room temperature. Subsequently, the samples             and SAR is the sediment accumulation rate (cm yr−1 ).
were dry-sieved through 100 and 500 µm mesh screens and              Foraminiferal species that accounted for > 5 % of the total
separated into the fractions 100–500 µm and > 500 µm. The            fauna in at least one of the samples were considered major
foraminifera from every second centimeter of the core –              species, and their density was used in statistical analysis. The
plus from additional centimeters around key zones – were             Shannon index was calculated to describe the foraminiferal
picked and sorted under a Nikon microscope (22 samples               diversity. To determine foraminiferal zones, stratigraphically
in total). A minimum of 300 specimens per sample were                constrained cluster analysis was performed, using the size-
picked and identified, as recommended by Patterson and               independent Morisita index to account for the large differ-
Fishbein (1989). If necessary the samples were split with            ences in the densities between samples (e.g., Krebs, 1998).
an Otto splitter (Otto, 1933). For taxonomy at the genus             A dendrogram was then constructed based on arithmetic av-
level, we mainly followed Loeblich and Tappan (1964) with            erages with the UPGMA method (unweighted pair group
some updates from the more recent literature, e.g., Tappan           method with arithmetic mean). Correspondence analysis was
and Loeblich (1988). For taxonomy at the species level,              also performed to determine significant foraminiferal species
we mainly used Feyling-Hanssen (1964), Feyling-Hanssen               in each zone. Statistical analyses were performed using the
et al. (1971), and Murray and Alve (2011). For original de-          PAST software (Hammer et al., 2001).
scriptions of the species, see Ellis and Messina (1942 and
supplements up to 2013).
   Recently, the eastern Pacific morphospecies Nonionella
stella has been presented as an invasive species in the

Biogeosciences, 16, 3835–3852, 2019                                                       www.biogeosciences.net/16/3835/2019/
L. M. Charrieau et al.: Rapid environmental responses to climate-induced hydrographic changes 3839 Figure 3. Seasonal variability of salinity, temperature, pH, and dissolved inorganic nitrogen (DIN) concentration at the surface water (light grey), and seasonal variability of salinity, temperature, pH, and dissolved oxygen concentration at the bottom water (40–50 m) (dark grey) of the Öresund. The data were measured between 1965 and 2016 by the SMHI (Swedish Meteorological and Hydrological Institute) at station W LANDSKRONA. The number of measurements is indicated for each month. www.biogeosciences.net/16/3835/2019/ Biogeosciences, 16, 3835–3852, 2019
3840 L. M. Charrieau et al.: Rapid environmental responses to climate-induced hydrographic changes
3.4 Organic matter analyses lated south–north currents are represented as the VAV (ver-
tically averaged V component) and the simulated west–east
Total organic carbon (TOC) and total nitrogen (TN) con- currents as the UAV (vertically averaged U component).
tents were measured for both DV1-G and DV1-I. Approxi-
mately 8 mg of freeze-dried sediment was homogenized for
each centimeter and placed in silver capsules. Removal of 4 Results
inorganic carbon was carried out by the in situ acidification
(2M HCl) method based on Brodie et al. (2011). TOC and 4.1 Age model
TN contents were analyzed on a Costech ECS 4010 Elemen-
The unsupported 210 Pb showed a decreasing trend with depth
tal Analyzer at the Department of Geology, Lund University.
in the DV1-G core (Fig. 4a, b). The peak observed in the
The instrument was calibrated against in-house standards. 137 Cs around 9 cm corresponds to the Chernobyl accident in
The analytical precisions showed a reproducibility of 0.2 %
1986 (Fig. 4c). The unsupported 210 Pb allowed direct dat-
and 0.03 % for TOC and TN contents, respectively. The mo-
ing of the core between 2013 and 1913. The sedimentation
lar C/N ratio was calculated.
rate ranged between 1 and 5.6 mm yr−1 , with an average
of 2.2 mm yr−1 , and decreased with depth. The ages of the
3.5 Grain-size analyses
lower part of the sediment record were deduced by linear
extrapolation based on a sedimentation rate of 1.4 mm yr−1 ,
Grain-size analyses were performed on core DV1-G using
corresponding to the linear mean sedimentation rate between
3.5 to 5 g of freeze-dried sediment for each centimeter. Or-
the years 1913 and 1946 (Fig. 4d).
ganic matter was removed by adding 15 mL of 30 % H2 O2
and heating during 3 to 4 min until the reaction ceased. After 4.2 Foraminiferal assemblages and sediment features
the samples had cooled down, 10 mL of 10 % HCl was added
to remove carbonates; thereafter the sediment was washed The foraminiferal assemblages were composed of 76 species
with milli-Q until its pH was neutral. In the last step, bio- from the porcelaneous, hyalines, and agglutinated forms
genic silica was removed by boiling the sediment in 100 mL (0.3 %, 54.5 %, and 45.2 %, respectively) (Supplement Ta-
8 % NaOH and then washed until neutral pH was reached. ble S1). Eleven foraminiferal species had relative abundance
The sand fraction (> 63 µm) was separated by sieving and the higher than 5 % in at least one sample and were considered
mass fraction of sand of each sample was calculated. Grain major species (Plate 1, Fig. 5).
sizes < 63 µm were analyzed by laser diffraction using a Sedi- The cluster analysis revealed three main foraminiferal
graph III Particle Size Analyzer at the Department of Geol- zones (FOR-A, FOR-B, and FOR-C) (Figs. 5, 6). The corre-
ogy, Lund University. The data were categorized into three spondence analysis resulted in three factors explaining 92 %
size groups, < 4 µm (clay), 4–63 µm (silt), and 63–2000 µm of the variance, and in assemblages consisting of seven sig-
(sand). nificant species, presented in order of contribution: Non-
ionella sp. T1, Nonionoides turgida, Ammonia batava, Stain-
3.6 Climate data and numerical modeling forthia fusiformis, Elphidium albiumbilicatum, E. clavatum,
and Elphidium magellanicum (Table 1). Based on both the
Data from the High Resolution Atmospheric Forcing Fields cluster and the correspondence analyses, five subzones could
(HiResAFF) dataset covering the time period 1850–2008 be separated to which we assigned dates according to the age
(Schenk and Zorita, 2012; Schenk, 2015) were used to study model: FOR-A1 (1807–1870), FOR-A2 (1870–1953), FOR-
the variations of near-surface (10 m) wind conditions during B1 (1953–1998), FOR-B2 (1998–2009), and FOR-C (2009–
the winter half of the year (October to March). The daily 2013) (Figs. 5, 6).
dataset can be downloaded from WDC Climate (Schenk,
2017). Wind conditions over the Öresund are represented by 4.2.1 Zone FOR-A1 (1807–1870)
the closest grid point of HiResAFF at 55◦ N and 12.5◦ E.
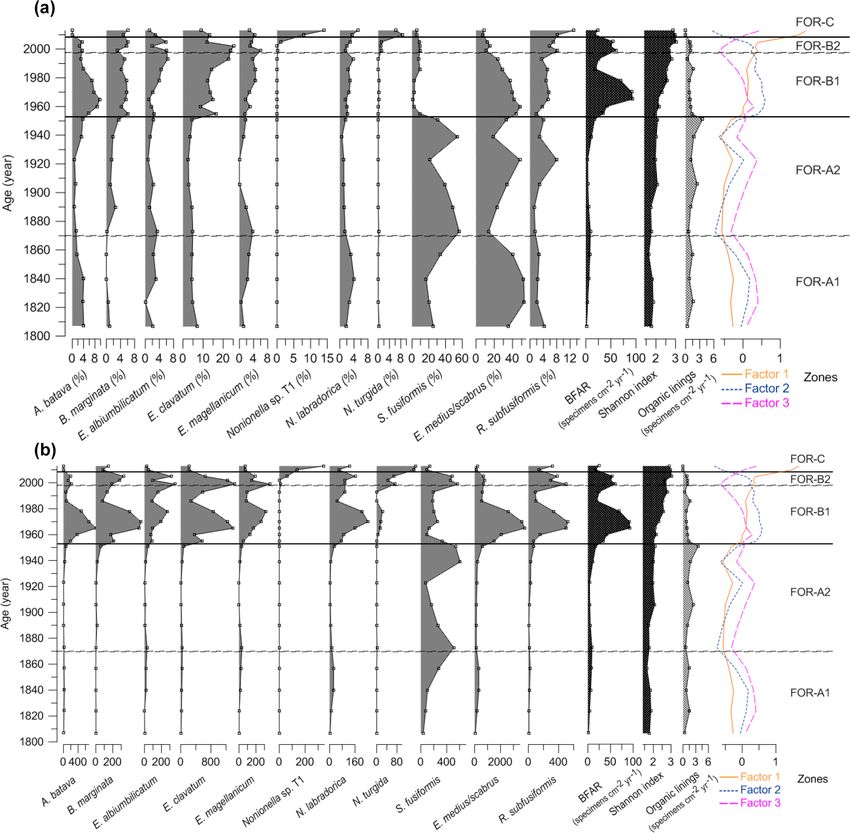
The North Atlantic Oscillation (NAO) index as defined by The foraminiferal accumulation rate (BFAR) was on average
Jones et al. (1997) for boreal winter (December to March) 5 ± 3 specimens cm−2 yr−1 in zone FOR-A1 (Fig. 5). The
was used, with updates taken from the Climate Research Shannon index was stable and low, around 1.77±0.1 (Fig. 5).
Unit (CRU, https://crudata.uea.ac.uk/cru/data/nao/, last ac- The agglutinated species Eggerelloides medius/scabrus and
cess: January 2019). To allow comparison, the NAO and the hyaline species Stainforthia fusiformis made major con-
wind data were normalized relative to the period 1850–2008. tributions to the assemblages (relative abundances up to 53 %
Changes in the currents through the Öresund and the Katte- and 34 %, respectively; Fig. 5a). Ammonia batava, the three
gat were taken from the ECOSMO II fully coupled physical Elphidium species (E. albiumbilicatum, E. clavatum, and
biogeochemical model (Daewel and Schrum, 2013, 2017), E. magellanicum), Nonionellina labradorica, and the ag-
which was forced by NCEP/NCAR reanalysis data and cov- glutinated species Reophax subfusiformis were also major
ers the period 1950–2013. In model ECOSMO II, the simu- species, with abundances up to 7 %. The TOC and C/N val-
Biogeosciences, 16, 3835–3852, 2019 www.biogeosciences.net/16/3835/2019/L. M. Charrieau et al.: Rapid environmental responses to climate-induced hydrographic changes 3841
Figure 4. Age–depth calibration for the sediment sequence from the Öresund (DV-1). (a) Total and supported 210 Pb activity. (b) Unsupported
210 Pb activity and the associated age model. (c) 137 Cs activity. The peak corresponds to the Chernobyl reactor accident in 1986. (d) Age–
depth model for the whole sediment sequence based on 210 Pb dates and calculated sediment accumulation rates (SARs).
ues in this period were stable and were on average 3.36 %
and 8.8 %, respectively (Fig. 7). The clay size fraction domi-
Table 1. Significant foraminiferal species and scores according to
nated the sediment at the end of this period with a mean value
the correspondence analysis.
of 63 %, and the sand content was around 7 % (Fig. 7).
Factor Total Significant species Score
variance 4.2.2 Zone FOR-A2 (1870–1953)
(%)
1 48.18 Nonionella sp. T1 5.10
The BFAR was on average 9 ± 5 specimens cm−2 yr−1 in
Nonionoides turgida 4.14 zone FOR-A2 (Fig. 5). The Shannon index was stable and
low, around 1.94±0.15 (Fig. 5). Stainforthia fusiformis dom-
2 30.88 Ammonia batava 1.34 inated the assemblage with relative abundances up to 56 %
Stainforthia fusiformis −1.41 and a BFAR up to 608 specimens cm−2 yr−1 (Fig. 5a, b),
3 13.36 Elphidium albiumbilicatum −1.65 which is the highest BFAR observed for this species along
Elphidium clavatum −1.57 the core. Egerelloides medius/scabrus was still very abun-
Elphidium magellanicum −1.32 dant, up to 48 % (Fig. 5a). Ammonia batava, the three Elphid-
ium species, and N. labradorica were present, but with lower
abundances than in zone FOR-A1 (maximum 5 %). Bulimina
www.biogeosciences.net/16/3835/2019/ Biogeosciences, 16, 3835–3852, 20193842 L. M. Charrieau et al.: Rapid environmental responses to climate-induced hydrographic changes Figure 5. (a) Relative abundances (%) of the foraminiferal major species (> 5 %), benthic foraminiferal accumulation rate (BFAR, spec- imens cm−2 yr−1 ), Shannon index, organic linings (specimens cm−2 yr−1 ), and factors from the correspondence analysis. (b) Benthic foraminiferal accumulation rates (specimens cm−2 yr−1 ) of the major species (> 5 %), BFAR (specimens cm−2 yr−1 ), Shannon index, or- ganic linings (specimens cm−2 yr−1 ), and factors from the correspondence analysis. Foraminiferal zones based on cluster and correspon- dence analysis. Note the different scale on the x axes. marginata started to be more abundant, with an average rel- 4.2.3 Zone FOR-B1 (1953–1998) ative abundance of 2 % in the zone. Reophax subfusiformis was still a part of the assemblage and ranged between 1 % The BFAR increased massively during zone FOR-B1, with and 8 %. The TOC and C/N values were stable and were on average 54 ± 31 specimens cm−2 yr−1 and with a peak at on average 3.5 % and 8.74 %, respectively (Fig. 7). The clay 93 specimens cm−2 yr−1 around 1965 (Fig. 5). It is lower size fraction dominated the sediment during this period with during the second part of the zone. The Shannon index a mean value of 63 %, and the sand content was around 6 % was higher than in previous zones, and it progressively in- (Fig. 7). creased towards the top of the zone (Shannon index aver- Biogeosciences, 16, 3835–3852, 2019 www.biogeosciences.net/16/3835/2019/
L. M. Charrieau et al.: Rapid environmental responses to climate-induced hydrographic changes                                    3843

                                                                 Figure 7. Sediment parameters of cores DV-1I and DV-1G (210 Pb
                                                                 dated): total organic carbon content (Corg ) (%), C/N ratio, and grain
                                                                 size (%). Foraminiferal zones indicated.

                                                                 4.2.4   Zone FOR-B2 (1998–2009)

                                                                 In zone FOR-B2 the BFAR was still high, on average 55 ± 6
                                                                 specimens cm−2 yr−1 (Fig. 5). The Shannon index was high,
                                                                 with an average of 2.8 ± 0.2 (Fig. 5). The dominant species
Figure 6. Dendrogram produced by the cluster analysis based on   in the zone were E. clavatum (up to 25 %) and Eggerelloides
the Morisita index and the UPGMA clustering method.              medius/scabrus (up to 15 %; Fig. 5a). The other two Elphid-
                                                                 ium species reached their highest relative abundances over
                                                                 the core (up to 6 %). Nonionella sp. T1, which had not oc-
age 2.34 ± 0.3) (Fig. 5). The highest BFARs along the core       curred in the record until now, appeared in this zone with
were observed for all the dominant species of the previous       a relative abundance of 1 %. Nonionoides turgida, which
zone, FOR-A2, except for S. fusiformis (Fig. 5b). The zone       was present in very low abundances along the core, had
was then also characterized by a drastic drop in the relative    a mean abundance of 1 % in the zone (Fig. 6a). Stainfor-
abundance of S. fusiformis from 31 % to 2 % (Fig. 5a). Eg-       thia fusiformis was present with up to 9 % in relative abun-
gerrelloides medius/scabrus gradually decreased in the zone,     dance and a BFAR higher than in zone FOR-B1 (up to 570
with relative abundances from 49 % to 24 %. The highest rel-     specimens cm−2 yr−1 ). Ammonia batava, B. marginata, N.
ative abundance of A. batava for the entire record was in        labradorica, and R. subfusiformis were present and ranged
this zone, but it was slowly decreasing as well, from 10 % to    between 2 % and 8 %. The TOC values were increasing, with
3 %. The Elphidium species were more abundant than in the        on average 3.05 % (Fig. 7). The sediment was dominated by
FOR-A zones and their relative abundance was increasing,         the clay fraction that was increasing (mean value of 58 %),
especially for E. clavatum (increasing up to 23 %). Bulimina     and the sand content was around 17 % (Fig. 7).
marginata, N. labradorica, and R. subfusiformis had a rela-
tive abundance between 2 % and 6 %. A period of lower TOC        4.2.5   Zone FOR-C (2009–2013)
values was observed during zone FOR-B1 between 1953 and
1981, with an average of 2.38 % (Fig. 7). In the same period,    The BFAR was lower than in the previous zones FOR-B1
the sand content showed a pronounced increase, with an av-       and FOR-B2, with on average 21 ± 5 specimens cm−2 yr−1
erage of 24 % (Fig. 7).                                          (Fig. 5). The Shannon index was highest during FOR-C
                                                                 (Shannon index average 2.93 ± 0.07) (Fig. 5). Nonionella sp.
                                                                 T1 was a dominant species in the zone, with a strong increase

www.biogeosciences.net/16/3835/2019/                                                      Biogeosciences, 16, 3835–3852, 2019
3844 L. M. Charrieau et al.: Rapid environmental responses to climate-induced hydrographic changes
in relative abundance (from 1 % to 14 %) and in BFAR (from thia fusiformis is an opportunistic species used to hypoxic
61 to 137 specimens cm−2 yr−1 ) (Fig. 5a, b). Elphidium and potentially anoxic conditions (Alve, 1994), and E.
clavatum and R. subfusiformis were also dominant species, medius/scabrus specimens have been found alive down to
with abundances up to 13 %. Nonionoides turgida had its 10 cm in the sediment, where no oxygen was available (Ces-
highest relative abundance and BFAR over the core during bron et al., 2016). Stainforthia fusiformis and N. labradorica
the zone, with up to 9 % and 342 specimens cm−2 yr−1 , re- are also able to denitrify (Piña-Ochoa et al., 2010). The fact
spectively (Fig. 5a, b). Eggerelloides medius/scabrus had its that species tolerant to low-oxygen conditions dominated,
lowest relative abundance over the core (up to 9 %). Bulimina and the presence of species that have the capacity to denitrify,
marginata, the other two Elphidium species, N. labradorica suggest that low-oxygen conditions were prevailing during
and S. fusiformis, were still present (between 1 % and 6 %), this period. Furthermore, S. fusiformis prefers organic-rich
while Ammonia batava was absent during the zone. The TOC substrate and clayey sediment, which was measured in our
and C/N values were on average 3.71 % and 8.17 %, respec- core during this time period (Fig. 7). The low species diver-
tively (Fig. 7). The clay size fraction dominated the sediment sity, as indicated by the low Shannon index in this section
with a mean value of 66 %, and the sand fraction was 7 % of the core, can sometimes be linked with low salinity (Sen
(Fig. 7). Gupta, 1999a). Most of the major species found during this
period, such as the Elphidium species R. subfusiformis and
4.2.6 Inner organic linings A. batava, tolerate lower salinities and are typical of brackish
environments (Table 2). The low occurrence of B. marginata,
Decalcified specimens were few and ranged between 0 a typical marine species, also suggests a salinity lower than
and 4 specimens cm−2 yr− 1 with an average of 1 speci- in the open ocean. However, the salinity was probably not be-
men cm−2 yr−1 (Fig. 5). They were observed throughout the low ∼ 30, which is the lower limit for N. labradorica and S.
core and especially during zone FOR-B2, and the morphol- fusiformis, which were present throughout the period (Fig. 5,
ogy of the remaining inner organic linings allowed the iden- Table 2). In summary, this period appears to have been char-
tification of the taxon Ammonia (Plate 1). acterized by low [O2 ], high organic matter content, and salin-
ity around 30.
4.3 Simulated data from the ECOSMO II model
5.2 1870–1953
The VAV (vertically averaged south–north current velocity)
through the Öresund from the ECOSMO II model showed a
Stainforthia fusiformis largely dominated the assemblage
reversed pattern compared to the UAV (vertically averaged
during this period, which may suggest even lower oxygen
west–east current velocity) through the Kattegat (Fig. 8).
conditions than during the previous period. This would also
Thus, higher VAV through the Öresund translates to an in-
go along with the low species diversity, which is sometimes
crease in the east-to-west flow in the Kattegat (lower UAV),
linked to low salinity. In the Öresund, low salinity can be
suggesting a stronger outflow from the Baltic Sea. The VAV
caused by less influence of more saline marine waters from
through the Öresund had the lowest values around 1955
the Kattegat, and changes in the water transport through the
(Fig. 8), followed by a shift to very high values, which dom-
strait are a possible explanation for both lower salinity and
inated throughout 1960–1970. A comparable period with in-
oxygen levels. However, the occurrence of the marine species
creased outflow from the Baltic into the Kattegat re-occurred
B. marginata suggests that the salinity was at least ∼ 30 (Ta-
during the period 1993–2000.
ble 2). Low oxygen can also be associated with high organic
matter contents, since oxygen is consumed during reminer-
5 Discussion alization of organic matter. However, the TOC levels ob-
served in our core in this zone were high, but not higher
Our environmental interpretations of the foraminiferal as- than in the previous zone (Fig. 7). At the time of the indus-
semblages were based on the ecological characteristics of trial revolution, the Öresund, like the Baltic Sea in general,
each major species (Table 2). Based on our environmental was used as a sewage recipient for a mixture of domestic
reconstructions, we could infer environmental changes re- and industrial wastes, industrial cooling water, and drainage
garding [O2 ], salinity, organic matter content, and pollution water (Henriksson, 1968), and the amount of marine traffic
levels. Furthermore, we linked local environmental changes increased considerably during this time period. Across the
to larger atmospheric and hydrographic conditions. Baltic Sea, this notably caused increased deposition of heavy
metals (Borg and Jonsson, 1996). This diverse type of pol-
5.1 1807–1870 lution could have modified the water properties, for example
regarding the carbonate chemistry and pH. Indeed, this zone
All the major species found in this period are tolerant to is characterized by the presence of organic linings in the core
low-oxygen conditions, especially the two main species: (see also Sect. 5.6). Moreover, heavy metals, fuel ash (black
S. fusiformis and E. medius/scabrus (Table 2). Stainfor- carbon), and pesticides have been demonstrated to generally
Biogeosciences, 16, 3835–3852, 2019 www.biogeosciences.net/16/3835/2019/L. M. Charrieau et al.: Rapid environmental responses to climate-induced hydrographic changes 3845 Plate 1. SEM pictures of the major foraminiferal species (> 5 %). (1) Stainforthia fusiformis; (2) Nonionellina labradorica; (3) Nonionella sp. T1; (4) Nonionoides turgida; (5) Eggerelloides medius/scabrus; (6) Bulimina marginata; (7) Ammonia batava; (8) Reophax subfusiformis; (9) Elphidium magellanicum; (10) Elphidium clavatum; (11)–(12) Ammonia sp. www.biogeosciences.net/16/3835/2019/ Biogeosciences, 16, 3835–3852, 2019
3846 L. M. Charrieau et al.: Rapid environmental responses to climate-induced hydrographic changes
Figure 8. South–north flow (VAV) in the Öresund (dark line) and west–east flow (UAV) in the Kattegat (light line) between 1950 and 2013.
Foraminiferal zones indicated.
have a negative effect on foraminiferal abundance and di- were intensified during this period until the 1980s, which
versity (Yanko et al., 1999; Geslin et al., 2002). Pollution resulted in increased nutrient loads and resulting eutrophi-
and low oxygen concentration could explain the low species cation (i.e., Rydberg et al., 2006). The increase in organic
BFAR and diversity as well as the dissolution of tests during matter may have been beneficial for foraminifera as a food
this period. Some species that were present, i.e., the agglu- source. Food webs and species interaction like intra- and
tinated species E. medius/scabrus and R. subfusiformis, are inter-competition might also have been modified, giving the
known to be tolerant to various kinds of pollution (Table 2). advantage to some species such as the Elphidium species to
develop in these new environmental conditions.
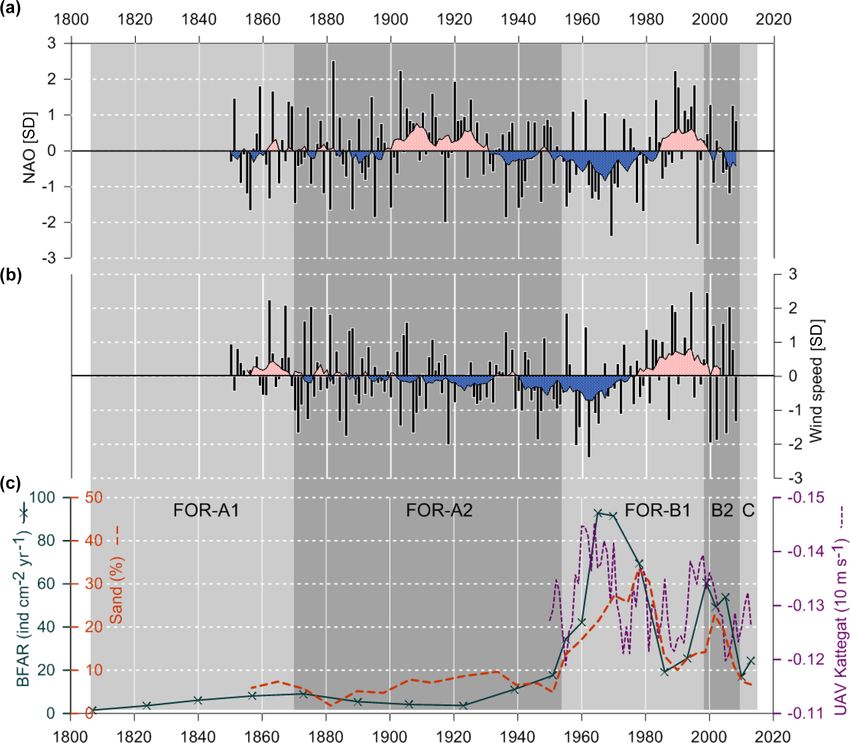
5.3 1953–1998 The temporal coincidence with the shifts seen in the sed-
iment record and the anomalous wind conditions suggest a
The large increase in general BFAR from 1953 suggests ei- notable change in the currents through the Öresund (Figs. 8,
ther more favorable growth conditions or significant deposi- 9). The simulated currents through the Öresund confirm such
tion of transported specimens into the area. The coarser grain an abrupt change characterized by a shift from very lim-
size observed during this period indicates possible changes in ited outflow from the Baltic to the Kattegat before ∼ 1960
the current system, which could affect both growing condi- to more than a decade of high relative outflow (high VAV)
tions and transport of specimens (Fig. 7). However, the dating from the Öresund to the Kattegat and high current velocities
of our core showed continuous sediment accumulation with- (Fig. 8). While the simulation only covers the period after
out any interruption during this period (Fig. 4). Moreover, all 1950, the analysis of wind conditions and the NAO index
the new dominating species were already present in the core, suggest that the anomalies in the current and sediment pat-
even if in lower relative abundances (Fig. 5a). This indicates tern from ∼ mid 1950s might have been unprecedented since
that the BFAR increase is most likely not due to specimen at least the middle of the 19th century (Fig. 9). The shift in
transport, but rather is a result of a change in substrate and en- local sediment properties and the shift to higher BFAR and
vironmental conditions that became favorable for a different species diversity suggest a combination of anomalous cur-
foraminiferal assemblage. The higher foraminiferal diversity rents during a period of unusually negative NAO index and
compared to previous periods and the decrease in the relative the abrupt first advection of anthropogenic eutrophication
abundance of S. fusiformis may indicate more oxic condi- from the Baltic Sea towards the Kattegat. Consistent with
tions. Elphidium clavatum has been found in coarse sediment our findings, long-term variations in large volume changes
in the area (Bergsten et al., 1996), and other species that toler- in the Baltic Sea (LVC, Lehmann and Post, 2015; Lehmann
ate sandy environments and varying TOC dominated the as- et al., 2017), which are calculated from > 29 cm (∼ 100 km3 )
semblage, such as A. batava, the other species in the Elphid- daily sea-level changes at Landsort (58.74◦ N; 17.87◦ E) for
ium species, B. marginata, and E. medius/scabrus. Further- 1887–2015, show an unusual cluster of both more frequent
more, anthropogenic activities such as agricultural practices
Biogeosciences, 16, 3835–3852, 2019 www.biogeosciences.net/16/3835/2019/L. M. Charrieau et al.: Rapid environmental responses to climate-induced hydrographic changes 3847
Table 2. Ecological significance of the benthic foraminiferal assemblages (major species).
Species Ecological significance Reference
Ammonia batava Salinity 15–35, T 0–29 ◦ C, high tolerance to Alve and Murray (1999), Murray (2006)
varying substrate and TOC
Bulimina marginata Tolerates low-oxygen conditions, salinity 30–35, Conradsen (1993), Murray (2006)
T 5–13 ◦ C, muddy sand, prefers organic-
rich substrates
Elphidium albiumbilicatum Salinity 16–26, typical brackish species Alve and Murray (1999)
Elphidium clavatum Tolerates low-oxygen conditions, salinity 10–35, Conradsen (1993), Alve and Murray (1999),
T 0–7 ◦ C, high tolerance to varying substrate Murray (2006)
and TOC, subtidal
Elphidium magellanicum Coastal species Sen Gupta (1999a)
Nonionella stella/aff. stella Tolerates low-oxygen conditions, kleptoplastidy, Piña-Ochoa et al. (2010),
able to denitrify, invasive in the Bernhard et al. (2012),
Skagerrak–Kattegat Charrieau et al. (2018)
Nonionellina labradorica salinity > 30, T 4–14 ◦ C, high latitudes, Cedhagen (1991)
kleptoplastidy, able to denitrify
Nonionoides turgida Opportunistic species, tolerates low-oxygen Van der Zwaan and Jorissen (1991)
conditions, prefers high food availability
Stainforthia fusiformis Opportunistic species, tolerates very low Alve (1994), Filipsson and Nordberg (2004),
oxygen conditions, salinity > 30, able to Piña-Ochoa et al. (2010)
denitrify, prefers organic-rich
substrates, fast reproduction cycle
Eggerelloides medius/scabrus High tolerance to hypoxia, salinity 20–35, Alve and Murray (1999), Alve (1990),
T 8–14 ◦ C, sandy–muddy sand, tolerance Murray (2006), Cesbron et al. (2016)
to various kind of pollution
Reophax subfusiformis Tolerance to environmental variations Sen Gupta (1999a)
and fuel ash
and also larger LVCs during the 1970s to 1980s relative to that once the foraminiferal fauna was established in the Öre-
the entire time period. Notably, this period coincides with sund area after the ∼ 1953 shift, it created a new state of
the most dramatic shift in foraminiferal BFAR and species equilibrium.
diversity as well as an increase in sand content. The period
before the “regime shift” of the 1950s to 1960s is dominated 5.4 1998–2009
by very infrequent and few large LVC events. After the shift,
the 1990s show also very few or partly no LVC events with The foraminiferal assemblage in this zone was similar to
generally record-low Major Baltic Inflow events. the previous one, with high BFAR, high diversity, and the
Thus, during this period, the ecosystems were affected by Elphidium species as dominating species. This period is,
both climatic effects through sedimentation changes and hu- however, characterized by the appearance of two new major
man impact. At the end of the period, after ∼ 1980, the gen- species: N. turgida and Nonionella sp. T1. Nonionella sp. T1
eral BFAR was lower during a short time (Figs. 5, 9). This is suggested to be an invasive species in the region which ar-
could be linked to the measures that were taken in agri- rived by ship ballast tanks around 1985 and rapidly expanded
culture and water treatments in order to reduce the nutri- to the Kattegat and Öresund (Asteman and Schönfeld, 2016).
ent discharge (Carstensen et al., 2006; Conley et al., 2007), According to our dated core, the species arrived in the Öre-
which could have reduced the food input. Interestingly, when sund ∼ 2000 CE (Fig. 5). The species has also been present
the sedimentation pattern changes again and the sand con- on the southern coast of Norway since ∼ 2009 (Deldicq et
tent decreases markedly (Fig. 7), the new species in the al., 2019), but additional genetic analyses are necessary to
foraminiferal fauna do not return to previous relative abun- have a better overview of the species’ origin and expansion.
dances as one could have expected (Fig. 5a). This suggests Nonionoides turgida is an opportunistic species that prefers
www.biogeosciences.net/16/3835/2019/ Biogeosciences, 16, 3835–3852, 20193848 L. M. Charrieau et al.: Rapid environmental responses to climate-induced hydrographic changes
Figure 9. (a) NAO index for boreal winter (December to March), data from Jones et al. (1997). (b) Variations of near-surface (10 m) wind
conditions (October to March), data from Schenk and Zorita (2012). Both NAO index and wind speed data are normalized on the period
1850–2008 and show running decadal means. (c) BFAR, percentage of sand fraction and west–east flow (UAV) in the Kattegat. Foraminiferal
zones indicated.
high levels of organic matter in the sediment, as observed in 5.6 Dissolution
our core during this period (Fig. 7). The increase in the S.
fusiformis BFAR suggests lower [O2 ] than in the previous
zone, which was indeed a general trend in the Danish waters The inner organic linings of the taxon Ammonia were ob-
during this time period (Conley et al., 2007). The salinity served (in low numbers, < 5 units) along the whole core,
was probably marine during this period, as suggested by the except in the top 2 cm (Fig. 5). Inner organic linings of
high occurrence of the marine species B. marginata (Fig. 5). the taxa Ammonia and/or Elphidium were noticed in previ-
This period was then characterized by low [O2 ], high organic ous studies among dead fauna in the region (Jarke, 1961;
matter content, and open ocean salinity. Hermelin, 1987: Baltic Sea; Christiansen et al., 1996; Mur-
ray and Alve, 1999: Kattegat and Skagerrak; Filipsson and
5.5 2009–2013 Nordberg, 2004b: Koljö Fjord). Dissolution of calcareous
foraminiferal tests has been considered a taphonomic pro-
The ability of Nonionella sp. T1 to denitrify and its toler- cess, affecting the test of the specimens after their death
ance of varying environments may explain its rapid increase (Martin, 1999; Berkeley et al., 2007). However, living de-
during this period. The increase in N. turgida also suggests calcified foraminifera have been observed in their natural en-
higher levels of organic matter in the sediment. The domi- vironment in the southern Baltic Sea (Charrieau et al., 2018)
nance of these two species and the lower BFAR compared and Arcachon Bay, France (Cesbron et al., 2016), proving
to previous periods suggest low oxygen levels. This period is that test dissolution can also occur while the specimens live.
thus characterized by low [O2 ], high organic matter content, In any case, low pH and low calcium carbonate saturation
and open ocean salinity. are suggested as involved in the observed dissolution (Jarke,
Biogeosciences, 16, 3835–3852, 2019 www.biogeosciences.net/16/3835/2019/L. M. Charrieau et al.: Rapid environmental responses to climate-induced hydrographic changes 3849
1961; Christiansen, et al., 1996; Murray and Alve, 1999; Supplement. Figure S1, with time series of salinity, temperature,
Cesbron et al., 2016; Charrieau et al., 2018). Test dissolution and dissolved oxygen concentration at the bottom water of the Öre-
may occur in all calcitic species, but only the organic linings sund, and Table S1, with total foraminiferal faunas normalized to
of Ammonia were found in our study, probably because these 50 cm3 along the DV core, are available in the online version of
were more robust to physical stress such as abrasion. the article. The supplement related to this article is available online
at: https://doi.org/10.5194/bg-16-3835-2019-supplement.
6 Conclusions
Author contributions. HLF conceived and planned the work. HLF,
In this study, we described an environmental record from LMC, and KL collected and analyzed the data. FS and UD carried
the Öresund, based on benthic foraminifera and geochem- out the simulations. LMC took the lead in writing the manuscript
ical data, and we link the results with reconstructed wind and creating the figures. All the authors provided critical feedback
data, NAO index, and currents from a hydrodynamic model. and helped shape the research, analysis, and manuscript.
Five foraminiferal zones were differentiated and associated
with environmental changes in terms of salinity, [O2 ], and
Competing interests. The authors declare that they have no conflict
organic matter content. The main event is a major shift in
of interest.
the foraminiferal assemblage ∼ 1950, when the BFAR mas-
sively increased and S. fusiformis stopped dominating the
assemblage. This period also corresponds to an increase in
Acknowledgements. We would like to thank the captain and the
grain size, resulting in a higher sand content. The grain-size crew of R/V Skagerak. We acknowledge Git Klintvik Ahlberg for
distribution suggests changes in the current velocities which the assistance in the laboratory, Yasmin Bokhari Friberg and Åsa
are confirmed by simulated current velocity through the Öre- Wallin for the help with the grain-size analysis, and Guillaume
sund. Human activities through increased eutrophication also Fontorbe for help with the age model.
influenced the foraminiferal fauna changes during this pe-
riod. Organic linings of Ammonia were observed throughout
the core, probably linked to low pH and calcium carbonate Financial support. The SHARK data collection is funded by the
saturation, affecting test preservation. Swedish Environmental Protection Agency. This research has been
The long-term reconstruction of sediment and ecosystem supported by the Swedish Research Council, FORMAS (grant nos.
parameters since ∼ 1807 suggests that the onset of increased 2012-2140 and 217-2010-126), the Royal Physiographic Society,
anthropogenic eutrophication of the eastern Kattegat started and the Oscar and Lili Lamm Foundation.
with an abrupt shift ∼ 1960 during a period of a strongly
negative NAO index. With unusually calm wind conditions
Review statement. This paper was edited by Markus Kienast and
during the winter half and increased easterly winds, the con-
reviewed by two anonymous referees.
ditions were ideal for larger Baltic outflow events, which is
a prerequisite for more frequent and stronger major Baltic
inflow events (Lehmann et al., 2017), as calculated from
LVC events during this period. Our high-resolution sedi- References
ment record points towards the importance of considering
also large Baltic outflow events for the Kattegat environ- Alve, E.: Opportunistic features of the foraminifer Stainforthia
ment. Since the Baltic Sea is much more eutrophic, less oxy- fusiformis (Williamson): evidence from Frierfjord, Norway, J.
genated, and less saline, large outflow events may have a Micropalaeontol., 13, 24–24, https://doi.org/10.1144/jm.13.1.24,
significant impact also on the Kattegat ecosystem. Periods 1994.
with a negative NAO or conditions with intense atmospheric Andersson, P., Håkansson, B., Håkansson, J., and Sahlsten, E.:
SMHI Report: Marine Acidification – On Effects and Monitoring
blocking over Scandinavia like in 2018 may also increase the
of Marine Acidification in the Seas Surrounding Sweden, Report
influence of the Baltic Sea’s environmental problems on the Oceanography No. 92, 2008.
Kattegat region. Appleby, P. G.: Chronostratigraphic techniques in recent sedi-
ments, in: Tracking Environmental Change Using Lake Sedi-
ments, edited by: Last, W. M. and Smol, J. P., Vol. 1, Springer
Data availability. The climate and numerical modeling data are ac- Netherlands, 2001.
cessible as described in the methods section. The foraminiferal data Asteman, I. P. and Schönfeld, J.: Recent invasion of the foraminifer
are available in Table S1. The hydrographic data used in the pro- Nonionella stella Cushman & Moyer, 1930 in northern Euro-
jected are collected from SMHI’s SHARK database. The SHARK pean waters: evidence from the Skagerrak and its fjords, J. Mi-
data collection is organized by the environmental monitoring pro- cropalaeontol., 35, 20–25, https://doi.org/10.1144/jmpaleo2015-
gram. 007, 2016.
Bergsten, H., Nordberg, K., and Malmgren, B.: Recent benthic
foraminifera as tracers of water masses along a transect in the
www.biogeosciences.net/16/3835/2019/ Biogeosciences, 16, 3835–3852, 20193850 L. M. Charrieau et al.: Rapid environmental responses to climate-induced hydrographic changes Skagerrak, North-Eastern North Sea, J. Sea Res., 35, 111–121, Conradsen, K., Bergsten, H., Knudsen, K. L., Nordberg, K., and https://doi.org/10.1016/S1385-1101(96)90740-6, 1996. Seidenkrantz, M.-S.: Recent benthic foraminiferal distribution in Bergström, S. and Carlsson, B.: River runoff to the Baltic Sea – the Kattegat and the Skagerrak, Scandinavia, Cushman Founda- 1950–1990, Ambio, 23, 280–287, 1994. tion Special Publication No. 32, 5368, 1994. Berkeley, A., Perry, C. T., Smithers, S. G., Horton, B. P., Cutshall, N. H., Larsen, I. L., and Olsen, C. R.: Direct analysis and Taylor, K. G.: A review of the ecological and tapho- of 210 Pb in sediment samples: Self-absorption corrections, Nuc. nomic controls on foraminiferal assemblage development Instrum. Methods, 206, 309–312, https://doi.org/10.1016/0167- in intertidal environments, Earth-Sci. Rev., 83, 205–230, 5087(83)91273-5, 1983. https://doi.org/10.1016/j.earscirev.2007.04.003, 2007. Daewel, U. and Schrum, C.: Simulating long-term dynamics of the Bernhard, J. M., Sen Gupta, B. K., and Borne, P. F.: coupled North Sea and Baltic Sea ecosystem with ECOSMO II: Benthic foraminiferal proxy to estimate dysoxic bottom- Model description and validation, J. Mar. Syst., 119–120, 30–49, water oxygen concentrations; Santa Barbara Basin, U.S. Pa- https://doi.org/10.1016/j.jmarsys.2013.03.008, 2013. cific continental margin, J. Foramin. Res., 27, 301–310, Daewel, U. and Schrum, C.: Low-frequency variability in North Sea https://doi.org/10.2113/gsjfr.27.4.301, 1997. and Baltic Sea identified through simulations with the 3-D cou- Bird, C., Schweizer, M., Roberts, A., Austin, W. E. N., Knud- pled physical–biogeochemical model ECOSMO, Earth Syst. Dy- sen, K. L., Evans, K. M., Filipsson, H. L., Sayer, M. D. J., nam., 8, 801–815, https://doi.org/10.5194/esd-8-801-2017, 2017. Geslin, E., and Darling, K. F.: The genetic diversity, morphol- Darling, K. F., Schweizer, M., Knudsen, K. L., Evans, K. M., Bird, ogy, biogeography, and taxonomic designations of Ammonia C., Roberts, A., Filipsson, H. L., Kim, J.-H., Gudmundsson, (Foraminifera) in the Northeast Atlantic, Mar. Micropaleontol., G., Wade, C. M., Sayer, M. D. J., and Austin, W. E. N.: The https://doi.org/10.1016/j.marmicro.2019.02.001, in press, 2019. genetic diversity, phylogeography and morphology of Elphidi- Borg, H. and Jonsson, P.: Large-scale metal distribution idae (Foraminifera) in the Northeast Atlantic, Mar. Micropaleon- in Baltic Sea sediments, Mar. Pollut. Bull., 32, 8–21, tol., 129, 1–23, https://doi.org/10.1016/j.marmicro.2016.09.001, https://doi.org/10.1016/0025-326X(95)00103-T, 1996. 2016. Brodie, C. R., Leng, M. J., Casford, J. S. L., Kendrick, C. Deldicq, N., Alve, E., Schweizer, M., Polovodova Asteman, I., P., Lloyd, J. M., Yongqiang, Z., and Bird, M. I.: Evidence Hess, S., Darling, K., and Bouchet, V.: History of the intro- for bias in C and N concentrations and δ 13 C composi- duction of a species resembling the benthic foraminifera Non- tion of terrestrial and aquatic organic materials due to pre- ionella stella in the Oslofjord (Norway): morphological, molec- analysis acid preparation methods, Chem. Geol., 282, 67–83, ular and paleo-ecological evidences, Aquat. Invas., 14, 182–205, https://doi.org/10.1016/j.chemgeo.2011.01.007, 2011. https://doi.org/10.3391/ai.2019.14.2.03, 2019. Carstensen, J., Conley, D. J., Andersen, J. H., and Ær- Ellis, B. F. and Messina, A. R.: Catalogue of Foraminifera, New tebjerg, G.: Coastal eutrophication and trend reversal: York, Micropaleontology Press, The American Museum of Nat- A Danish case study, Limno. Oceanogr., 51, 398–408, ural History, 1942. https://doi.org/10.4319/lo.2006.51.1_part_2.0398, 2006. Erbs-Hansen, D. R., Knudsen, K. L., Gary, A. C., Gyl- Cesbron, F., Geslin, E., Jorissen, F. J., Delgard, M. L., Charrieau, L., lencreutz, R., and Jansen, E.: Holocene climatic develop- Deflandre, B., Jézéquel, D., Anschutz, P., and Metzger, E.: Ver- ment in Skagerrak, Eastern North Atlantic: Foraminiferal tical distribution and respiration rates of benthic foraminifera: and stable isotopic evidence, The Holocene, 22, 301–312, Contribution to aerobic remineralization in intertidal mudflats https://doi.org/10.1177/0959683611423689, 2012. covered by Zostera noltei meadows, Estuar. Coast. Shelf Sci., Feyling-Hanssen, R. W.: Foraminifera in Late Quaternary Deposits 179, 23–38, https://doi.org/10.1016/j.ecss.2015.12.005, 2016. from the Oslofjord Area, Vol. 225 of Skrifter (Norges geologiske Charrieau, L. M., Filipsson, H. L., Ljung, K., Chierici, M., Knudsen, undersøkelse), Universitetsforlaget, 1964. K. L., and Kritzberg, E.: The effects of multiple stressors on the Feyling-Hanssen, R. W.: The Foraminifer Elphidium excavatum distribution of coastal benthic foraminifera: A case study from (Terquem) and its variant forms, Micropaleontology, 18, 337– the Skagerrak-Baltic Sea region, Mar. Micropaleontol., 139, 42– 354, https://doi.org/10.2307/1485012, 1972. 56, https://doi.org/10.1016/j.marmicro.2017.11.004, 2018. Feyling-Hanssen, R. W., Jørgensen, J. A., Knudsen, K. L., and An- Christiansen, C., Kunzendorf, H., Laima, M. J. C., Lund-Hansen, L. dersen, A.-L. L.: Late Quaternary Foraminifera from Vendsys- C., and Pedersen, A. M.: Recent changes in environmental con- sel, Denmark and Sandnes, Norway, Bull. Geol. Soc. Denmark, ditions in the southwestern Kattegat, Scandinavia, NGU Bull., Dansk geologisk forening, 21, 67317, 1971. 430, 137–144, 1996. Filipsson, H. L. and Nordberg, K.: Climate variations, an over- Conley, D. J., Cartensen, J., Ærtebjerg, G., Christensen, P. B., Dals- looked factor influencing the recent marine environment. An gaard, T., Hansen, J. L. S., and Josefson, A. B.: Long-term example from Gullmar Fjord, Sweden, illustrated by benthic changes and impacts of hypoxia in Danish coastal waters, Ecol. foraminifera and hydrographic data, Estuaries, 27, 867–881, Appl., 17, S16584, https://doi.org/10.1890/05-0766.1, 2007. https://doi.org/10.1007/BF02912048, 2004a. Conley, D. J., Carstensen, J., Aigars, J., Axe, P., Bonsdorff, E., Filipsson, H. L. and Nordberg, K.: A 200-year environmental Eremina, T., Haahti, B.-M., Humborg, C., Jonsson, P., Kotta, record of a low-oxygen fjord, Sweden, elucidated by benthic J., Lännegren, C., Larsson, U., Maximov, A., Medina, M. R., foraminifera, sediment characteristics and hydrographic data, J. Lysiak-Pastuszak, E., Remeikaitė-Nikienė, N., Walve, J., Wil- Foramin. Res., 34, 277–293, https://doi.org/10.2113/34.4.277, helms, S., and Zillén, L.: Hypoxia is increasing in the coastal 2004. 2004b. zone of the Baltic Sea, Environ. Sci. Technol., 45, 6777–6783, Geslin, E., Debenay, J.-P., Duleba, W., and Bonetti, C.: https://doi.org/10.1021/es201212r, 2011. Morphological abnormalities of foraminiferal tests in Biogeosciences, 16, 3835–3852, 2019 www.biogeosciences.net/16/3835/2019/
You can also read


