Re-evaluating safety risks of multifunctional dikes with a probabilistic risk framework - NHESS
←
→
Page content transcription
If your browser does not render page correctly, please read the page content below
Nat. Hazards Earth Syst. Sci., 19, 737–756, 2019
https://doi.org/10.5194/nhess-19-737-2019
© Author(s) 2019. This work is distributed under
the Creative Commons Attribution 4.0 License.

Re-evaluating safety risks of multifunctional dikes with
a probabilistic risk framework
Richard Marijnissen1 , Matthijs Kok2 , Carolien Kroeze1 , and Jantsje van Loon-Steensma1,2
1 WaterSystems and Global Change group, Wageningen University & Research, P.O. Box 47,
6700 AA Wageningen, the Netherlands
2 Hydraulic Engineering, Delft University of Technology, P.O. Box 5048, 2600 GA Delft, the Netherlands

Correspondence: Richard Marijnissen (richard.marijnissen@wur.nl)

Received: 15 October 2018 – Discussion started: 23 October 2018
Revised: 28 February 2019 – Accepted: 9 March 2019 – Published: 10 April 2019

Abstract. It is not uncommon for a flood defence to be com-        Hirabayashi et al., 2013). Risk-based approaches towards
bined with other societal uses as a multifunctional flood de-      flood protection have been applied all over the world to in-
fence, from housing in urban areas to nature conservation          form decision makers on effective flood risk measures in
in rural areas. The assessment of the safety of multifunc-         spite of the large uncertainties (Jonkman et al., 2009; Kher-
tional flood defences is often done using conservative esti-       admand et al., 2018; Hall et al., 2003). Nevertheless, a better
mates. This study synthesizes new probabilistic approaches         understanding of the fragility of flood protection measures,
to evaluate the safety of multifunctional flood defences em-       including innovative ones like natural flood defences (Tem-
ployed in the Netherlands and explores the results of these        merman et al., 2013), is instrumental to properly evaluate the
approaches. In this paper a case representing a typical Dutch      flood risk in the future.
river dike combining a flood safety function with a nature and        The Netherlands in particular is vulnerable to rising flood
housing function is assessed by its probability of failure for     risks as about 60 % of its area is prone to flooding from the
multiple reinforcement strategies considering multiple rele-       sea or rivers (Kok et al., 2016). After the large flood of 1953
vant failure mechanisms. Results show how the conservative         a design water level with an acceptably small exceedance
estimates of multifunctional flood defences lead to a system-      probability was set based on an economic optimization be-
atic underestimation of the reliability of these dikes. Further-   tween investment costs and obtained risk reduction (Maris
more, in a probabilistic assessment uncertainties introduced       et al., 1961). Many studies have argued for a comprehen-
by multifunctional elements affect the level of safety of the      sive probabilistic approach towards assessing the protection
dike proportional to the reliability of the dike itself. Hence,    level provided by flood defences (Apel et al., 2006; Vrijling,
dikes with higher protection levels are more suitable to be        2001; Hall et al., 2003). As of January 2017 the water-level
combined with potentially harmful uses for safety, whereas         exceedance-based national risk standards were replaced by
dikes with low protection levels can benefit most from uses        a more complex full probabilistic approach to more effec-
that contribute to safety.                                         tively adapt to social and economic developments and cli-
                                                                   mate change (Kok et al., 2016). The Dutch Water Act is the
                                                                   first to require the implementation of these principles on a na-
                                                                   tionwide scale. While these approaches were developed for
1     Introduction                                                 dikes that serve as flood protection only, in practice many
                                                                   dikes have features serving other functions than flood pro-
1.1    Evolution of the flood risk approach                        tection. It is still unclear how such multifunctional aspects
                                                                   of a flood defence must be included in probabilistic safety
With rising sea level and an expected rise in extreme rain-        assessments.
fall events due to climate change, many regions in the world
are faced with increasing flood risk (Bouwer et al., 2010;

Published by Copernicus Publications on behalf of the European Geosciences Union.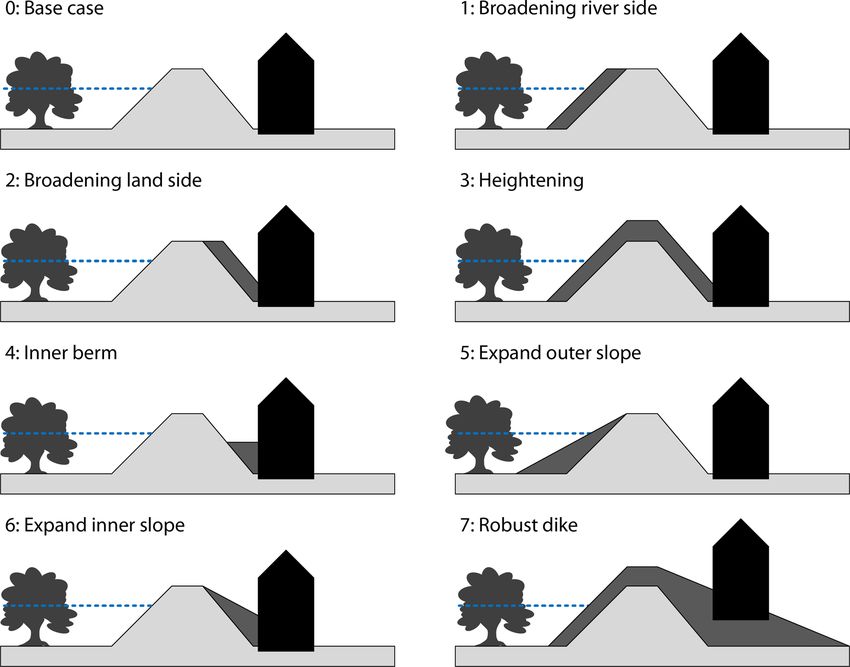
738                                                 R. Marijnissen et al.: Re-evaluating safety risks of multifunctional dikes

1.2   Multifunctional flood defences                               ple per year will experience floods due to sea-level rise. By
                                                                   reinforcing dikes this number can already be reduced by a
Multifunctional flood defences (MFFDs) are engineered              factor of 461 (Hinkel et al., 2013).While reinforcing dike sys-
structures designed for the purpose of flood protection while      tems, there is plenty of opportunity to enable multifunctional
simultaneously enabling other uses (Voorendt, 2017). Com-          use of the flood defence.
bining dikes with other functions is fairly common. Dikes             However, the means to determine the safety provided by
can have roads on top, cables and/or pipelines running             multifunctional flood defences remain limited to conserva-
through them, or structures on them or are part of a historic      tive approaches in which multifunctional elements can only
landscape. In the Netherlands alone, the majority of dike re-      be shown to have no significant negative influence. Spurred
inforcement projects already face the presence of more than        on by the threat of increasing flood risks by climate change
one function. Usually, enabling multiple functions requires        and the revised legislation on flood standards in the Nether-
strengthening of the dike beyond the minimal requirements          lands, a new probabilistic framework to assess multifunc-
for a traditional dike to account for uncertainties related to     tional flood defences is emerging that can be used for a wider
those functions (van Loon-Steensma and Vellinga, 2014).            context. The aim of this paper is to synthesize the new ap-
Multifunctional use of the flood defence does not need to          proaches to evaluate the safety of MFFDs employed in the
decrease safety. For example, the development of green fore-       Netherlands into a single coherent framework and evaluate
shores for flood protection services is an attractive option for   how this new probabilistic approach towards MFFDs can
future climate adaption (van Loon-Steensma et al., 2014) as        change the assessed safety compared to the commonly ap-
such flood defences can reduce the risk of flooding through        plied conservative approach towards MFFDs .
natural processes (van Loon-Steensma and Kok, 2016; van               To this end, first the existing official framework for as-
Loon-Steensma et al., 2016).                                       sessing multifunctional dikes in the Netherlands is analysed
   Flood defences can strengthen other values when func-           and alternative frameworks in both scientific and grey liter-
tions are properly integrated (Lenders et al., 1999; van Loon-     ature for a probabilistic risk-based approach towards assess-
Steensma et al., 2014). In urban areas where space is lim-         ing MFFDs as required by the new Water Act are explored.
ited, there is continuous pressure to build on or integrate        These are synthesized in an adapted framework (Sect. 2).
structures with the flood defence (Stalenberg, 2013). In ru-       Secondly the methods used to calculate the probability of
ral areas, nature-based solutions have gained interest because     failure of several dikes are explained using the synthesized
they combine beneficial properties of natural systems for          probabilistic approach and the traditional conservative ap-
flood protection (e.g. wave attenuation by vegetation on fore-     proach (Sect. 3) to show the differences in assessed safety
shores) with conservation or development of important nat-         level (Sect. 4). Finally the implications and results are dis-
ural values (Temmerman et al., 2013; Pontee et al., 2016).         cussed (Sects. 5 and 6). By illustrating how a probabilistic
In the Netherlands these developments favour the implemen-         approach towards multifunctional use can affect the assessed
tation of a multifunctional flood defence due to the limited       level of safety, new types of integrated solutions can be more
space and government policy to consider other uses (e.g. nat-      fairly compared to monofunctional dikes, both in the Nether-
ural, historical, and economical) (van Loon-Steensma and           lands and beyond.
Vellinga, 2014).
   Despite the large number of multifunctional dikes and in-
centives, the tools to assess the safety of MFFDs have still       2     Formulating a framework for MFFD assessment
been limited to rules of thumb and in-depth tailor-made stud-
ies. Unless the multifunctionality is a key feature, assess-       2.1    Official Dutch guidelines for MFFD dike
ments are often limited to proving multifunctional use does               assessments and design
not significantly diminish the safety of the flood defence, ig-
noring potential positive contributions to safety. Using such a    The methods to assess flood defences in compliance with
conservative approach for dike assessments does ensure safe        the official Dutch safety standard are documented in official
dikes from a flood risk perspective but may result in requiring    guidelines (Ministerie van Infrastructuur en Milieu, 2016;
larger and more expensive dikes.                                   Ministerie van Verkeer en Waterstaat, 2007). The assessment
                                                                   can be performed on different levels: basic, detailed, and tai-
1.3   Aim                                                          lored. Basic assessments are a quick scan with simple rules
                                                                   to approve flood defences with an insignificantly low failure
There is a need for improved flood defences due to climate         probability. Detailed assessments consist of design formulas
change (rising sea levels, higher river discharges) and socio-     and models taken or adapted from Dutch design manuals and
economic developments. The number of people exposed to a           are commonly applied for (initial) designs and assessments.
high risk of flooding is expected to increase from 271 million     These are suitable for predicting the failure of dikes when
in 2010 to 345 million in 2050 due to socio-economic growth        general descriptions of dike failures can be applied. Such
alone (Jongman and Aerts, 2012). By 2100, 168 million peo-         generalizations are not always suitable for MFFDs. Tailored

Nat. Hazards Earth Syst. Sci., 19, 737–756, 2019                             www.nat-hazards-earth-syst-sci.net/19/737/2019/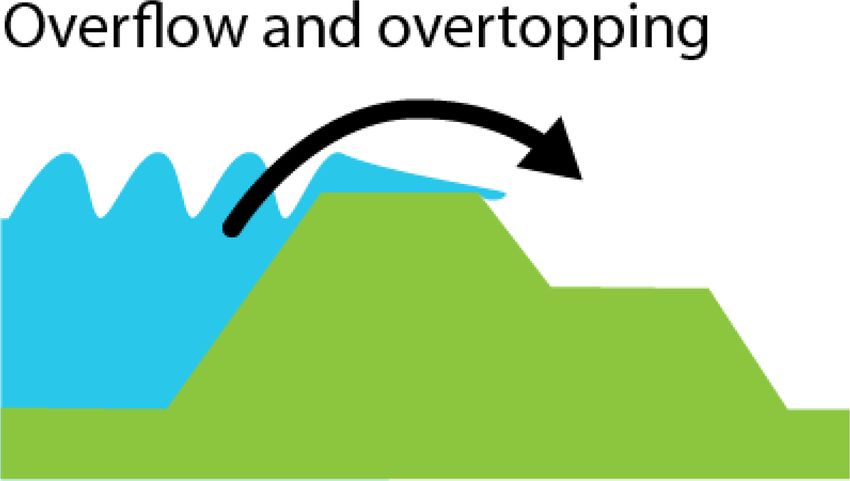
R. Marijnissen et al.: Re-evaluating safety risks of multifunctional dikes                                                     739

                                                                   2.2   Synthesizing a risk-based approach to MFFD
                                                                         design

                                                                   The scientific basis for the risk-based framework adopted in
                                                                   the Netherlands was presented by Vrijling (2001). The risk
                                                                   of a flood is decomposed into a fault tree of failure mech-
                                                                   anisms, each of which can be described with a mathemati-
                                                                   cal limit state function and evaluated probabilistically. Limit
                                                                   states are common for designing structures in civil engineer-
Figure 1. Assessment profile for a dike with NWOs (pipeline and    ing and define when a structure collapses resulting in dam-
house with basement). Adapted from Fig. A4 of the current Dutch
                                                                   ages and casualties (ultimate limit state) or can no longer per-
guidelines (Rijkswaterstaat, 2016).
                                                                   form its intended use (serviceability limit state) (Gulvanes-
                                                                   sian, 2009). Vrijling’s approach of structuring the ultimate
                                                                   limit states of flood defences into a fault tree for risk analy-
assessments allow for the use of advanced models and ex-           ses has been incorporated into many frameworks of flood de-
periments outside the guidelines to assess the probability of      fences (e.g. Apel et al., 2004; van Gelder et al., 2009; Steen-
failure as accurately as possible. These assessments require       bergen et al., 2004; Vorogushyn et al., 2010) and has already
a large amount of information for a specific location and are      been applied on a large scale to evaluate the Dutch flood de-
generally expensive to perform. The dike needs to pass at          fences (Jongejan and Maaskant, 2013). However, the frame-
least one of these assessments to be considered safe and a         work was developed for monofunctional flood defences.
proper design ensures the dike will pass the assessments for          Studies on MFFDs specifically are available. However,
its entire designed lifespan.                                      the developed frameworks address different aspects, like the
   In the official Dutch framework, multifunctional use of the     identification of the degree of spatial and structural integra-
dike is considered either directly as objects on the dike, by      tion (Ellen et al., 2011b; Voorendt, 2017; Van Veelen et al.,
the materials used, or indirectly by the geometry of the dike.     2015), the identification of costs and benefits (Anvarifar et
When only the geometry of the dike is affected or a different      al., 2013), the identification of the threats and opportunities
material is used (e.g. to integrate with the surrounding land-     (Anvarifar et al., 2017), and the identification and evaluation
scape) the official framework can still be applied (Slomp et       of flexibility for MFFDs (Anvarifar et al., 2016). Other stud-
al., 2016). However, if multifunctional use of the dike is fa-     ies on MFFDs tend to only focus on the effects of a specific
cilitated by a non-water retaining object (NWO), e.g. a house      multifunctional element or failure mechanism (Chen et al.,
or pipeline, an additional assessment must be made for the         2017; Bomers et al., 2018; Zanetti et al., 2011). Only recently
NWO. For a few multifunctional elements, a basic safety as-        was an assessment framework specifically for hybrid nature-
sessment is described in guidelines (structures, vegetation,       based flood defences put forward, accounting for multiple
and traffic) (van Houwelingen, 2012; STOWA, 2000, 2010;            failures by putting vegetation-specific equations directly into
TAW, 1994, 1985; Ministerie van Infrastructuur en Milieu,          the assessment procedure (Vuik et al., 2018).
2016). Only for pipelines is a more detailed assessment avail-        Pending an official framework, practitioners in the Nether-
able following the Eurocode (NEN, 2012), which ensures the         lands have used approaches to integrate multifunctional
pipeline itself has an acceptably small probability of failure.    dike elements. One such approach was put forward for
If a dike cannot be approved by a basic assessment and no          trees through the use of scenarios such as uprooting (van
suitable detailed assessment is available, a tailored assess-      Houwelingen, 2012). An approach for assessing NWOs as
ment for that specific dike section with NWOs must be made.        indirect failure mechanisms with scenarios is being sug-
   The philosophy of a basic assessment is to rule out the pos-    gested in these cases (Knoeff, 2017). This approach will be
sibility of the NWO affecting the dike significantly. Hence,       explored further in the study.
the dike is considered safe only if the dike is dimensioned           Formulating a practical framework for the assessments of
such that the zone of influence of the NWO does not extend         MFFDs is challenging due to the large variety of possible
into the minimum dike profile needed to meet the safety stan-      configurations and range of multifunctional elements. Mul-
dard (see Fig. 1). As a result, in basic assessments the NWO       tifunctional elements can be evaluated in different scenarios
is always assumed to be in its most critical state during de-      with simple or complex models in literature while preserv-
sign conditions (e.g. uprooting of a tree). This is the con-       ing the established structure of the existing Dutch frame-
servative approach to assess the influence of multifunctional      work. Scenarios in this context are different possible states
elements on safety because the actual probability of multi-        of a multifunctional element with a probability of occurrence
functional elements being in a critical state is not considered.   in which the element affects the flood defence. By assessing
The ambition of the Dutch Water Act is to consider the ac-         each scenario and weighing up the probability of failure in
tual probability of flooding which necessitates a risk-based       each scenario by the probability of the scenario, the proba-
approach to these elements.                                        bility of failure of the flood defence is calculated accounting

www.nat-hazards-earth-syst-sci.net/19/737/2019/                             Nat. Hazards Earth Syst. Sci., 19, 737–756, 2019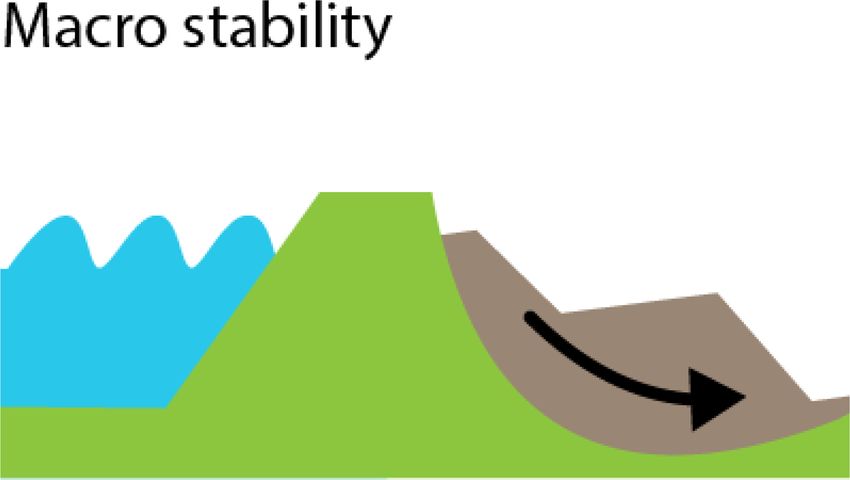
740 R. Marijnissen et al.: Re-evaluating safety risks of multifunctional dikes
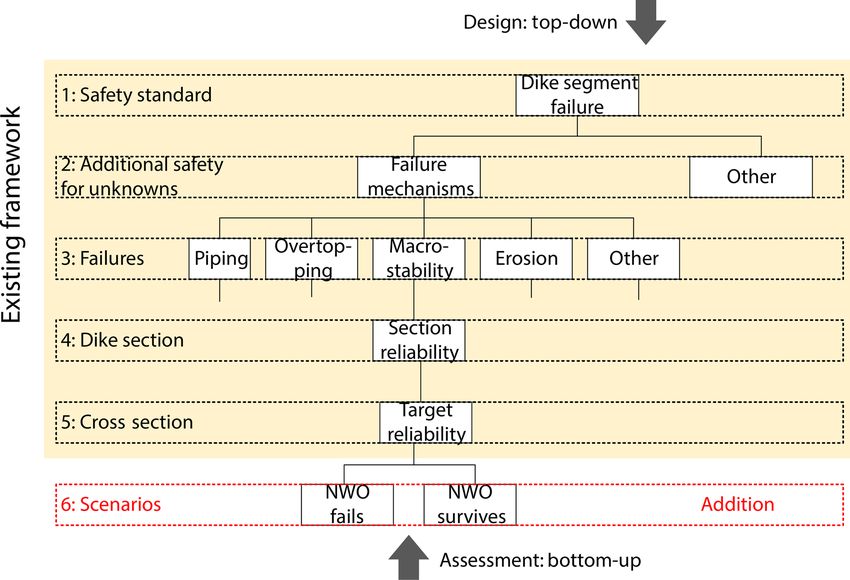
Figure 2. A framework for a detailed assessment and design of a dike with multifunctional elements. The yellow section is the existing
framework, while the last step in red denotes the addition of scenarios (e.g. a failed NWO and functioning NWO) to conform to a risk-based
approach.
for the uncertainty in the state of the multifunctional element. the influence of the intended NWO is outside the designed
Therefore the steps for MFFD assessments in the Nether- profile. In the risk-based probabilistic assessment the effects
lands are synthesized as follows (also see Fig. 2): of NWOs are calculated directly with the scenarios in Step 6
and combined with their probability of occurrence to arrive
– Step 1. Establish the required safety level of the dike at a safe cross section.
segment.
– Step 2. Assign a portion of the required safety level to
unknown/unquantifiable risks. 3 Application of the risk frameworks
– Step 3. Distribute the remaining failure budget across 3.1 Comparing the basic assessment with the expanded
the known failure mechanisms. probabilistic assessment
– Step 4. Divide the dike into (close to) homogeneous sec- To answer how a probabilistic approach towards multifunc-
tions. tional dikes can affect the evaluated safety compared to a
monofunctional dike, a set of MFFDs is assessed with the
– Step 5. Determine a representative cross section and
new probabilistic approach and the traditional conservative
safety level, taking variations along the dike section into
approach (see Table 1 for the approaches). The calculations
account (length effect).
are performed on a cross-sectional level. The reliability of a
– Step 6 (addition). Determine the scenarios, i.e. states, cross section is calculated for the most common dike failure
in which the NWO affects the flood defence differently, mechanisms by probabilistically evaluating the models de-
assess the probability of these scenarios, and combine scribing failure for the different scenarios. The failure prob-
them based on their probability of occurrence. abilities per scenario and failure mechanism are combined to
arrive at the probability of failure.
The difference between a basic assessment and a probabilis-
tic one is the addition of Step 6. In a basic assessment, 3.2 Failure mechanisms
i.e. a detailed assessment without NWOs followed by a ba-
sic NWO assessment to exclude significant potential negative To assess the risk of a flood, it is important to know the mech-
influences, first a dike cross section would be designed with anisms by which the flood defence could fail. Though many
the criteria found in Step 1 to 5 and then adapted such that failure mechanisms are possible (Kok et al., 2016), the vast
Nat. Hazards Earth Syst. Sci., 19, 737–756, 2019 www.nat-hazards-earth-syst-sci.net/19/737/2019/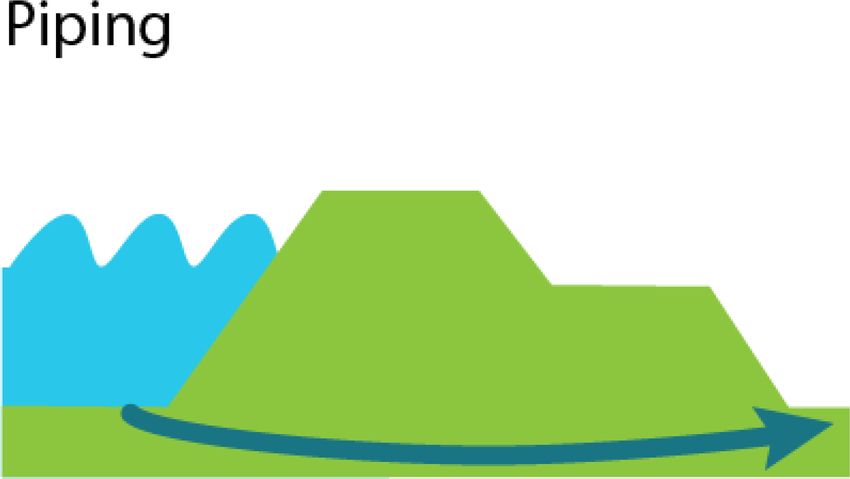
R. Marijnissen et al.: Re-evaluating safety risks of multifunctional dikes                                                               741

Table 1. The different approaches for assessing the cross section of a multifunctional dike in this study.

                    Approach             Assumptions                               Example
                    Monofunctional       No multifunctional
                                         elements present.

                    Multifunctional      Functions are always in the critical
                       Conservative      state for a given failure mechanism.
                                         Dike zones affected by the
                                         multifunctional elements are omitted
                                         from the profile.
                        Probabilistic    Uncertainty of multifunctional
                                         elements split into scenarios
                                         (e.g. present or absent).
                                         Each scenario has a probability.

Table 2. Overview of failure mechanisms and corresponding methods.

        Failure mechanism           Description                                     Limit state      Method
                                                                                    function
                                    Excessive flow of water over the dike           qc − q           Overtopping: van der Meer
                                    with severe inundation of the                                    et al. (2016); TAW (2002);
                                    hinterland as a result, possibly by                              de Waal (1999)
                                    erosion of the revetment and soil on
                                    the crest and inner slope leading to a
                                    dike breach
                                    Erosion of soil particles under the dike        Hc − H           Ground water: TAW (2004)
                                    as a result of seepage. This in turn                             Erosion: Sellmeijer et al. (2011)
                                    leads to collapse of the dike and
                                    failure by inundation of the hinterland.

                                    Loss of slope stability as the dike             6MR − 6MS        Ground water: TAW (2004)
                                    becomes saturated. The collapse of the                           Slope stability: Van (2001)
                                    dike results in inundation of the hinterland

majority of documented dike failures worldwide are the re-                  tion called a limit state function:
sult of three dominant mechanisms: overtopping (resulting
in erosion of the inner slope), internal erosion (also referred             Z = R − S,                                                   (1)
to as piping), and inner slope stability (Danka and Zhang,                  where Z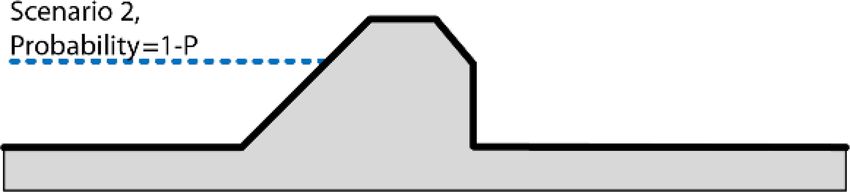
742                                                  R. Marijnissen et al.: Re-evaluating safety risks of multifunctional dikes

Macro stability is calculated within the program D-Geo Sta-         across all relevant water levels results in the fragility curve
bility (Brinkman and Nuttall, 2018) with the stability method       of the system to the water level (Bachmann et al., 2013). The
by Van (2001) and ground water model by TAW (2004). The             failure probability of the system is computed by integrating
method by Van (2001), like the Bishop (1955) method, cal-           the fragility curve of the system (FR (h)) over the probability
culates the sum of the driving moments (S) and the total re-        density function (PDF) of the water level (fh (h)):
sisting moment (R) along the slip plane. However, it also ac-
                                                                                h=∞
counts for uplift forces on the interface of aquifers present                   Z
beneath most dikes. The resulting limit states are                  Pf,sys =            fh (h) × FR (h) dh.                     (6)
                                                                              h=−∞
Zoverflow & overtopping = qc − q                             (2)
Zpiping = Hc − H                                             (3)    Equation 6 is discretized to
Zmacro stability = 6MR − 6MS .                               (4)               m
                                                                               X
                                                                    Pf,sys =          P hj × Psys (f |hj ).                     (7)
Here qc is the empirically determined critical overtopping                     j =1
discharge, q is the overtopping discharge calculated accord-
ing the methods of van der Meer et al. (2016) and TAW               Low failure probabilities can more easily be expressed in
(2002), Hc is the critical hydraulic head according to Sell-        terms of the reliability index which is defined as
meijer et al. (2011), H is the difference in water level in front
                                                                    β = −8−1 (Pf ),                                             (8)
and behind the dike, 6MS is the sum of the active moments
in the critical slip plane, and 6MR is the sum of resisting         where 8−1 is the inverse standard normal cumulative distri-
moment in the critical slip plane.                                  bution function.
                                                                       The probabilistic procedure described above has been uti-
3.3   Probabilistic procedure                                       lized before successfully by Lendering et al. (2018) and Bis-
                                                                    chiniotis et al. (2018) to compute the reliability of canal lev-
Multiple procedures are available for calculating the reli-
                                                                    ees and a cost-optimal river dike respectively. An overview
ability of a flood defence. A fully probabilistic procedure
                                                                    of the entire process as applied in this study is schematized
like Monte Carlo relies on evaluating the limit state func-
                                                                    in Fig. 3.
tion for many variations of the random variables and deter-
mines the failure probability as the number of failures over        3.4     Case study
the total number of samples. Meanwhile, a semi-probabilistic
approach evaluates the limit state function once and cap-           3.4.1    Setting and cross sections
tures uncertainties with (partial) safety factors to determine
(non)failure. A probabilistic procedure like the first-order re-    The multifunctional dike for the case study is situated in a
liability method (FORM) iteratively converges to an approxi-        riverine area, with nature on the floodplain side and a build-
mation of the probability of failure (Hasofer and Lind, 1974).      ing on the landward side. To test how a risk approach can
This option was chosen as it does not require millions of eval-     affect the calculated level of safety, eight cross sections of
uations of the limit state function to assess the small failure     multifunctional dike profiles (Fig. 4) are evaluated with three
probabilities required for dikes while still retaining the prob-    methods: a conservative, a probabilistic, and a monofunc-
abilistic distribution of the variables otherwise lost in a semi-   tional approach (see Sect. 3.1).
probabilistic approach.                                                If a dike does not meet the set safety standards, a rein-
   While the FORM procedure can approximate the failure             forcement by adapting the profile, among other options, is
probability of a single limit state function of a single failure    explored. Each profile in this study represents a common re-
mechanism, a combination of failure mechanisms is more              inforcement strategy. Broadening the dike by widening the
complex to evaluate. When the only dependence between               crest or expanding the slope reduces the risk of a piping fail-
failure mechanisms is assumed to be the water level, each           ure by increasing the piping length by a few metres. Fur-
failure mechanism becomes an independent event for each             thermore, broadening inwards and making the inner slope
discrete water level such that the probability of failure of the    shallower makes the inner slope more stable. A berm also
system is                                                           improves the stability of the inner slope. Finally heightening
                                                                    the dike decreases the risk of overtopping waves and over-
                               n
                               Y                                   flow during high water. The final reinforcement strategy is a
Pf,sys|h = Psys (f |h) = 1 −         1 − Pf,i|h ,            (5)
                               i=1
                                                                    combination of heightening and decreasing the steepness of
                                                                    the inner slope.
where Pf,i|h is the probability of failure given water level h         Each multifunctional element can compromise a section
for the ith failure mechanism, and Pf,sys|h is the probabil-        of the dike resulting in failure. For the purpose of this study
ity of failure given water level h. Repeating this calculation      the multifunctional elements have been simplified so these

Nat. Hazards Earth Syst. Sci., 19, 737–756, 2019                               www.nat-hazards-earth-syst-sci.net/19/737/2019/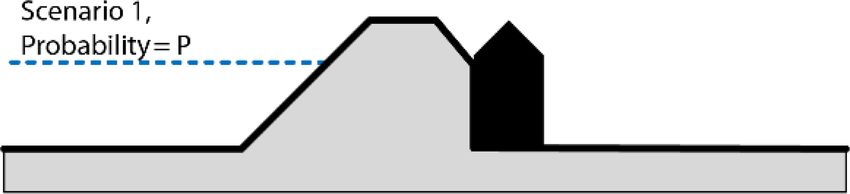
R. Marijnissen et al.: Re-evaluating safety risks of multifunctional dikes                                                             743

Figure 3. The probabilistic procedure for calculating the probability of failure of a dike cross section in this study.

                                                                           bility of failure of each scenario with the probability of the
                                                                           scenario.
                                                                              A natural floodplain can add ecological, landscape, and
                                                                           recreational values to the flood protection system. However,
                                                                           elements like trees can penetrate the clay top soil, resulting
                                                                           in cavities within the clay when the tree dies (Zanetti et al.,
                                                                           2011). Following a conservative estimation for the uprooting
                                                                           of trees by TAW (1994), a 2 % annual probability of a cavity
                                                                           within the floodplain is assumed. If a cavity is present, the
                                                                           effective length for piping is reduced to the distance between
                                                                           the dike’s inner toe and the location of the disturbance. The
                                                                           trees on the floodplain do not affect the inner slope stability,
                                                                           nor is the tree density in the case study high enough to expect
                                                                           an influence on overtopping by wave dampening properties
                                                                           of trees.
                                                                              A building on or close to the dike affects multiple fail-
                                                                           ure mechanisms. The weight of the structure is transferred
Figure 4. Case studies for comparing the conservative and the new
probabilistic approach in this study.                                      to the underlying soil, where the load increases friction with
                                                                           the subsoil, increasing slope stability, and lateral stress on
                                                                           the soil, decreasing slope stability. On the slope itself, the
can be incorporated directly in variables of the limit state               structure affects the overtopping mechanism through the in-
functions or dike geometry (see Sect. 3.4.2). When broad-                  ner slope cover that prevents erosion. When a structure is
ening the dike on the floodplain or making a shallow outer                 present, it acts as a discontinuity in the outer grass cover
slope (see profiles 1 and 5 in Fig. 4), the hinterland remains             such that water can more easily erode soil during overtopping
unaffected by the dike itself, while in the other alternatives,            and is reflected in a lower critical overtopping rate. When a
the building becomes part of the flood defence. By reviewing               structure is absent, the space occupied by it in the profile is
the options the effect of the multifunctional elements on the              assumed to be empty. Furthermore there is no grass cover
safety after the reinforcements is evaluated in each frame-                but instead loose bare soil with practically no overtopping
work.                                                                      resistance (see Table 3). In the case study the effect of the
                                                                           structure on piping is insignificant as it does not penetrate
3.4.2   Schematization of multifunctional elements                         the aquifer, and pipes can still develop along the outside of
                                                                           the structure rather than directly beneath it.
Effects of multifunctional elements on dike failure are incor-                The structure in the case study is located 3 m behind the
porated through scenarios based on the fact sheet by Knoeff                inner dike toe. The structure is taken to be 15 m wide, exerts
(2017). For each mechanism, scenarios are defined in which                 a weight of 17 kN m−1 , and is embedded 1 m into the soil on
the element (e.g. tree, structure, and pipeline) affects the fail-         a shallow foundation without additional geotechnical mea-
ure mechanisms. The probability of failure can then be cal-                sures like piles or sheet pile walls. The horizontal position of
culated for each scenario. The total probability of failure for            the structure remains fixed for each reinforcement strategy,
the specific mechanism is computed by weighing the proba-                  while vertically the landward end of the structure is always

www.nat-hazards-earth-syst-sci.net/19/737/2019/                                       Nat. Hazards Earth Syst. Sci., 19, 737–756, 2019
744 R. Marijnissen et al.: Re-evaluating safety risks of multifunctional dikes
Table 3. Variation in parameters between reinforcement strategies.
Profile Inner slope Outer slope Crest height Berm width Crest width Flood plain Max. overtopping rate (µ, σ )1 (l m−1 s−1 )
no. (–) (–) (m) (m) (m) length (m) House present House absent No house
0 1 : 2.5 1:3 5.5 0 5 100 – – – – 100 120
1 1 : 2.5 1:3 5.5 0 10 95 – – – – 100 120
2 1 : 2.5 1:3 5.5 0 10 100 70 80 0.1 0 100 120
3 1 : 2.5 1:3 6.5 0 5 97 70 80 0.1 0 100 120
4 1 : 2.5 1:3 5.5 15 5 100 70 80 0.1 0 100 120
5 1 : 2.5 1 : 4.5 5.5 0 5 91.75 – – – – 100 120
6 1:4 1:3 5.5 0 5 100 70 80 0.1 0 100 120
7 1 : 10 1:3 6.5 0 5 97 70 80 0.1 0 100 120
1 Parameters of the log-normal distribution based on van Hoven (2015).
embedded only 1 m in the soil when the dike is expanded in- is negligible. This makes the berm a safer option. Neverthe-
wards. The probability the structure is absent during a high less this effect on the reliability of profile 4 was insignificant
water event is estimated to be 1 %. This probability is based compared to the overall failure probability, which was domi-
on the percentage of houses demolished in the Netherlands nated by piping and overtopping.
annually which has varied between 0.13 % and 0.23 % per
year (van der Flier and Thomsen, 2006) rather than the prob-
ability of structural failure of the house. The structure in its 4.2 Overtopping
demolished state leaves a discontinuity in the dike profile,
exerts no weight on the dike, and exposes bare clay on the The presence or absence of the structure had a minor impact
dike slope while leaving the remaining dike intact. on overtopping as can be seen in Fig. 6. This is mainly the
result of the relatively high predictability of the mechanism
itself (reflected by the steepness of the fragility curve) rather
4 Results than the direct influence of the structure on the mechanism
(reflected by the shift of the fragility curve) or additional un-
The results are presented in Fig. 5. As expected, the con-
certainty introduced by the structure (reflected by a decreas-
servative approach consistently yields the highest probabil-
ing steepness of the fragility curve). Because overtopping has
ities of failure for the assessed dikes. Both the probabilis-
a steep fragility curve, the influence of the structure only af-
tic assessment of the additional multifunctional uses and the
fects a limited range of water levels, and thus the net effect
monofunctional assessment yield a lower probability of fail-
of the structure on the safety of the dike is limited.
ure for each dike profile (Fig. 5).
4.1 Slope stability 4.3 Piping
The weight of the structure can improve the slope stability
of the dike in the probabilistic assessment as shown in the Including uncertainty because of unmanaged vegetation on
assessment of profile 1 with the structure only. The changes the floodplain has a large effect on piping failure, which was
in annual failure probabilities are solely due to the presence ignored in the assessments with the structure. Because the
or absence of weight increasing friction in the passive zone floodplain in the case study is wide, a scenario with a cavity
of the slip circle. In the conservative approach the weight of close to the dike results in a major reduction of the piping
structure is always ignored, leading to a noticeably higher length in the probabilistic assessment. Figure 6 shows a large
failure probability. This effect is most noticeable in profile difference between the fragility curves of the critical state
2 with only a structure. The reliability increases by a factor and the ordinary state. The presence of trees on the flood-
of 10 in the probabilistic assessment compared to a mono- plain on piping is even more pronounced in the conservative
functional dike due to a favourable position of the structure approach because the entire width of the floodplain is auto-
in the critical slip circle (see Fig. 6). In contrast to profile 2, matically excluded in the assessment. This leads to a differ-
in profile 4 the position of the structure is detrimental to sta- ent assessment of the need for piping specific reinforcement
bility, whereby a monofunctional dike has a reliability that is measures, in particular for the conservative assessment. Due
3 times larger (1.6 × 10⁻⁸ versus 5.0 × 10⁻⁸ ) for the proba- to the dominance of the piping failure mechanism in a con-
bilistically assessed dike with a structure. Both the structure servative schematization, there is an increasing discrepancy
and berm add weight, but the structure has the risk of being between the conservative assessment and the other assess-
absent while the risk of a monofunctional berm being absent ments.
Nat. Hazards Earth Syst. Sci., 19, 737–756, 2019 www.nat-hazards-earth-syst-sci.net/19/737/2019/R. Marijnissen et al.: Re-evaluating safety risks of multifunctional dikes 745
Figure 5. The probability of failure (Pf ) for every dike profile (0 to Figure 6. The difference between the fragility curves of the three
7) assessed as a monofunctional dike (blue bar), a multifunctional failure mechanisms and each profile, with both multifunctional ele-
dike with a conservative approach (red bar), and a multifunctional ments intact in blue and both multifunctional elements in a critical
dike using a probabilistic approach (yellow bar) in the situation in state in red.
which a structure is present (left), an impaired clay cover on the
floodplain could be present (middle), and both a structure and un-
reliable clay cover are present (right). The influence of the three
failure mechanisms overtopping (blue), piping (green), and stabil- are large differences in the schematization of a failure mech-
ity (red) is given per bar with a pie chart. anism (as was discussed for piping), differences in failure
probabilities between assessments scale roughly by the same
order of magnitude as the decrease in failure probability after
4.4 Assessments a reinforcement (Fig. 5; note the log scale for the probabil-
ity of failure). However, the relative differences become more
Finally the difference in probability of failure between a pronounced leading to proportionally higher failure probabil-
monofunctional dike and a multifunctional dike depends on ities in a conservative assessment compared to a probabilistic
the reliability of the monofunctional dike itself. Unless there assessment.
www.nat-hazards-earth-syst-sci.net/19/737/2019/ Nat. Hazards Earth Syst. Sci., 19, 737–756, 2019746 R. Marijnissen et al.: Re-evaluating safety risks of multifunctional dikes
5 Discussion which multifunctional use can affect the probability of fail-
ure of the dike was also found in this study. As the reliability
The results show a large difference between the reliability of the dike itself increases, the influence of a multifunctional
assessed between the conservative approach and the prob- element on the level of safety decreases as the added variabil-
abilistic approach. A prevailing view against the multifunc- ity of the multifunctional element becomes smaller compared
tional use of flood defences is that these require larger dimen- to the uncertainties in other parameters the dike was already
sions to meet the same safety standard as a traditional dike designed for. This effect of dike reliability on the influence
(Ellen et al., 2011a; van Loon-Steensma and Vellinga, 2014). of multifunctional elements has implications. An increase in
However, as the case study above illustrated, this perception failure probability due to multifunctional elements is likely
only holds true for a conservative approach that omits multi- to be overestimated in a traditional assessment for dikes with
functional elements from the assessment. With a more proba- a high protection level, while similarly for these dikes also
bilistic approach towards multifunctional elements, their per- only a limited decrease in failure probability can be expected
ceived negative influence was significantly smaller or could from beneficial multifunctional elements. Conversely, dikes
even result in a net positive influence. Positive contributions with a low protection level are influenced more by both ben-
of multifunctional elements under likely conditions can be eficial and detrimental effects of multifunctional use of the
included as well as the likelihood of the multifunctional ele- flood defence.
ments affecting the flood defence negatively. This study only looked at the effects of multifunctional
A drawback of the probabilistic approach is that it needs use on flood protection. However, multifunctional use comes
specific information about the failures and states of multi- with its own set of requirements that must be taken into ac-
functional elements before an assessment can be conducted. count. For example, structures need to comply with building
For example, erosion around or over discontinuities during codes, and flood protection measures in nature reserves can
overtopping (possibly due to the presence of multifunctional be subject to environmental protection regulations, while to
elements like a road) is highly variable and hard to capture preserve landscape values substantial dike heightening may
in a generic limit state function, even with well-calibrated be unacceptable. How much such additional non-flood pro-
models (Hoffmans et al., 2009; Bomers et al., 2018). De- tection requirements influence the design of dikes needs to
pending on the sensitivity of the failure probability to these be researched for a successful implementation of MFFDs.
processes, assumptions on effects and statistical distributions This study investigated the assessments of multifunctional
would need to be increasingly conservative to guarantee the flood defences for the current situation. In the design of these
safety level is met. However, new information on the inter- defences, however, future conditions, like for example cli-
action between multifunctional uses and failure mechanisms mate change or societal trends, need to be taken into account.
is becoming increasingly available through ongoing research Scenarios for future sea-level rise in the coming century vary
(Aguilar-López et al., 2018; Vuik et al., 2018). Furthermore, between 0.23 and 0.98 m (IPCC, 2013). Incorporating benefi-
new techniques are being employed to continuously moni- cial multifunctional uses of flood defences, either natural like
tor the dikes in detail (Hanssen and van Leijen, 2008; Herle marshes or man-made like structures, can become an asset to
et al., 2016), while advances in remote sensing allow for achieve the levels of flood protection needed in the future.
closer monitoring of the state of foreshores (Niedermeier et
al., 2005; Friess et al., 2012). As a result, a probabilistic ap-
proach towards multifunctional elements can capitalize on 6 Conclusions
these advances by updating the previously assumed risks in
assessments with observations of the actual performance of This study analysed how a full probabilistic approach to-
MFFDs over time. wards multifunctional flood defences can change the as-
Aside from the effects of multifunctional elements them- sessed safety compared to the commonly applied conserva-
selves, other uncertainties influence how much the multi- tive approach in which multifunctional use of the flood de-
functional use of the flood defence can affect the level of fence can only be shown to have no significant negative in-
safety. For piping, Aguilar-López et al. (2015) demonstrated fluence. Although probabilistic assessments have been used
that by reducing the uncertainty in the seepage properties before, the new regulations of the Water Act in the Nether-
of the soil of a multifunctional dike, the probability of a lands necessitate a full probabilistic assessment of flood de-
piping failure is already significantly reduced. Lanzafame fences. Therefore, a probabilistic framework incorporating
(2017) concluded variability introduced by vegetation only multifunctional elements probabilistically was developed.
has a small effect on the probability of a slope failure due The overall conclusion is that application of a probabilistic
to larger uncertainties in strength and seepage of the soil. In approach towards multifunctional use of the flood defence
contrast, a relatively small disturbance by burrowing animals will lead to a lower assessed risk of flooding compared to
in a fragile dike has resulted in a breach under conditions it conservative assessments because (1) positive contributions
had previously survived (Orlandini et al., 2015). The obser- of multifunctional elements to safety can be included, even
vation that the dike’s own reliability influences the degree to when in a critical state there is a negative contribution to
Nat. Hazards Earth Syst. Sci., 19, 737–756, 2019 www.nat-hazards-earth-syst-sci.net/19/737/2019/R. Marijnissen et al.: Re-evaluating safety risks of multifunctional dikes 747 safety, and (2) the risk of multifunctional elements being in such a critical state is made explicit. Another important as- pect is that effects of multifunctional use on safety become smaller as the reliability of the dike increases. Therefore, monofunctional dikes which already have a high reliability are more suitable to be combined with multifunctional uses detrimental to safety, whereas dikes with a low reliability can benefit more from multifunctional uses that contribute to safety. Based on the results, we recommend that a probabilistic framework is further developed and implemented for includ- ing multifunctional elements into dike assessments. While many knowledge gaps are still present in quantifying the ef- fects of multifunctional use of flood defences, incorporating scenarios in which a multifunctional element can harm or help flood protection can already provide insights in syner- gies that can be exploited or dangers that can be mitigated. These scenarios and associated probabilities will need to rely on expert judgment. However, it is expected that with the growing number of methods to monitor dike performance and ongoing studies on dike failures, these gaps can be filled in the future. To this end, further research is required on the proper scenarios and their associated probabilities that can be used to improve future assessments of multifunctional dikes. Additionally, more research is needed to assess how multi- functional elements influence the safety of dikes over longer periods, especially in relation to the large uncertainties in- volved in climate change. A real-world case study for design should be used to explore how these aspects can be incorpo- rated in practice. Data availability. The data supporting the findings of this study are available within the article and its appendices. www.nat-hazards-earth-syst-sci.net/19/737/2019/ Nat. Hazards Earth Syst. Sci., 19, 737–756, 2019
748                                                    R. Marijnissen et al.: Re-evaluating safety risks of multifunctional dikes

Appendix A: Case study parameters

The dike geometry of the base case is captured by the vari-
ables in Table A1.
   The soil was divided into three layers: the dike core, the
blanket layer, and the aquifer. Representative values for the
soil layers were taken from known soil types in the Dutch
riverine area (Tables A2, A3, and A4).
   Hydraulic load parameters are given in Table A5. Repre-
sentative water and wind characteristics were estimated from
the hydraulic loads database of the upper Rhine area in the
Netherlands, which is available as part of the WBI software.
For simplification, the wind direction is only considered in
the direction perpendicular to the dike.

Table A1. The standard geometry parameters for the dikes in the hypothetical case study.

          Symbol        Description                                                                      Distribution    Parameters
                                                                                                                              µ       σ
          zhinter       elevation of the hinterland (m) above reference datum                            deterministic       0         –
          zcrest        elevation of the crest (m) above reference datum                                 deterministic     5.5         –
          zfore         elevation of the foreshore (at the dike toe) (m) above reference datum           deterministic       0         –
          zdeep         the average bed level (m) above reference datum along the fetch of the wind      deterministic   −0.8          –
          tan(αin )     inner slope angle (–)                                                            deterministic   1/2.5         –
          tan(αout )    outer slope angle (–)                                                            deterministic     1/3         –
          Bcrest        crest width (m)                                                                  deterministic       5         –
          Lf            length of the foreshore                                                          log-normal        100        10

Table A2. Standard parameters of the blanket layer for the dikes in the hypothetical case study.

             Symbol         Description                                                  Distribution            Parameters
                                                                                                                   µ              σ
             dblanket       blanket layer thickness (m)                                  log-normal                2           0.6
             γsat,blanket   saturated volumetric weight of the blanket layer (kN m−3 )   normal                 18.8           0.1
             kblanket       specific conductivity of the blanket layer (m s−1 )          log-normal        2 × 10⁻⁸      2 × 10⁻⁸
             chblanket      cohesion of blanket material (kN m−2 )                       deterministic             0             –
             ϕblanket       friction angle of blanket material (◦ )                      normal                   28           4.5

Nat. Hazards Earth Syst. Sci., 19, 737–756, 2019                                   www.nat-hazards-earth-syst-sci.net/19/737/2019/
R. Marijnissen et al.: Re-evaluating safety risks of multifunctional dikes 749
Table A3. Standard parameters of the aquifer layer for the dikes in the hypothetical case study.
Symbol Description Distribution Parameters
µ σ
daquifer aquifer layer thickness (m) deterministic 30
γsat,aquifer saturated volumetric weight of the aquifer layer (kN m−3 ) normal 18 0.1
η drag factor/White’s coefficient (–) deterministic 0.25
θ bedding angle (rad) deterministic 0.61
d70 70th percentile of the grain size distribution (m) log-normal 3 × 10⁻⁴ 4.61 × 10⁻⁵
kaquifer specific conductivity of the aquifer (m s−1 ) log-normal 4.86 × 10⁻⁴ 2.82 × 10⁻⁴
chaquifer cohesion of aquifer material (kN m−2 ) deterministic 0 –
ϕaquifer friction angle of aquifer material (◦ ) normal 31.3 4.5
Table A4. Standard parameters for the dike soil material for the dikes in the hypothetical case study.
Symbol Description Distribution Parameters
µ σ
γsat,core saturated volumetric weight of the dike core (kN m−3 ) normal 18.2 0.1
γdry,core dry volumetric weight of the core (kN m−3 ) normal 13.1 0.1
chcore cohesion of core material (kN m−2 ) deterministic 0 –
ϕcore friction angle of core material (◦ ) normal 33 4.5
Table A5. Standard hydraulic load and resistance parameters for the dikes in the hypothetical case study.
Symbol Description Distribution Parameters Source
µ σ
ρw density of water (kg m−3 ) normal 1000 1 known constant
h water level (m) above reference generalized −2.5 σ = 1.5, assumed
datum
extreme value ξ = −0.17
γbreak breaker index of waves (–) normal 0.425 0.075 estimated; van der Meer
et al. (2016); TAW (2002)
γf roughness factor for an outer deterministic 1 – van der Meer et al. (2016);
slope with grass (–) TAW (2002)
uv hourly wind speed at 10 m Gumbel 16.8 1.6 assumed
above the surface (m s−1 )
Fmax fetch (m) deterministic 1800 assumed
qc critical overtopping discharge van Hoven (2015)
(l m−1 s−1 )
no house (closed grass cover) log-normal 100 120
intact house (open grass cover) log-normal 70 80
collapsed house (no major log-normal 0.1 –
overtopping allowed)
www.nat-hazards-earth-syst-sci.net/19/737/2019/ Nat. Hazards Earth Syst. Sci., 19, 737–756, 2019750 R. Marijnissen et al.: Re-evaluating safety risks of multifunctional dikes
Appendix B: Overflow and overtopping limit state With the wave characteristics, the average overtopping dis-
function charge is calculated following the formulas by TAW (2002)
and van der Meer et al. (2016). Since no berm is present on
Overflow is calculated directly from the water level (h) and the dike of the case study and waves are assumed to be per-
crest height (zcrest ) by the formula for a broad crested weir: pendicular, factors related to these aspects are omitted.
√
p 2 3 3 tan (αout )
qoverflow = 2g × (h − zcrest ) 2 . (B1) ξ0 = q (B8)
9 2πHs
gTs2
To calculate the overtopping discharge, first the significant q1 = min (B9)
wave height (Hs ) and period (Ts ) perpendicular to the dike
are estimated from the water depth (h), fetch length (F ), and 0.067 zcrest − h 1
√tan α × ξ0 × exp c1 × H
×
ξ
wind speed (uwind ) with the equations of Bretschneider as 0 γf
×
out s
presented by Holthuijsen (1980):
zcrest − h 1
0.2 × exp −2.6 × ×
Hs γf
gF q
Fx = (B2) × g × Hs3
u2wind
gh q2 = (B10)
hx = 2 (B3)
uwind z crest − h
10c2 × exp − × Hs × (0.33 + 0.022 × ξ0 )
γf
p1 = tan h 0.53 × h0.75
x (B4) q
× g × Hs3
p2 = tan h 0.833 × h0.375
x (B5)
q1 ξ0 < 5
u2wind 0.42
F log(q1 )+log(q2 )
Hs = 0.283 × × p1 × tan h 0.0125 × x (B6) qovertopping = 10 2 5 ≥ ξ0 ≥ 7 (B11)
g p1
q2 ξ0 > 7
× mBret,H
A description and values for the variables are presented in
Fx0.25
uwind
Ts = 7.54 × × p2 × tan h 0.077 × (B7) Table B1.
g p2 The limit state function is then evaluated as
× mBret,T .
Zoverflow and overtopping = qc − qoverflow − qovertop . (B12)
Table B1. Description and values of variables in the overtopping and overflow limit state function.
Variable Description Note
αout Outer slope angle (–) –
γf Friction factor for the outer slope (–) 1 (TAW, 2002)
Hs Significant wave height (m) See Eq. (B6)
ξ0 Iribarren number (–) See Eq. (B8)
c1 Factor for overtopping (–) Normally distributed with µ = 4.75
and σ = 0.5 (TAW, 2002)
c2 Factor for overtopping (–) Normally distributed with µ = −0.92
and σ = 0.24 (TAW, 2002)
mBret,H Model factor for Bretschneider Log-normally distributed with µ = 1
equation and σ = 0.27 (Diermanse, 2016)
mBret,T Model factor for Bretschneider Log-normally distributed with µ = 1
equation and σ = 0.13 (Diermanse, 2016)
Nat. Hazards Earth Syst. Sci., 19, 737–756, 2019 www.nat-hazards-earth-syst-sci.net/19/737/2019/R. Marijnissen et al.: Re-evaluating safety risks of multifunctional dikes 751
Appendix C: Piping limit state function
Piping is evaluated with the piping erosion formulae of Sell-
meijer et al. (2011). The critical head difference (Hc ) is cal-
culated as
RD 0.35
γp − γw
FR = × η × tan θ × (C1)
γw RDm
d70 m 0.6
d70
FS = √ 3
× (C2)
κL d70
0.28
2.8 +0.04
daquifer daquifer
L −1
FG = 0.91 × (C3)
L
Hc = FR × FS × FG × L. (C4)
Failure occurs when the critical head level (Hc ) is ex-
ceeded by the head difference (H ) and the resistance of the
blanket layer:
Zpiping = mp × Hc − (H − 0.3 × dblanket ). (C5)
The variables introduced by Eqs. (C1) to (C5) are given
in Table C1 and are based on estimates used in Dutch dike
assessments. The intrinsic permeability (κ) is directly con-
verted from the permeability of the aquifer (kaquifer ).
Table C1. Description and values of variables in the piping limit state function.
Variable Description Distribution Parameters Unit
γp Specific weight of sand particles Deterministic 26 kN
m3
γw Specific weight of water Deterministic 10 kN
m3
η Drag factor Deterministic 0.25 –
θ Bedding angle (◦ ) Deterministic 35 –
RD Relative density of the material com- Deterministic 1 –
RDm
pared to small-scale piping
experiments
d70 m Reference d70 of the material used in Deterministic 2 × 10⁻⁴ m
small-scale piping experiments
mp Model factor for piping Log-normal µ = 1, –
σ = 0.12
www.nat-hazards-earth-syst-sci.net/19/737/2019/ Nat. Hazards Earth Syst. Sci., 19, 737–756, 2019752 R. Marijnissen et al.: Re-evaluating safety risks of multifunctional dikes
Appendix D: Macro stability limit state function
The macro stability of the dike is evaluated using the schema-
tization of the phreatic surface of a clay dike from the TAW
(2004) following the official Dutch guidelines (see Fig. D1).
The TAW (2004) schematization assumes a drop in the
phreatic surface on the interface of the dike with the outside
water (1 m as by default) and a linear drop towards the in-
ner toe. The water head in the aquifer was calculated using
the equations by TAW (2004) as implemented in the D-Geo
Stability software (Brinkman and Nuttall, 2018).
The stability of the slope is calculated with the method by
Van (2001) for the slip plane and works on the same prin-
ciple as the method by Bishop (1955). The main difference Figure D1. Schematization of the slip plane and phreatic surface
between the methods is the separation of the slip plane in used for the macro stability calculation.
an active circle connected by a straight section followed by
a passive circle. The centres of these circles of the critical
The iterative procedure of finding the critical slip plane
slip plane (RA and RP ) are found iteratively using the D-Geo
is both computationally demanding and complicates conver-
Stability software (Brinkman and Nuttall, 2018).
sion in the probabilistic FORM algorithm. To speed up the
The slip plane is divided into slices, and the net force in-
procedure in the computation, first, a test run is performed
duced by each slice is calculated. If the moment induced by
using average soil strength parameters at a fixed critical slip
the active slices (6MS ) is greater than the combination of
plane with a water level halfway at the crest. With the results
friction forces and moments induced by the passive slices
of the first indicative run, stochastic variables with little to no
(6MR ), the slope is unstable. This is both expressed in a fac-
influence (|α| < 0.001) are set as constants. Then the entire
tor of safety (FS ) and a Z function.
model was run for each discretized water level.
6MR After the run the fragility curve was checked for points
FS = (D1) where no convergence was achieved with FORM or a non-
6MS
critical slip circle must have been evaluated. To this end,
Zmacrostability = FS − 1 (D2)
points where the maximum number of iterations was reached
To calculate the probability of failure with FORM, the fac- or the probability of failure decreased with ascending wa-
tor of safety needs to be evaluated during each iteration with ter level were removed to obtain a monotonically increasing
D-Geo Stability. An experimental version of D-Geo Stability fragility curve.
with an additional piece of software from the same develop-
ers called the probabilistic toolkit (PTK) was utilized to au-
tomatically execute D-Geo Stability with updated parameters
calculated by the FORM algorithm in the PTK.
Nat. Hazards Earth Syst. Sci., 19, 737–756, 2019 www.nat-hazards-earth-syst-sci.net/19/737/2019/R. Marijnissen et al.: Re-evaluating safety risks of multifunctional dikes 753
Appendix E: FORM algorithm With the mean and standard deviation calculated from the de-
sign point (x ∗ ), the reliability index (β) and influence factor
The first-order reliability method (FORM) is a method to of each variable (αXi ) are calculated.
iteratively calculate the probability of a limit state function
(Z (X) ≤ 0) being exceeded given a set of independent ran- µZ
β= (E5)
dom variables (X) (Hasofer and Lind, 1974). The starting σZ
point for the iteration is arbitrary, but usually the mean of ∂Z σX0
the variables is taken as the first point to evaluate (x ∗ ). The αX i = × i (E6)
∂Xi σZ
problem is first simplified by converting the random variables
before each iteration into realizations of equivalent normally The point is updated by adjusting each variable based on the
distributed variables (x 0 ) with an equivalent normal transfor- overall safety level (β) and the sensitivity of the limit state to
mation (Rackwitz and Flessler, 1978). the variable (αXi ):
µ0 Xi = xi∗ − σ 0 Xi × 8−1 F xi∗ xi∗ = µ0 Xi − αXi βσ 0 Xi .
(E1) (E7)
∗
−1
ϕ 8 F xi The process is repeated until the reliability index has con-
σ 0 Xi = , (E2)
f xi∗
verged and no longer changes significantly after an iteration.
While the method is effective, there are limitations. It is
where µ0 Xi and σ 0 Xi are the mean and standard deviation of not guaranteed that FORM finds the design point with the
the equivalent normal distribution of variable xi in the point highest probability but rather converges to a local design
x ∗ . Also, f and F are the probability density function (PDF) point. Furthermore, for FORM to converge, the limit state
and cumulative distribution function (CDF) of variable xi , function should be smooth without jumps or discontinuities.
while ϕ and 8 are the standard normal PDF and CDF. This complicated the implementation of, for example, macro
The mean and standard deviation of the limit state function stability, as when a different slip circle becomes critical, there
are evaluated by can be a sudden jump in the evaluation of the limit state func-
n tion.
X ∂Z 0
µZ = Z x ∗ + (µ Xi − xi∗ ) (E3)
i=1
∂X i
v
uX ∂Z 2 2
u n
σZ = t σX0 i . (E4)
i=1
∂X i
www.nat-hazards-earth-syst-sci.net/19/737/2019/ Nat. Hazards Earth Syst. Sci., 19, 737–756, 2019You can also read