Reaching out: China's outbound love story - OAG
←
→
Page content transcription
If your browser does not render page correctly, please read the page content below

Reaching out: China’s
outbound love story

                        1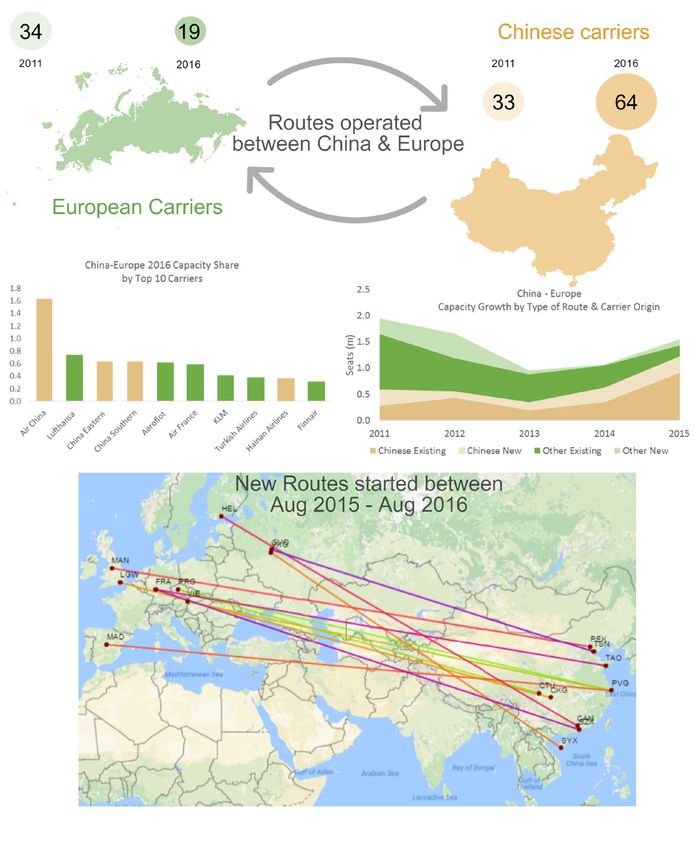
China reaches out: shifting the balance

    Contents

    Shifting the balance                                         3

    New routes to where?                                         4

    China’s International connectivity by region                 7

    On their doorstep – China’s Asian connections                7

    China and Europe – Chinese carriers lead the way             8

    Leading the way in North America                             10

    Southwest Pacific                                            12

    Middle East                                                  14

    To Africa and beyond                                         14

    Bilateral agreements - time to renegotiate?                  17

    Where next for the Chinese big four?                         18

    China Eastern                                                19

    Air China                                                    20

    China Southern Airlines                                      21

    Hainan Airlines                                              22

    This is just the beginning                                   23

2   © 2016 OAG Aviation Worldwide Limited. All rights reserved
Reaching out:
China’s outbound love story

Shifting the balance
As World Routes heads to Chengdu in September, OAG takes a timely look at
where China’s international capacity is headed. Strong growth is taking place in
China’s international market, largely driven by Chinese carriers. We analyse the
past five years of capacity growth, explore key features of the market today and
then speculate where these trends may lead us.

Historically the Chinese domestic market has dwarfed international services. It
still does, but the balance is shifting. Although still considerably smaller than the
domestic market, international capacity to and from China is growing faster. Back
in 2011 there were 92m international seats to and from China, but this year we
are already expecting capacity to exceed 164m scheduled airline seats. 2016
will be the first year in which carriers have added more capacity in international
markets than domestically, with OAG data for 2016 showing an additional 19m
international seats compared to 13m extra domestic seats. International capacity
growth has averaged 12% each year for the last five years while the domestic
market has grown by an average of 8% per annum.

CHINA CAPACITY GROWTH RATES

15%

                                                                                        International
10%

 5%

                                                                                           Domestic
 0%

      2011              2012               2013              2014               2015               2016

               schedules analyser
Source:

With Boeing estimating that there will be 100m overseas visitors from China by
2020, it is no surprise that the past five years have seen carriers from outside
China wake up to the potential of this market. Chinese aviation policy has also
been instrumental in creating this shift in the balance between international and
domestic services. China’s aviation policy has enabled Chinese carriers to more
than double international capacity to 79 million seats in 2016 and they now
operate 49% of all international capacity to and from China.

                                                                                                          3
China reaches out: shifting the balance

    New routes to where?
    In 2011, there were 592 international airport pairs operated from China; today this has
    almost doubled to 1,055 pairs. The arrival of new generation, more efficient aircraft
    such as the B787 and A350 has been fortuitous timing for carriers seeking to serve
    secondary Chinese markets to international destinations. Being able to operate
    a cost-efficient long-haul service that is not predicated on daily flights to any one
    destination is undoubtedly a contributing factor in this growth.

    Other parts of Asia account for the vast majority of air services to and from China, with
    80% of all international routes to destinations within Asia. On average, airlines have
    added 69 new routes each year for the past five years between China and other parts
    of Asia, although it may be that this pattern of growth may be tapering off in 2016.
    Chinese airlines operate just under half – 49% - of all seats between China and the
    rest of Asia.

    Air services to the rest of the world make up the remaining 20% of China’s
    international routes and these routes have grown, on average, with 19 new city pairs
    being added each year since 2011.

    CHINA INTERNATIONAL ROUTES BY REGION

    1200

    1000

     800

     600

     400

     200

       0
                  2011                2012               2013                 2014             2015                2016
                     Asia    Europe      North America    Southwest Pacific     Middle East   Africa   Latin America

    CHINA INTERNATIONAL ROUTES EXCLUDING ASIA

    250

    200

    150

    100

      50

       0
           2011                   2012                   2013                  2014                2015                   2016
                         Europe     North America    Southwest Pacific    Middle East     Africa   Latin America

                         schedules analyser
    Source:

4   © 2016 OAG Aviation Worldwide Limited. All rights reserved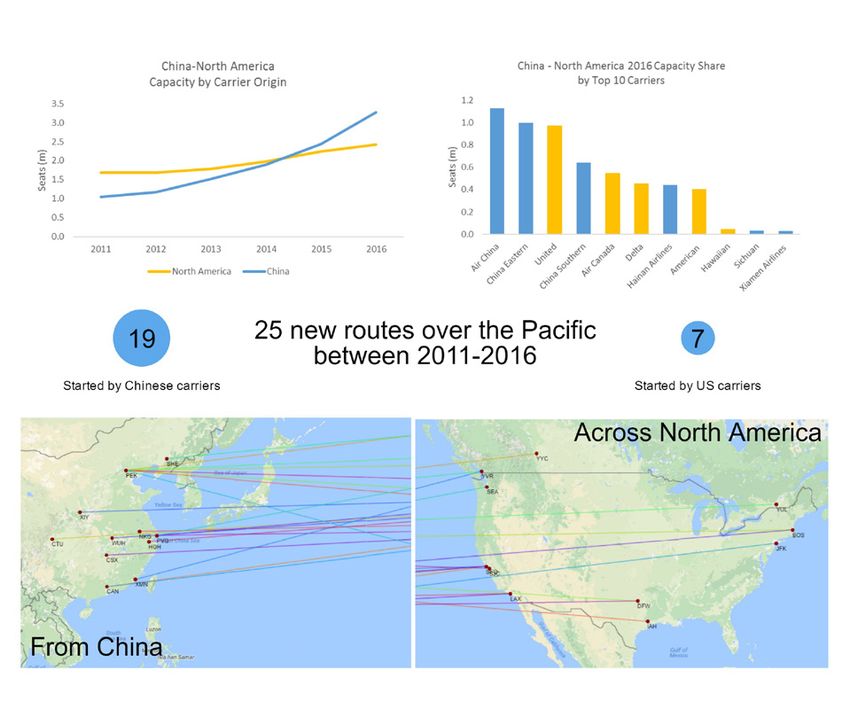
Drawing on data for the full year of 2016, there are already 24 new international
routes to regions beyond Asia. European destinations make up the largest
share of routes, with a total of 83 services in place between China and Europe.
Relatively, Africa is growing the number of services to China fastest of all the
regions outside Asia, with 11 more routes than it had in 2011, a 19% increase.

The only region not to see any significant growth to and from China in terms of
routes is Latin America, but the range involved means it is unlikely to be a target
market until the next breakthrough in aircraft payload and distance technology.

CHINESE CARRIERS CAPACITY SHARE BY REGION

                                               88%

                                 57%
     49%                                                                                               50%
                  44%

                                                              17%
                                                                            11%
                                                                                           0%

 2011 2016     2011 2016      2011 2016     2011 2016     2011 2016      2011 2016     2011 2016
     Asia        Europe       N. America     Southwest     Middle East     Africa      Latin America
                                              Pacific

               schedules analyser
Source:

For Chinese carriers there have been clear priorities for growth. The consequence
of this is that in two regions – Southwest Pacific and North America – these
Chinese carriers effectively “punch above their weight” and now operate over half
of all capacity.

This represents a considerable shift in services to North America over the last five
years. Back in 2011 Chinese carriers operated 38% of seats; today they operate
57%.

The Australian market makes up most of Southwest Pacific capacity and Chinese
carriers were already a force in these markets five years ago. Since then they have
increased their share of capacity from 82% in 2011 to 88% today.

                                                                                                             5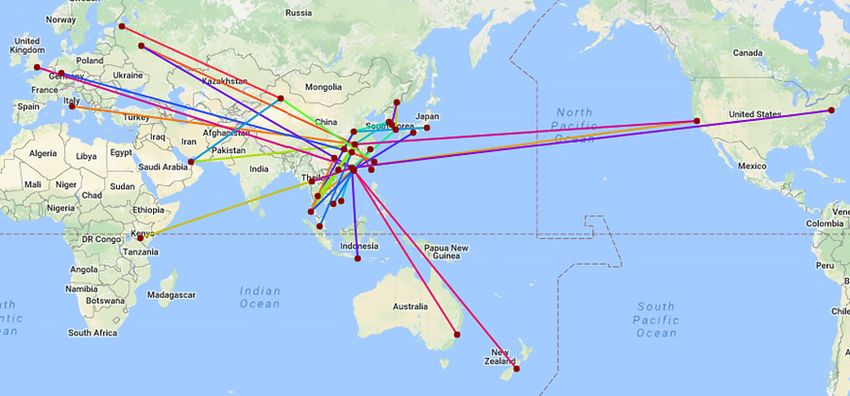
China reaches out: shifting the balance

                                                                   China International Routes
                                                                  go from strength to strength

                                                                           241
                                                                 New routes operated in August
                                                                 2016 compared to August 2015

              These services
              operated from

                     60
           different arports
                in China

                        schedules analyser
    Source:

6   © 2016 OAG Aviation Worldwide Limited. All rights reserved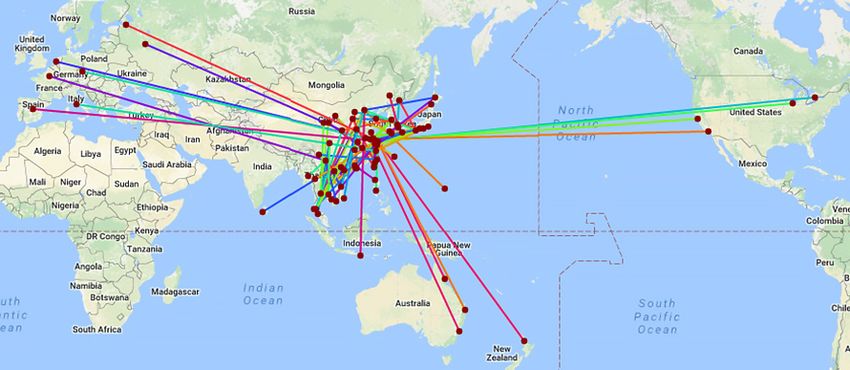
China’s international
connectivity by region
We now look at each region and consider China’s international connectivity in
more detail.

On their doorstep – China’s Asian
connections
The market between China and the rest of Asia is by far China’s largest
international market, with 127 million seats in 2016, up considerably from 71m just
five years ago. China – Asia capacity has grown at an average annual rate of 12%
since 2011, with Chinese carriers growing at 15% each year. Within Asia, almost
two-thirds of capacity to and from China operates to destinations in North East
Asia, including Hong Kong, South Korea and Japan.

Making up a third of China-Asia capacity, South East Asia has seen the fastest
growth in capacity with seats growing at an average of 21% each year.

While intra-Asia routes make up 80% of all international routes from China, they
contribute around half of all international seats. On those routes China’s carriers
operate about 50% of capacity except to and from South Asia where they have
a greater proportion of capacity, and particularly between China and India where
they operate 85% of seats. Four Chinese carriers (Air China, China Eastern, China
Southern and Shangdong Airlines) operate in this market, versus just one Indian
carrier, Air India. Partly the protection offered by the Indian government to carriers
such as Air India, through preventing international operations by carriers without
five years’ experience of operating in India’s domestic market, has thwarted the
country’s ability to compete internationally.

CHINA TO ASIA CAPACITY BY REGION                        CHINA – JAPAN CAPACITY

                                                        CHINA’S TOP 10 INTERNATIONAL COUNTRY
                                                        MARKETS IN 2016

CHINA – THAILAND CAPACITY

                                                                                               7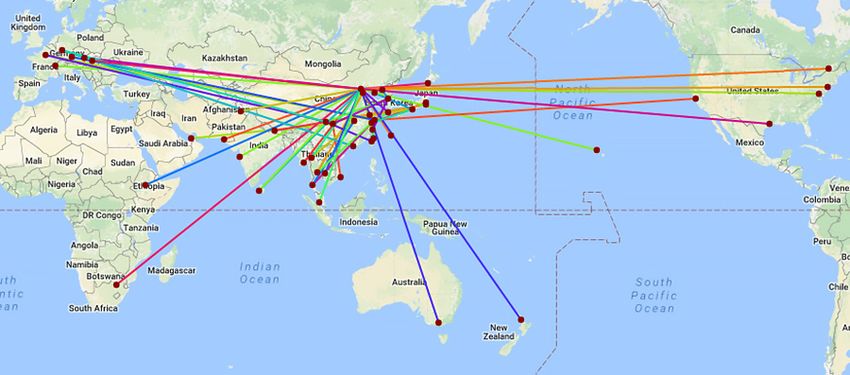
China reaches out: shifting the balance

    Looking at the Top 10 Asian country markets from China shows that in the Top
    3 markets, Chinese carriers operate the greatest share of capacity. These are
    also some of the fastest growing markets, with China-Thailand growing at an
    average annual rate of 36% since 2011, South Korea at 13% and Japan at 10%.
    On China-Thailand, Chinese carriers started to operate the dominant share of
    capacity in 2013, and now operate 11.5m seats. They have been growing capacity
    at an average annual rate of 44%.

    A similar picture emerges on China-Japan routes where Chinese carriers are
    operating 69% of capacity in 2016 and have grown at an average rate of 14%
    each year since 2011, overtaking Japanese carriers in 2013.

    China and Europe - Chinese carriers lead
    the way
    European countries top the list of overseas destinations for Chinese visitors to
    travel to, after places in Asia. France, Italy, Switzerland and Germany have all
    featured among the Top 10 foreign destinations in Chinese Outbound Tourism
    statistics. Unsurprisingly, airlines have responded to demand and between Europe
    and China, carriers have added on average just under half a million additional
    seats every year for the last five years. 66% of this additional capacity has been
    on services between new destinations while the remainder has been the result of
    carriers adding capacity on existing routes.

           34                                  19                                                                                Chinese carriers
           2011                               2016                                                                              2011                           2016

                                                                                                                                 33                              64
                                                               Routes operated
                                                             between China & Europe

                  European carriers

    2016 CAPACITY SHARE BY TOP 10 CARRIERS                                                       2016 CAPACITY GROWTH BY TYPE OF ROUTE &
                                                                                                 CARRIER ORIGIN
     1.8                                                                                        2.5
     1.6
     1.4                                                                                        2.0
     1.2
     1.0                                                                                        1.5
                                                                                    Seats (m)

     0.8
     0.6                                                                                        1.0
     0.4
     0.2
                                                                                                0.5
     0.0
             na

                     sa

                                n

                                                rn

                                                  t

                                                 e

                                                        M

                                                               es

                                                                         s

                                                                               r
                                              flo

                                                                               ai

                                                                                                0.0
                                                                         ne
                                             nc
                             er

                                                      KL
                                            he
                   an

                                                                 n
            hi

                                                                              nn
                                           ro
                          st

                                                             rli

                                                                       rli
                                          ra
           rC

                                    ut
                  fth

                                                                              Fi

                                                                                                  2011               2012              2013               2014               2015
                         Ea

                                       Ae

                                                             Ai

                                                                     Ai
                                       rF
                               So
       Ai

                Lu

                                                        sh

                                                                     n
                        na

                                    Ai

                                                                  na
                             na

                                                       ki
                     hi

                                                                                                      Chinese existing      Chinese new       Other existing     Other new
                                                               ai
                                                         r
                             hi
                     C

                                                      Tu

                                                              H
                          C

8   © 2016 OAG Aviation Worldwide Limited. All rights reserved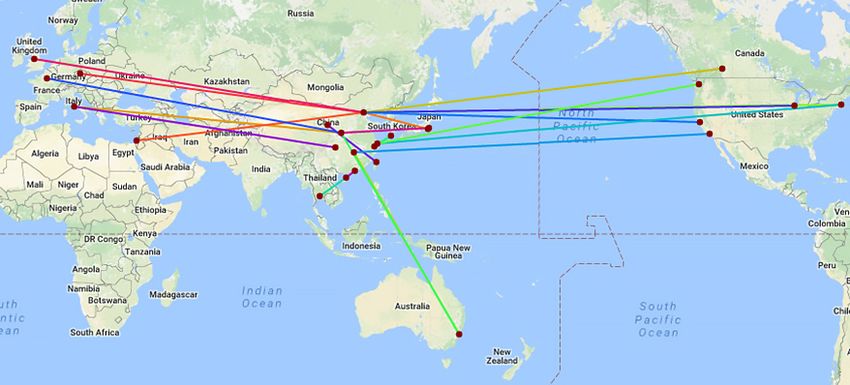
NEW ROUTES STARTED BETWEEN AUG 2015 – AUG 2016

Since 2014, Chinese carriers have been adding significant capacity onto their
existing, as well as new, routes. In contrast, non-Chinese carriers have typically
added more to existing routes than new ones, undoubtedly as it’s easier to add
capacity to an established route and there’s less familiarity of secondary Chinese
cities by European carriers.

In the last five years, Chinese carriers have been growing faster on average each
year, with 10.1% more seats annually since 2011 on Western European routes
than European carriers.

On routes between China and Western Europe, Chinese carriers have been
increasing their capacity share, raising it from 39% in 2011 to 46% in 2016.

Air China has the largest share of capacity with 22% of all seats between Europe
and China. In five years Air China has almost doubled the number of routes served
from 12 in 2011 to 20 in 2016, adding destinations such as Vienna, Dusseldorf,
Munich and Geneva to its route network. Significant growth in capacity has gone
onto some of its core routes with Beijing-London Heathrow more than doubling
in size in just 5 years, and strong growth also on Beijing-Paris. Air China has also
started to develop European services away from its Beijing and Shanghai hubs,
opening European routes from Chengdu in 2013 and from Shenzhen in 2016.

Similarly, China Eastern has added significant capacity on its Shanghai-Paris route
over the last five years, almost doubling capacity. It has gone from operating just
six routes in 2011 to 13 in 2016, with six of these starting in 2016.

China Southern has also expanded at a similar rate, from eight routes in 2011
to 15 in 2016, although the development of these routes has been spread more
evenly over the last five years.

From European carriers, growth has been more concentrated on existing routes.
Lufthansa has increased its routes to China by one route in the last five years, with
the addition of service from Frankfurt to Shenyang in 2012 and Qingdao in 2016,
but stopping operation to Guangzhou. Air France has also focused on existing
routes, adding just one new route to Wuhan from Paris in 2012. It has, however,
nearly doubled capacity on its Paris-Shanghai route since 2011.

KLM has added no new routes in the last five years. With the exception of their
Amsterdam–Shanghai route which has increased in capacity by 12% since 2011,
most of their other routes remain unchanged in terms of capacity.

                                                                                        9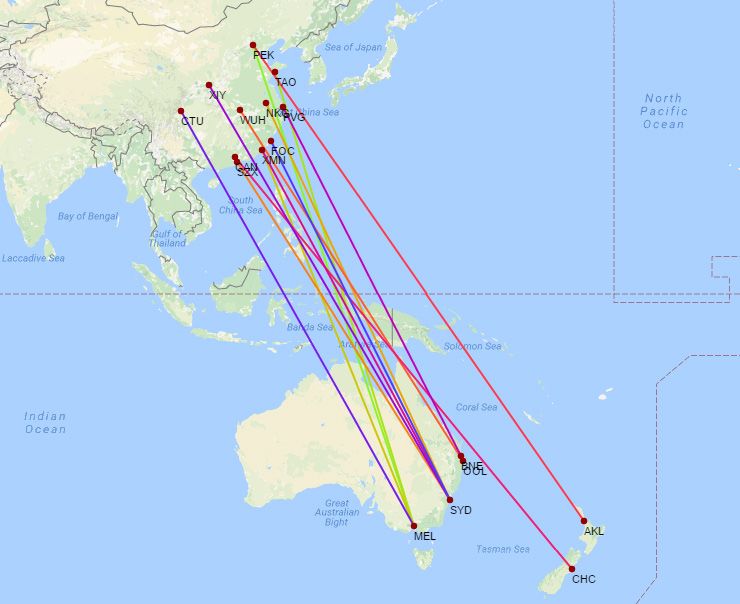
China reaches out: shifting the balance

     Leading the way in North America
     The North America-China market is the next largest international market from
     China. It too has experienced considerable growth with the number of city pairs
     served in 2016 double the number five years earlier. It’s clear that Chinese carriers
     have maximised the bilateral opportunities available to them on North American
     routes, with annual growth rates averaging 26% for the last five years, versus 8%
     annual growth rates from North American carriers.

       CHINA–NORTH AMERICA CAPACITY BY CARRIER ORIGIN

                 3.5                                                                                                 Chinese carriers

                 3.0

                 2.5

                                                                                                                       North America
                 2.0
     Seats (m)

                 1.5

                 1.0

                 0.5

                 0.0

                       2011                 2012                2013               2014                    2015                  2016

                                schedules analyser
     Source:

       CHINA–NORTH AMERICA 2016 CAPACITY SHARE BY TOP 10 CARRIERS

                 1.2

                 1.0

                 0.8
     Seats (m)

                 0.6

                 0.4

                 0.2

                 0.0
                              a

                                        n

                                                 d

                                                           rn

                                                                    a

                                                                          lta

                                                                                      es

                                                                                                  n

                                                                                                            an

                                                                                                                       n

                                                                                                                                 es
                           hin

                                                                  ad

                                                                                               ica

                                                                                                                     ua
                                      er

                                              ite

                                                         he

                                                                        De

                                                                                  rlin

                                                                                                                             rlin
                                                                                                         aii
                                    st

                                            Un

                                                                                                                   ch
                                                                an

                                                                                             er
                         rC

                                                       ut

                                                                                                        w
                                  Ea

                                                                                Ai

                                                                                                                           Ai
                                                                                           Am

                                                                                                                 Si
                                                              rC

                                                                                                      Ha
                                                     So
                       Ai

                                                                               n

                                                                                                                        en
                                ina

                                                                            ina
                                                            Ai
                                                ina

                                                                                                                      am
                              Ch

                                                                          Ha
                                              Ch

                                                                                                                    Xi

                                schedules analyser
     Source:

10   © 2016 OAG Aviation Worldwide Limited. All rights reserved
Chinese carriers overtook the North American carrier capacity share in 2015 when
in a single year the Chinese carriers added over half a million seats and took their
share of overall North America-China capacity to 52%. In the last year alone this
has grown even more, with Chinese carriers now accounting for 57% of seats and
0.8m new seats.
As with Europe, Air China also has the largest share of capacity in this market,
operating aircraft that carry 20% of seats on all China-North American markets. It
has added six new routes in the last four years, increasing the routes they serve
from four to ten and expanding beyond the West Coast cities of Los Angeles,
San Francisco and Vancouver. New services include Beijing to Houston, Newark,
Washington, Montreal and San Jose.
China Eastern has also been in expansion mode. The total number of routes it
operated grew from four in 2011 to nine in 2016. Whilst mostly operating from
Shanghai to the West Coast of the United States, in recent years it has added
routes from Nanking and Qingdao.
Hainan Airlines has seen the greatest change. Having operated just two North
American routes five years ago, in 2016 it operates nine, with six of these
commencing operations in the last three years. Recent new routes include
Changsha to Los Angeles and Beijing to Calgary.
Despite a slower growth rate, North American carriers have been adding routes to
China. In 2011, United Airlines operated six routes, whilst in 2016 it operates 11.
Its strategy appears to be to operate from a US city to both Beijing and Shanghai
which it now does from San Francisco, Chicago and Newark. More recently it has
launched new routes from San Francisco to Hangzhou and Xian.
Meanwhile, Delta Air Lines operates just five routes to China, all to either Shanghai
or Beijing. Recent routes include Los Angeles and Seattle to Shanghai. American
Airlines also has a smaller number of routes with five, also all to either Shanghai or
Beijing.
So it’s clear that growth to Chinese cities other than Beijing and Shanghai from
North American cities is mostly being driven by Chinese carriers, which also seem
keen to develop air services beyond the primary North American West Coast
airports.
11China reaches out: shifting the balance
Southwest Pacific
The China to Southwest Pacific market is dominated by China’s major airlines.
Between them, three Chinese carriers - China Southern, China Eastern and
Air China - operate 77% of capacity. The six Chinese airlines that operate to
Southwest Pacific collectively have an 88% share of capacity in this market,
having steadily increased from 82% in 2011.
CHINA – SOUTHWEST PACIFIC CAPACITY BY
CARRIER ORIGIN
CHINA – SOUTHWEST PACIFIC 2016 CAPACITY
SHARE BY TOP 10 CARRIERS
12 © 2016 OAG Aviation Worldwide Limited. All rights reservedCHINA-SOUTHWEST PACIFIC NEW ROUTES SINCE 2011
schedules analyser
Source:
Chinese carriers have averaged annual growth of 17% since 2011 whilst others
have grown at just 5% each year.
China Southern dominates in this region with 42% of all seats. Five years ago it
operated five routes from Guangzhou to Sydney and Melbourne, whilst in 2016 it
operates seven routes in total, with five to Australia’s main cities and two routes
to New Zealand, and have more than doubled total capacity. The story for China
Eastern is similar, with two routes from Shanghai to Sydney and Melbourne in
2011 growing to seven routes in 2016, one of which is to Auckland and one to
Saipan.
Air New Zealand will operate more capacity to China in 2016 than Qantas. With
just one route between Auckland and Shanghai, Air New Zealand has significantly
increased capacity in recent years; however it has faced stiff competition from
China Eastern who now operates 44% of capacity on the route.
Qantas also operates just one route between Sydney and Shanghai, a route it has
to share with China Eastern and Air China. Qantas operates just 28% of capacity
on this route with China Eastern operating nearly half of all seats.
13China reaches out: shifting the balance
Middle East
Capacity between China and the Middle East has grown significantly in the last
five years, reaching 4.8m seats in 2016 and edging ahead of the China–Southwest
Pacific market in volume. This is a market where Chinese carriers do not
dominate. Although growing, they currently have a 17% share of capacity. Chinese
carriers have added just 200,000 seats in the last five years, compared to 1.6m
seats by Middle Eastern carriers over the same time period.
In 2016, Air China added one new service to DXB from Chongqing, taking its total
to two.
CHINA – MIDDLE EAST CAPACITY BY CARRIER ORIGIN
2.5
2.0
Other carriers
1.5
Seats (m)
1.0
0.5
Chinese carriers
0.0
2011 2012 2013 2014 2015 2016
schedules analyser
Source:
To Africa and beyond
Most of China’s international capacity operates to destinations in Asia, Europe,
North America and the Southwest Pacific, with the focus of Chinese carriers of
late being on growing capacity to these markets.
14 © 2016 OAG Aviation Worldwide Limited. All rights reservedCHINA – AFRICA CAPACITY BY CARRIER ORIGIN
0.9
0.8
0.7
African carriers
0.6
Seats (m)
0.5
0.4
0.3
0.2
0.1 Chinese carriers
0.0
2011 2012 2013 2014 2015 2016
schedules analyser
Source:
By these measures, air services between China and Africa contribute a small part
to overall Chinese international air services. Having said that, capacity to Africa
is growing at a healthy rate, averaging 27% per annum over five years but there
are still just 19 routes in 2016, with almost all routes operated by African carriers
which have 90% of capacity in this market.
Bookings data from OAG’s Traffic Analyser tells us that in the last 12 months (July
2015-June 2016). there were just over 850,000 indirect bookings between China
and Africa in addition to a further 250,000 direct bookings, making the market
size over 1m. This has grown significantly in the last five years, up from 628,000
bookings. Popular routing points for China-Africa indirect bookings include Addis
Ababa, which handles 29%, and the three main Middle Eastern airports (Dubai,
Doha and Abu Dhabi) which account for a further 36%.
There are no direct services between China and West Africa and yet there are over
300,000 indirect bookings between the two, suggesting there is more than enough
of a market to support direct international services. Over 110,000 of these indirect
bookings are between China and Nigeria. This market will be one to watch.
CHINA O&D MARKETS
Jul11-Jun12
Latin America
Jul15-Jun16
Jul11-Jun12
Africa
Jul15-Jun16
0 200,000 400,000 600,000 800,000 1,000,000 1,200,000
Indirect Non-stop
15China reaches out: shifting the balance
CHINA – AFRICA O&D BY REGION
350,000
300,000
250,000
200,000
150,000
100,000
50,000
0
Central / Western Africa North Africa Eastern Africa Southern Africa
Indirect Non-stop
CHINA – LATIN AMERICA O&D BY REGION
160,000
140,000
120,000
100,000
80,000
60,000
40,000
20,000
0
Lower South America Central America Upper South America Caribbean
Indirect Non-stop
schedules analyser
Source:
Latin America is the other region of the world where there is very little connectivity
with China. There is just one route from China to Latin America, operated by
Aeromexico from Mexico City via Tijuana to Shanghai. OAG’s Traffic Analyser data
shows that in the 12 months to June 2016 there were 309,000 bookings between
China and Latin America, with almost all of those (291,000) travelling indirectly
given the lack of direct services. Although relatively small, the market is growing
strong with 76% more bookings compared to five years ago. The biggest flow is
between China and lower South America, an area which includes Brazil, Argentina
and Chile. There were 86,000 indirect bookings between China and Brazil but with
over 10,700 miles between Beijing and Rio de Janeiro, routes like this are mostly
out of range for the aircraft in service today.
There are also considerable markets between China and Central America as well
as China and upper South America. Specifically, it appears that nearly 40,000
travellers flew indirectly between China and Mexico in the 12 months to June
2016, suggesting substantial demand for this market.
16 © 2016 OAG Aviation Worldwide Limited. All rights reservedBilateral agreements - time to
renegotiate?
Clearly market demand has been shaping the development of air service to
and from China, driven in large part by the booming Chinese outbound market.
However, the way that air services are being developed has a fair amount to do
with aviation policy and the response of carriers to those policies, especially for
Chinese carriers.
In many of China’s main markets, bilateral air service agreements have failed to
add capacity in line with market demand and so the agreements are themselves
becoming a constraint on growth as the number of operations comes close to
permitted limits. The other factor is that it appears in recent years that Chinese
carriers have caught up with overseas operators as they have begun to focus
more on international growth. There is now a greater appetite from China to
renegotiate bilateral agreements to facilitate more growth but whether this is
reciprocated is as yet unclear.
The US is one such market. Last year the US and China also discussed the need
for more capacity between their respective countries but failed to agree over
issues of slot allocation at China’s major airports despite the fact that airlines are
brushing up against the permitted capacity limits. Could we be seeing reluctance
from US carriers to enter into markets in China’s interior that they are unfamiliar
with?
In contrast, the Australia-China air service agreement has been regularly modified
to enable additional capacity. The last time was in 2015 when it allowed an
immediate increase in the seats that could be operated between Beijing, Shanghai
and Guangzhou to the major gateway cities of Sydney, Melbourne, Brisbane and
Perth, adding 26,500 seats a week, equivalent to an 18% increase. Chinese
carriers have maximised this opportunity, as is evident by their 88% share of
capacity.
The UK is another key market where capacity could grow and new air service
discussions are due to commence in October, with greater access to London
Heathrow likely to be top of the wish-list for Chinese carriers.
While the ability to add capacity where it is needed is one aspect of policy, the
de facto policy of the Chinese to have only one airline operating each route is
contributing to the pattern of air service development described above. Chinese
carriers appear to be in a rush to claim routes as theirs, effectively excluding their
Chinese competitors from operations. Hence, the trend for Chinese carriers to
add capacity on new routes to a much greater extent than other airlines which are
typically consolidating capacity on routes they already operate.
Equally, this explains the way carriers such as Hainan Airlines has developed
services to and from secondary airports as a consequence of being shut out of the
primary markets already operated by the three major Chinese carriers. However,
given the strength of market demand and clear strategic thinking, this is not
necessarily a problem.
Looking at how Hainan Airlines has approached the China-US market, the carrier
started operating to the US in 2008 and until 2013 just operated one route. This
was PEK-SEA which began as a four-per-week operation but was increased to a
daily service in 2012. With the exception of 2014, where it dropped to 5 times per
week, PEK-SEA has remained a daily service.
17China reaches out: shifting the balance
HAINAN AIRLINES CHINA–US ROUTE EVOLUTION
40
35
30
Flights per week
25
20
15
10
5
0
2011 2012 2013 2014 2015 2016
PEK-SEA PEK-BOS PEK-ORD PEK-SJC PVG-SEA PVG-BOS CSX-LAX
Hainan’s expansion of US services began in late 2013 but really took off in 2015
when it added two B787s to its existing fleet of 8 Dreamliners, allowing it to add
three new routes in a single year, thus increasing the frequency on its 2014 new
routes to daily services. The routes they operate are not the largest US-China
routes, but include somewhat smaller markets at one end or the other of each
route – such as Boston and San Jose in the US and Changsha in China. Hainan
has grown its services to the point where it now operates to SEA, BOS and
ORD on a daily basis, and a lower frequency to its newer routes. If it follows this
pattern, these newer routes seem likely to become daily services in a year or two.
Where next for the Chinese
big four?
In this final section we consider where next on the international stage for China’s
biggest carriers, Air China, China Southern, China Eastern and Hainan Airlines.
With 120 wide body aircraft on order between them coming into their fleets in the
next five years, there is considerable room to grow. Most of the aircraft on order
are B787’s (54) and A350-XWBs (45) which offer a range of around 9,000 miles,
allowing them to continue to pursue better international connectivity.
18 © 2016 OAG Aviation Worldwide Limited. All rights reservedChina Eastern
CHINA EASTERN NEW INTERNATIONAL ROUTES SINCE 2011
schedules analyser
Source:
China’s second largest carrier, China Eastern, operates the largest individual share
of international capacity to and from China with 12% of seats. This is undoubtedly
due to the geographic position of its main base in Shanghai which affords it a
massive home market and a perfect position to reach much of Asia. That may
be why, with 80% of its international network serving Asia, China Eastern has
perhaps been the slowest of the majors to look beyond Asia for opportunities.
There are signs that this is shifting; the Asian share of overall China Eastern
capacity has fallen from 85% in 2011 and the last few years have seen new
destinations served in North America and Australasia. Points beyond the
primary US West Coast airports and Chinese hubs have been introduced, such
as Shanghai to Toronto, Shanghai to Chicago and Nanjing to Los Angeles.
Destinations served in Australia have increased from two in 2011 to seven today.
China Eastern has a smaller wide body fleet than the two other majors, with 60
aircraft, but does have a further 40 (a mix of 787’s and A350’s) on order.
The airline is also pursuing growth in Europe with new routes to Amsterdam,
Madrid, Prague and St Petersburg commencing in 2016 from Shanghai. China
Eastern, a member of the Skyteam Alliance, is also developing a relationship
with British Airways which may be a sign of things to come for China Eastern in
pursuing better connectivity with Europe.
19China reaches out: shifting the balance
Air China
With 11% of China’s international capacity, Air China has made considerable
inroads into Europe and the US in the last five years. Air China has the largest
wide body fleet of the Chinese majors, with 93 aircraft, over half of which are
A330s. It also has a considerable order book, with 39 aircraft across a range of
B787s, A330s and A350s due to join its fleet in the coming years.
AIR CHINA NEW INTERNATIONAL ROUTES SINCE 2011
schedules analyser
Source:
Although Asia still receives the greatest share of Air China’s international capacity,
the carrier has been growing capacity to other regions much faster. European
growth has centred on serving not only European capital cities but also secondary
destinations, including Milan, Munich, Dusseldorf and Minsk, from the carrier’s
home base of Beijing. 2016 has also seen European services launch from
Chengdu and Shenzhen, reflecting the carrier’s strategy to broaden its reach
beyond Beijing into Southern China. Its strategic partnership with Shenzhen
Airlines is part of that approach.
Air China has also announced plans to launch a Chengdu-Sydney service this
winter and is expected to announce a Shenzhen-Melbourne service soon. This
will take its Australian route network to seven services, and it would be expected
that there will be more to come to link up these Chinese cities with the rest of
Australia if these routes succeed.
In the North American market, the focus has been more on East and West Coast
US cities from Beijing, with 10 routes now operating. 2016 saw the launch of a
Shanghai- San Jose service which may reflect a willingness to pursue new US
routes beyond Beijing and its already established US bases.
20 © 2016 OAG Aviation Worldwide Limited. All rights reservedChina Southern Airlines
Capacity on China Southern flights makes up 10% of all Chinese international
seats this year. The airline has 77 aircraft which can operate long-haul routes,
predominantly A330s but also B777 and B787 aircraft. There are also a further 13
A330 on order.
One of the primary international route development strategies has been its reach
into Australia and New Zealand, aided by the fairly liberal approach to air service
development in Australia.
CHINA SOUTHERN NEW INTERNATIONAL ROUTES SINCE 2011
schedules analyser
Source:
The Canton hub (Guangzhou – CAN) has been the focus for this with its handy
position as a transfer point for leisure tourism flows from China to the South
West Pacific. CAN-SYD and CAN-MEL are the carriers’ second and fourth largest
international routes for capacity.
With several of China Southern’s SkyTeam partners based in Europe, it would be
logical for the airline to look to expand services to Europe next. With aspirations to
create an international transfer hub at Guangzhou, there is even potential to create
an alternate hub for long haul Europe-South West Pacific traffic. However, with
China outbound travel the primary driver of growth, it is more likely that CAN will
be used to channel traffic to and from China itself.
21China reaches out: shifting the balance
Hainan Airlines
The rapid growth of Hainan Airlines, especially into North America, demonstrates
that there is room for ambitious private airlines in China and that aviation policy
need be no deterrent to expansion for a strategically savvy airline.
HAINAN AIRLINES NEW INTERNATIONAL ROUTES SINCE 2011
schedules analyser
Source:
As a relative newcomer to the Chinese market Hainan Airlines is establishing
itself as the fourth major player in the Chinese market. It may only operate 2% of
international seats to and from China, but orders for 28 B787 aircraft are a potent
sign of its future plans, as this will triple the size of its long-haul fleet.
The carrier has made its mark on what might have been considered secondary
routes, with PEK-SEA, BOS-PEK, PEK-YYZ and BRU-PEK the largest international
of the 37 international routes it operates this year. A new addition will be the
Beijing-Las Vegas route due to start at the end of the year. It is not clear what
other secondary markets in North America offer scope for services by Hainan
and it may be that, for the moment at least, there are a few other unserved
opportunities.
A look at schedule data over five years shows that market entry in secondary
markets may not have been plain sailing for Hainan Airlines. Since 2011 the total
number of international routes operated has remained largely unchanged but the
airline has tried and tested a total of 79 such routes. Seven Nanning routes lasted
only a year or two, as did a number of routes from larger Chinese hubs such
as DPS-PEK and GVA-PEK. There are numerous others that Hainan no longer
operates.
While a route map for Hainan Airlines shows no services to Australia and New
Zealand, HNA subsidiary Hong Kong Airlines flies there and HNA itself has
acquired a stake in Virgin Australia and has plans to serve Beijing from Australia.
This demonstrates that any analysis of Hainan Airlines needs to take into
consideration the wider group strategy.
22 © 2016 OAG Aviation Worldwide Limited. All rights reservedThis is just the beginning
What emerges from the detailed look at Chinese international air services is a
sense that the Chinese carriers have only just scratched the surface of what is
possible. There are 27 cities in China with a population in excess of 3 million; four
of them still have no international air services.
The strength of Chinese carriers lies in the sheer scale of the domestic market
and the desire to venture beyond borders, the local market knowledge and the
significant fleet orders.
The political landscape has clearly played its part in shaping recent development
and the ‘one airline, one route’ strategy has made a land grab inevitable, but it
can’t be long before the inherent constraints will leave the major Chinese players
asking for more.
There can surely be no doubt that where US major players dominated the
early years of aviation, and European and Middle East carriers have moulded
international expansion, the future of aviation will be carved out by these large
Chinese airlines.
23For more information, visit www.oag.com
or email us on contactus@oag.com
Europe, Middle East China
& Africa #3710B Jingguang Building
1 Capability Green Hujialou Chaoyang District
Luton Beijing China 100020
Bedfordshire
T: +86 10 5095 5960
LU1 3LU
United Kingdom
T: +44 1582 695050 Japan
#701 Cross Office,
1-18-6 Nishi Shinbashi
North & South America 105-0003, Minato-ku
801 Warrenville Rd Tokyo, Japan
Suite 55
T: +813 6402 7301
Lisle
IL, 60532
USA
T: +1 800 342 5624
Usage and attribution
Asia This information can be reproduced in whole or in part, online or in
6 Shenton Way Tower 2 print, for non-commercial purposes only and must include attribution to
OAG and a link to www.oag.com.
#24-08A, Singapore 068809
T: +65 6395 5888 Disclaimer
The intended recipient (“The Customer”) acknowledges that all the data
provided by or available through OAG is owned either by OAG Aviation
Worldwide Ltd or by a third party provider (“The Owners”) and that the
customer shall not acquire any ownership or interest in such data.
OAG data is solely for the benefit and purposes of the intended
recipient and may not be disclosed to, used by or copied by anyone
other than the intended recipient. OAG Aviation Worldwide Ltd has
used reasonable efforts in collecting and preparing data in the report
but cannot and does not warrant that the information contained
in this is report is complete or accurate, OAG Aviation Worldwide
Ltd hereby disclaims liability to any person for any loss or damage
caused by errors or omissions on the report.
© 2016 OAG Aviation Worldwide Limited.
All rights reservedYou can also read