Real Estate Absorption Study For Cogswell Lands, Halifax Regional Municipality, Nova Scotia - Urban Development Institute of Nova Scotia
←
→
Page content transcription
If your browser does not render page correctly, please read the page content below
Real Estate Absorption Study
For Cogswell Lands, Halifax Regional
Municipality, Nova Scotia

                                           TURNER DRAKE
                                           & PARTNERS LTD.
                             Real Estate Counsellors, Brokers and Valuers
                                6182 North St. Halifax, N.S. B3K 1P5
                                         Tel.: (902) 429-1811
                                           St. John’s N.L.
                                         Tel. (709) 722-1811
                                         Charlottetown, P.E.
                                         Tel. (902) 368-1811
                                          Saint John, N.B.
                                         Tel. (506) 634-1811
                                            Toronto, ON.
                                           (416) 504-1811
                                         Fax: 1-902-429-1891
                                   Internet: www.turnerkdrake.com
                                    E-Mail: tdp@turnerdrake.com
REAL ESTATE ABSORPTION STUDY OF

                                   HALIFAX REGIONAL MUNICIPALITY
                                            NOVA SCOTIA

                                              FOCUSSED ON

                                   COGSWELL INTERCHANGE LANDS

                                              PREPARED FOR

                         URBAN DEVELOPMENT INSTITUTE OF NOVA SCOTIA

                                                   AS OF

                                              22ND APRIL 2016

                                                     BY

                                       ALEXANDRA BAIRD ALLEN

                                   TURNER DRAKE & PARTNERS LTD.
                                       HALIFAX - NOVA SCOTIA

--------------------------------------------------------------------- TURNER DRAKE & PARTNERS LTD. -----------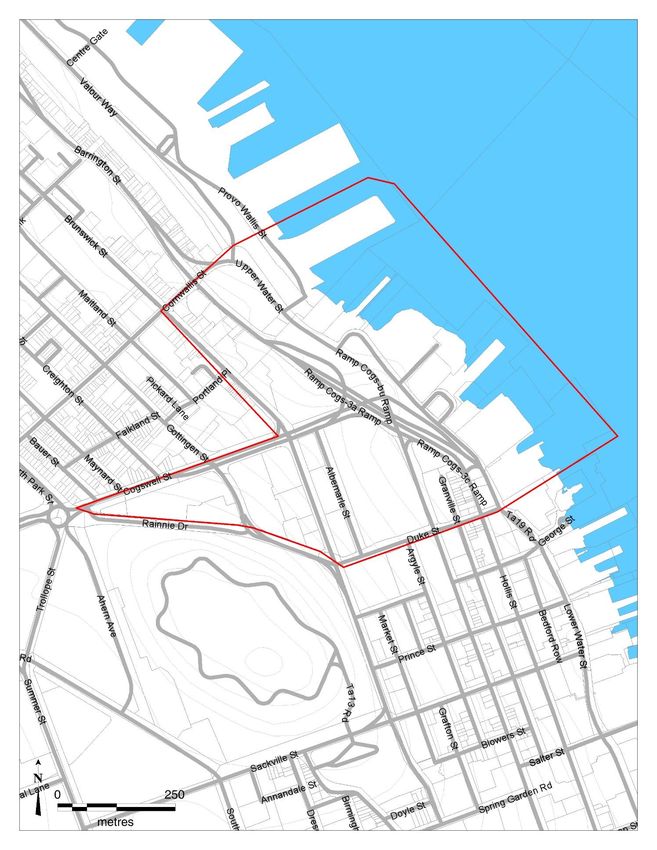
Turner drake
        & partners

     Real Estate Counsellors, Brokers & Valuers

 Registration to ISO 9001:2008             Our Ref: 1608978:NB/ABA
             Counselling Advice
                     Feasibility Studies   29 April 2016
                         Expropriation
               Mediation & Arbitration     Mr. David Graham
             Infrastructure Acquisition
                                           Director
          Valuation & Appraisal            Urban Development Institute of Nova Scotia
                          Commercial
                             Industrial
                                           2114 Gottingen Street
                           Investment      Halifax NS B3K 0C5
                         Development
                                Rural
                                           Dear Mr. Graham:
          Economic Intelligence
                     Market Surveys        Re:     Real Estate Absorption Study of Halifax Regional Municipality, Nova
                       Site Selection
                 Trade Area Analysis
                                                   Scotia
           Supply & Demand Analysis
                Demographic Studies        In accordance with your request of the 6th April 2016, we have completed a study on
                                           the above topic.
       Property Tax Consulting
       PAMS™ Property Tax Manager
                Assessment Audits          This report is intended only to be used for strategic planning purposes
                       Negotiation         and only by Urban Development Institute of Nova Scotia, our client for this assignment.
                     Appeal Board
                                           Use of the report for other purposes or by other parties may invalidate the conclusions.
      Planning (Urban & Rural)             The RICS Valuation Standards require that we prepare a new report if the client,
                  Regulatory Review
               Development Analysis
                                           intended user, date, or purpose of the assignment, is changed.
               Development Approval
                Cost Benefit Analysis      Scope of Work
   Brokerage (Sales & Leasing)
               Tenant Representation
                                           This study represents a high level analysis of historic and forecast real estate
             Landlord Representation       absorption, focussing primarily on office and residential real estate types. Having
            Purchaser Representation       regard to the high level nature of the analysis, the study area is the Halifax Regional
              Vendor Representation
                                           Municipality in its entirety, with a focus on the lands slated for redevelopment with the
Lasercad™ Space Measurement                removal of the Cogswell Interchange.
                   Space Certification
                      “As Built” Plans

      Turner Drake & Partners Ltd.         Quality Standards
                 6182 North Street,
            Halifax, N.S. B3K 1P5          Turner Drake’s quality assurance system, which covers the conduct of all of our
             Tel.: (902) 429-1811
                                           operations, is registered to the ISO 9001:2008 standard. This assignment has been
                   St. John’s, N.L.        conducted in accordance with our quality assurance system. This analysis assignment
              Tel: (709) 722-1811          also conforms to the Uniform Standards of Professional Appraisal Practice (USPAP)
               Charlottetown, P.E.         adopted by the Appraisal Standards Board of the Appraisal Foundation.
              Tel: (902) 368-1811
                   Saint John, N.B.                                                                                             …2
              Tel.: (506) 634-1811
                      Toronto, ON.
              Tel.: (416) 504-1811

              Fax.: (902) 429-1891
      E-Mail: tdp@turnerdrake.com
    Internet: www.turnerdrake.com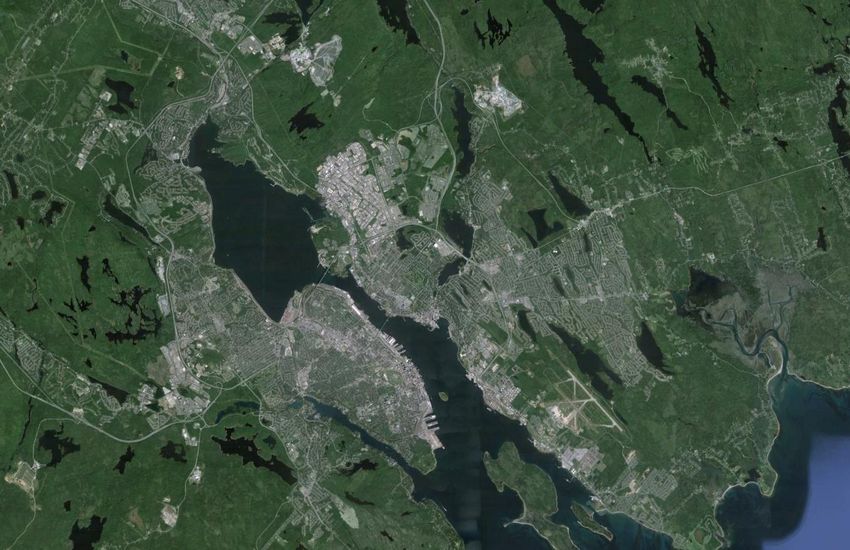
Page ii

Summary of Conclusions

    (1) Housing Market

        The results of our analysis of forecast demand and supply for residential units in Halifax Regional
        Municipality over the next ten years indicate the following:

                           9,005 surplus in demand for new rental units
                         - 1,871 shortfall in demand for new owner occupied units
                           7,134 surplus demand for total new units

    (2) Office Market

        The following table shows the forecast supply, demand and subsequent vacancy rate for office space
        over the projection period:

                                                             Projected
                        Projection         Total             Total          Vacancy
                          Period        Supply (ft²)      Demand (ft²)       Rate
                        + 10 Years      11,980,463        9,926,569         17.14%
                        + 9 Years       11,980,463        9,913,189         17.26%
                        + 8 Years       11,980,463        9,899,820         17.37%
                        + 7 Years       11,980,463        9,886,473         17.48%
                        + 6 Years       11,980,463        9,873,147         17.59%
                        + 5 Years       11,980,463        9,859,832         17.70%
                        + 4 Years       11,980,463        9,846,539         17.81%
                        + 3 Years       11,980,463        9,833,267         17.92%
                        + 2 Years       11,927,968        9,820,006         17.67%
                        + 1 Year        11,740,482        9,807,649         16.46%
                        Current         11,632,983        9,791,783         15.83%

(3) Commercial Space

The following models the amount of commercial space which would in theory serve the indicated 7,134
residential units for which surplus demand exists in HRM:

                                          Halifax Regional Municipality
                          Total residential units                         7,134
                          Commercial space (ft²)
                                   Minimum                               92,742
                                   Maximum                            6,220,848
                                   Median                               620,658
                                   Average                            1,027,296

Yours truly,

TURNER DRAKE & PARTNERS LTD.

ALEXANDRA BAIRD ALLEN
Senior Manager
Economic Intelligence Unit

--------------------------------------------------------------------- TURNER DRAKE & PARTNERS LTD. -----------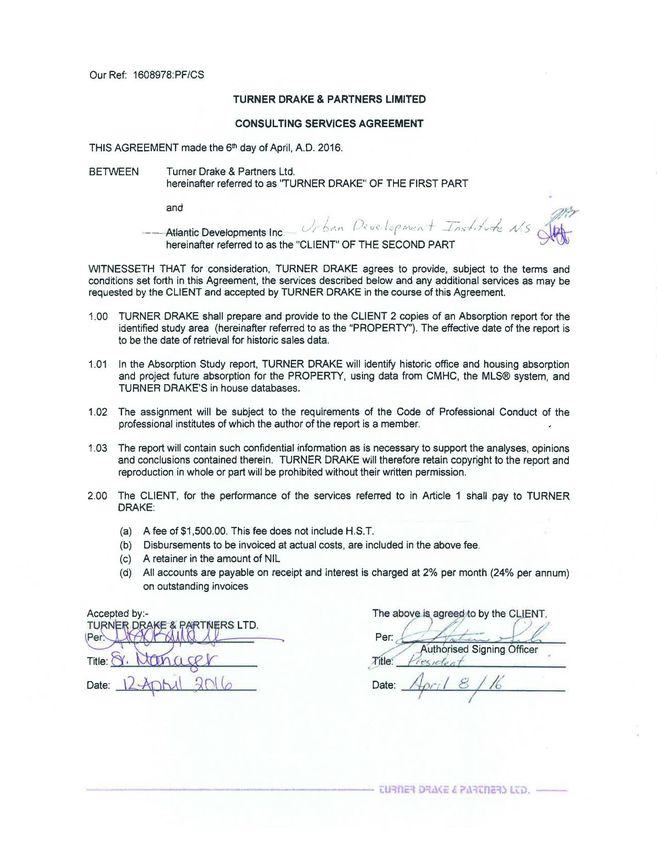
Page iii

TABLE OF CONTENTS
                                                                                                     Page
Part One (Introduction)

       Letter of Transmittal                                                                              i
       Table of Contents                                                                                iii
       Frontispiece                                                                                     iv
       Statement of Limiting Conditions and Assumptions                                                  v

Part Two (Factual Data)

       Purpose of Report                                                                                1
       Intended Use of Report                                                                           1
       Intended Users of Report                                                                         1
       Effective Date of Analysis                                                                       1
       Date of Inspection                                                                               1
       Identification of Property                                                                       1
       Definitions of Terms                                                                             2
       Location Map                                                                                     5
       Area Data                                                                                        6
       Neighbourhood Data                                                                               7
       Site:        Plan                                                                                8
                    Data                                                                                9
       Zoning                                                                                          10

Part Three (Analysis and Conclusion)

       Absorption Study Methodology                                                                    11
                             Scope                                                                     11
                             Methodology                                                               11
       Demographic and Economic Trends and Projections
          Influencing the Halifax Real Estate Market to 2025                                           12
                             Introduction                                                              12
                             Demographic Profile                                                       13
                             Population Profile                                                        17
                             Population and Demographic Projections                                    17
       Halifax Real Estate Market Demand and Absorption Forecast                                       20
                             Residential Market                                                        20
                             Residential Building Inventory Map                                        23
                             Commercial Space Demand                                                   30
                                   Office Market                                                       30
                                   Supporting Commercial Space                                         33
       Certification                                                                                   35

Part Four (Addenda)

       Consultants’ Resumes                                                                            36
       Consulting Service Agreement                                                                    41

--------------------------------------------------------------------- TURNER DRAKE & PARTNERS LTD. -----------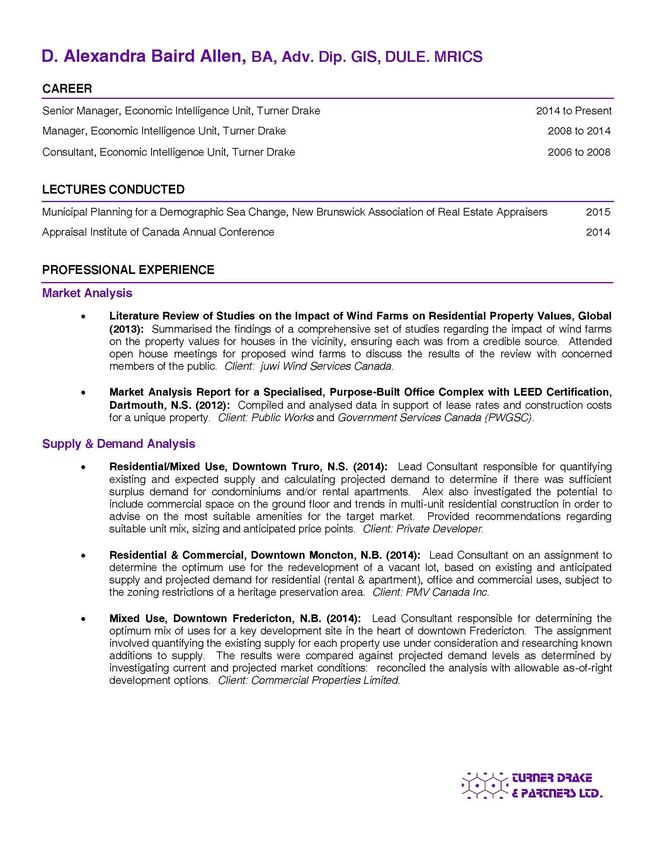
Page iv

                           HALIFAX REGIONAL MUNICIPALITY METRO AREA

--------------------------------------------------------------------- TURNER DRAKE & PARTNERS LTD. -----------
Page v

                                LIMITING CONDITIONS AND ASSUMPTIONS

(1)   This report must be used in its entirety since parts taken out of context may be misleading. The report,
      or any parts thereof, may not be used for any purpose other than that for which it was undertaken and
      is furnished for the exclusive use of the client to whom the report is addressed. All liability to any party
      other than the client is hereby denied.

(2)   The purpose of this Absorption Study is to quantify the historic and forecast absorption of office and
      residential real estate for Halifax Regional Municipality, having regard to the memorandum written by
      Ken Greenberg entitled “Review of Current Plans for the Cogswell Interchange,” provided to us by Mr.
      Greenberg with authorisation from Urban Development Institute of Nova Scotia. We have made no
      independent investigation of the physical, fiscal, legal or other constraints pertaining to the Cogswell
      Interchange lands and accordingly do not warrant that type, density, quantum, or unit mix of development
      discussed in this report is physically, fiscally or legally possible. The reader is urged to make their own
      investigations in that regard.

(3)   We do not purport to give legal advice and have assumed that:

      (a) Any legal description furnished to us is accurate and up to date;
      (b) Title to the property is good and marketable;
      (c) There are no encroachments, encumbrances, restrictions, liens, legal or special assessments,
          leases or covenants that would in any way affect this Absorption Study, except as expressly noted
          herein;
      (d) The existing use, or proposed use of the property as envisioned in our Absorption Study, is a legally
          conforming use which may be continued by the existing owner or by any party purchasing the
          property from the existing owner;
      (e) Any rights-of-way, easements or encroachments over other real property and leases or other
          covenants as may be noted in this report are legally enforceable.

      Because these assumptions have been made, no investigation, legal or otherwise, has been undertaken
      which would verify these assumptions except as expressly noted herein.

(4)   Unless otherwise noted in this report, existing mortgages, liens, encumbrances and special
      assessments, if any, have been disregarded and the land has been treated as though free and clear.

(5)   We are not qualified surveyors. Any sketches, drawings, diagrams, plans and photographs are
      presented in this report to assist the reader in better visualising the property and are not to be relied
      upon in themselves.

(6)   Unless otherwise expressly indicated in this report, we have not been provided with, nor have we
      authorised, any tests to ascertain the physical condition of the structures on the property, or the surface
      or sub-surface conditions of the land. We are not qualified to give engineering advice. It has been
      assumed that there are no hidden or apparent conditions of the land, sub-soil or structures that would
      render it more or less suitable for the uses envisaged by our Absorption Study. No responsibility is
      assumed for such conditions or for engineering studies that might be required to discover these factors.

(7)   We have not inspected any buildings on the land and are therefore unable to report that such parts of
      the property are free of rot, beetle or other defects.

(8)   This Absorption Study is based on the assumption that there is an adequate supply of potable water to
      the property at all times. We have not undertaken any tests ourselves and make no warranty therewith.

(9)   This Absorption Study is based on the assumption that there is a fully functioning sewage disposal
      system. We have not undertaken any tests ourselves and make no warranty therewith.

--------------------------------------------------------------------- TURNER DRAKE & PARTNERS LTD. -----------
Page vi

(10) Unless otherwise noted in this report, the existence of hazardous substances, including without limitation
     asbestos, polychlorinated biphenyls, petroleum leakage, agricultural chemicals, radon gas, urea-
     formaldehyde foam insulation, or other potentially hazardous substances, which may or may not be
     present on the property, or molds, mildews and other environmental conditions, were not called to our
     attention nor did we become aware of them during our inspection. We are not qualified to detect such
     substances or conditions and the client is urged to retain an expert in this field, if desired. The presence
     of such hazardous substances or environmental conditions on, or in the proximity to the property may
     affect the use of the property. Whilst we have predicated this Absorption Study on the assumption that
     the land does not, and never has, contained such hazardous substances or environmental conditions,
     and is not in such proximity to another contaminated property as to prevent, or restrict, the type of
     development recommended by this report, we do not warrant that this is the case and accept no liability
     in this regard.

(11) No investigation has been undertaken with the local zoning office, the fire department, the building
     inspector, the health department or any other government environmental or regulatory agency unless
     such investigations are expressly represented to have been made in this report. Any use of the land
     must comply with such government regulations. Any person relying on this report is cautioned that, to
     be certain of compliance, further investigation may be necessary.

(12) Such information used in this report including, but not limited to, sale prices, rental values and other facts
     and details regarding comparable properties used in our analysis that may have been obtained from the
     Registry of Deeds, Land Information Service, Assessment Department, Canada Mortgage and Housing
     Corporation, Statistics Canada and the local Real Estate Boards, etc., is assumed to be reliable. As well
     as using such documented and generally reliable evidence of market transactions, it was also necessary
     to rely on hearsay evidence. Except as noted herein, a reasonable attempt has been made to verify all
     such information.

(13) Information in this report furnished by others is believed to be reliable, although no responsibility is
     assumed for its accuracy. Some of the information on which we have based our report has been
     supplied to us by the owner, or the owner's representative. Based on our review, nothing has come to
     our attention that causes us to believe that this information is not, in all material respects, correct.
     However, we have not verified the information through independent enquiry and this engagement cannot
     be relied upon to prevent or detect fraud or error. The responsibility for the prevention and detection of
     fraud and error and other irregularities remains with the person relying on this report.

(14) Market conditions can, and do, change rapidly because of economic, social and political reasons. The
     opinions expressed in this report pertain only to the date of the assignment and must not be relied on as
     of any other date.

(15) We have assumed that market conditions will continue to follow the trends and patterns observed over
     the past ten years, except as noted within this report. As well, we have assumed that any planning policy
     (including zoning) and regulatory changes necessary to allow the inventory of real estate for absorption
     to be developed as forecast will be achieved. Whilst the foregoing are probably correct based on the
     information available to us, they do require further investigation which is beyond the scope of this
     assignment. If our assumptions are incorrect, it could alter our opinion and conclusions.

(16) Turner Drake & Partners Ltd. retain the copyright to this report. Reproduction in whole or in part is
     prohibited without their written permission and is a contravention of the Copyright Act.

--------------------------------------------------------------------- TURNER DRAKE & PARTNERS LTD. -----------
Page 1

                                                   PURPOSE OF REPORT

PURPOSE OF ABSORPTION STUDY                                   -         To provide historic and forecast absorption figures
                                                                        for office and residential real estate in Halifax
                                                                        Regional Municipality, and narrative on other
                                                                        support land uses.

INTENDED USE                                                  -         This report is intended only to be used for analysis
                                                                        purposes. The report is not intended to be utilised
                                                                        for any other purpose.

                                                                        In view of the purpose and intended use of the
                                                                        valuation, this report conforms to the Royal
                                                                        Institution of Chartered Surveyors’ Valuation
                                                                        Standards [2014 Edition] (RICS Red Book), the
                                                                        International Valuation Standards (IVS), the
                                                                        Uniform Standards of Professional Appraisal
                                                                        Practice (USPAP) 1[Self Contained Report], and
                                                                        the Canadian Uniform Standards of Professional
                                                                        Appraisal Practice.

INTENDED USERS                                                -         This report is intended for use only by Urban
                                                                        Development Institute of Nova Scotia, our client for
                                                                        this assignment. This report is not intended to be
                                                                        utilised by any other party.

EFFECTIVE DATE OF ANALYSIS                                    -         22nd April 2016.

DATE OF INSPECTION                                            -         Not inspected.

IDENTIFICATION OF PROPERTY                                    -         Halifax Regional Municipality, Nova Scotia.

1
        A Self Contained Report describes all of the information significant to the solution of the appraisal problem.

--------------------------------------------------------------------- TURNER DRAKE & PARTNERS LTD. -----------
Page 2

DEFINITION OF TERMS

The following definitions may be used in this report:

ANCHOR TENANTS                    -     The major chain(s) or department store(s) in a shopping centre, which
                                        are positioned to produce traffic for the smaller stores in the facility.

APARTMENT BUILDING
CLASS                             -     This is the industry definition common to this particular marketplace.

                 Class A          -     These buildings are typically less than ten years old or, if older, are
                                        built to luxury standards and periodically renovated. They have
                                        modern kitchens, expansive closet space, efficient HVAC systems,
                                        ample parking and security features.

                 Class B          -     These buildings are typically more than ten years old but are well
                                        maintained. The units may be smaller than Class A apartments and
                                        lack certain unit or project amenities.

                 Class C          -     These buildings are typically more than thirty years old. They include
                                        small walk-up buildings that lack air conditioning and off-street
                                        parking.

BROAD MARKET AREA                 -     The geographic region from which 80% or more, of the demand and
                                        competitive supply is drawn.

CAPTURE RATE                      -     The percentage of total demand in a Target Market that the project is
                                        expected to capture.

CONDOMINIUM                       -     A form of joint ownership and control of property in which specified
                                        volumes of air space (for example, apartments) are owned
                                        individually while the common elements of the building (for example,
                                        outside walls) are jointly owned by the Condominium Corporation.

DEMOGRAPHICS                      -     Information on population characteristics by location, including such
                                        aspects as age, employment, earnings and expenditures.

ECONOMIC DRIVER                   -     Industry that stimulates growth and creates spin-off jobs in the region.
                                        Economic drivers are sometimes called export industries because
                                        their products or services are exported beyond the local region.

GROSS LEASABLE
AREA (GLA)                        -     Used to determine the rentable area in shopping centres. It is the
                                        total floor area designed for the occupancy and exclusive use of the
                                        tenant, including basements and mezzanines, measured from the
                                        centre of all interior walls separating tenant spaces, and to the exterior
                                        face of all exterior walls.

INFLOW                            -     Demand / Retail spending from outside the Primary Trade Area.

LEAKAGE                           -     Demand / Retail spending that is unsatisfied by existing supply and
                                        escapes to projects outside the Primary Trade Area.

LEASE-UP PERIOD                   -     The period which starts with the marketing of the space to be leased,
                                        and ends when all of the space in the building is leased.

----------- TURNER DRAKE & PARTNERS LTD. --------------------------------------------------------------------
Page 3
LOCATION QUOTIENT - The ratio between two other ratios. In this report it is used to identify
industry groups that drive the local economy. The percentage of the
workforce employed in each major industry group locally is divided by
the percentage of the workforce employed in the industry group
nationally. If the value of the Location Quotient is greater than 1.0,
the industry group is considered to be one that drives the local
economy.
MARKET ABSORPTION - The amount of real estate that will be leased or sold in a given time
period.
MARKET PENETRATION - The ability of a specific development to capture its percentage of
demand in the Primary Trade Area.
i.e. MPF = # Units Expected to be Sold in Project x 100
# Units Available for Sale in Project
NET ABSOLUTE RENT - The rent paid for the use of the rental space excluding Realty or
Business Occupancy Taxes, Common Area Maintenance (CAM)
charges, or any other services such as Electricity, Cleaning or
Heating. It is often referred to as “AAA” or “Base Rent”.
NET ABSORPTION - The change in the amount of occupied inventory over a specified
period of time, including the addition or deletion of building stock
during that period of time.
OFFICE BUILDING
CLASS: - This is the industry definition common to this particular marketplace.
Class A - These office buildings command the highest rents, have “presence”
by virtue of their distinctive design and lobbies, are air-conditioned
and sprinklered. They are regarded as “prestige” buildings. They
typically include the leading firms of lawyers and accountants,
together with regional or head offices for banks, financial institutions
and other major companies, as their tenants.
Class B - These are “second tier” office buildings in terms of rents. They are
usually older than Class A buildings and lack “presence”. They are
air-conditioned and are usually sprinklered. They are regarded as
offering modern, but not “prestige” office accommodation in their
marketplace. Typically they were built over 20 years ago. Tenants
usually include second tier firms of lawyers and accountants, together
with a wide selection of private sector companies, provincial and local
government agencies.
Class C - These include all office buildings not classed as “A” or “B”.
PSYCHOGRAPHICS - Information on a group’s lifestyle that goes beyond demographics and
includes more psychological aspects such as interests and levels of
aspiration.
PRIMARY TRADE AREA - The geographic area from which 60% to 80% of the demand and
competitive supply is drawn.
--------------------------------------------------------------------- TURNER DRAKE & PARTNERS LTD. -----------Page 4
RENTABLE AREA - Used to determine the amount of space on which rent is based in
office buildings and industrial premises. It is computed in accordance
with the relevant BOMA (Building Owners and Managers Association)
standard.
SECONDARY TRADE AREA - The geographic area from which the balance of demand and
competitive supply is drawn. It is the Broad Market Area excluding
the Primary Trade Area.
SEGMENTATION - The classification of a population group into segments for the purpose
of identifying marketing sub-groups.
SELL-OUT PERIOD - The period which starts with the marketing of the space to be sold,
and ends when all of the space in the building is sold.
SIGNATURE PROPERTY - A property recognised as being the benchmark by which others are
measured in its metropolitan area. It commands the highest rents or
capital value per square foot and attracts the most prestigious
occupiers.
TARGET MARKET - The target market for a given project is the user group that is (1)
favourably disposed to the project’s location, and (2) earns an
adequate income to utilise the project. It is the sector of the population
most likely to utilise the project, in terms of their demographic or
psychographic profile.
----------- TURNER DRAKE & PARTNERS LTD. --------------------------------------------------------------------Page 5
LOCATION MAP
--------------------------------------------------------------------- TURNER DRAKE & PARTNERS LTD. -----------Page 6
AREA AND NEIGHBOURHOOD DATA
Area Data
The Greater Halifax Area encompasses the three former municipalities of Bedford, Dartmouth and Halifax,
and all of the former County of Halifax. It is the urban heart of the Halifax Regional Municipality (HRM) which
was spawned by the amalgamation of the four municipalities in 1996. The 2011 census recorded a total
population for HRM of 390,398 primarily located in an urban area covering 283 square kilometres. Halifax is
the provincial capital and the largest city in Atlantic Canada. It is the Atlantic Region’s financial and business
centre, the Canadian Navy’s East Coast base, and the location of many federal government offices and other
facilities. HRM hosts six universities and as a result is home to a large concentration of educational, medical
and research facilities.
HRM benefits from excellent air, rail, road and water linkages. Halifax International Airport links the region
with the remainder of Canada, and the world. The airport is the busiest airport in Atlantic Canada, handling
in excess of 3,600,000 passengers and 80,000 flights per year. In December 2004, the airport was granted
United States “pre-clearance” status, allowing travellers to clear US customs in Halifax. A $28-million project
to lengthen the main runway was completed in the fall of 2013. HRM is also well served by its highway
network, which connects the area with the remainder of Atlantic Canada and the Northeastern U.S. Rail
services to HRM provide a linkage with Central Canada and the Midwest U.S. The Port of Halifax is the focal
point of the region’s transportation network, handling 3.8 million metric tonnes of cargo in 2014. In 2015,
222,309 passengers on 141 cruise ships visited HRM through the Port of Halifax, up 2.3% from 2014. In
October 2011, HRM’s Irving Shipbuilding was selected for a potential $25-billion worth of contracts from the
federal government to build 21 arctic/offshore patrol ships; it is anticipated that this will create approximately
4,000 jobs in the province. To accommodate this project, Halifax Shipyard is undergoing a significant
modernisation, with a total planned investment of $330 million, much of which has already been spent.
Construction of the first Arctic Offshore Patrol Ship commenced in September 2015.
The breakdown of employment in HRM by sector is as follows:
Management 11%
Business, Finance & Administration 20%
Natural & Applied Sciences & Related 7%
Health 7%
Social Sciences, Government Services & Religion 5%
Education 5%
Arts, Culture, Recreation & Sport 4%
Sales & Service 26%
Trades, Transport & Equipment Operations 12%
Primary Industries 1%
Processing, Manufacturing & Utilities 2%
----------- TURNER DRAKE & PARTNERS LTD. --------------------------------------------------------------------Page 7
Overall Construction Activity
The following figures on construction activity, as evidenced by the number and value of building
permits, were provided to us by Halifax Regional Municipality:
2010 2011 2012 2013 2014
(a) Total Construction
Values (in $ millions)
- Residential $ 489.418 $ 513.144 $ 583.794 $ 409.307 $ 440.982
- Commercial/Industrial $ 197.743 $ 229.188 $ 315.802 $ 241.069 $ 239.559
- Institutional $ 65.945 $ 38.166 $ 82.527 $ 53.465 $ 20.040
Total $ 770.469 $ 800.724 $ 992.978 $ 703.841 $ 700.581
(b) Building Permits by
Type
- Residential 2,007 2,913 3,018 2,366 2,711
- Commercial/Industrial 562 618 597 664 969
- Institutional 34 50 35 41 58
Total 2,603 4,998 4,805 3,051 3,779
With an estimated population of 406,590 (1st July 2015), the Halifax CMA has experienced an average annual
growth rate of 0.42% during the years 2010-2015. The latest unemployment rate (March 2016) is 7.2%
compared to a provincial average of 9.1% and a national rate of 7.1%. The average household income of
$83,448 (2015) is above that of other major centres in the Maritimes: Fredericton ($77,659), Moncton
($73,818), Saint John ($76,166), Charlottetown ($75,949); and below that of St. John’s ($90,688).
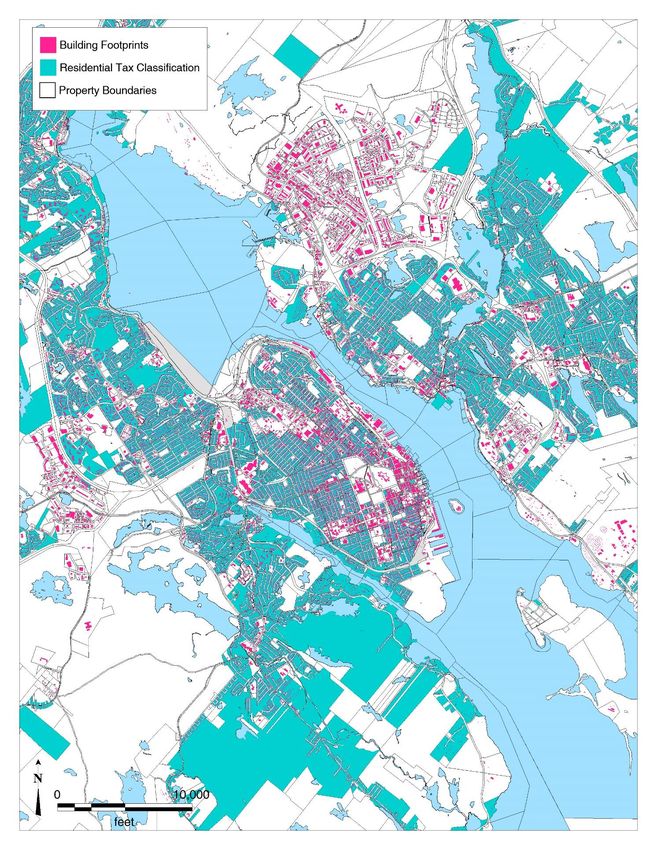
Neighbourhood Data
The neighbourhood is located between the Halifax Central Business District (CBD) and the North End of the
Halifax Peninsula. The Cogswell Interchange lands border the Halifax Citadel National Historic Site to the
west and connect as well to the Halifax Waterfront Boardwalk to the east. Current land uses include
commercial and residential uses, with high rise, high density development dominating in the CBD to the south,
and lower density residential and commercial land uses in the area to the north. Recently activity indicates a
generally improving status in the neighbourhood; the redevelopment of the Cogswell Interchange stands to
continue this trend.
--------------------------------------------------------------------- TURNER DRAKE & PARTNERS LTD. -----------Page 8
SITE PLAN
----------- TURNER DRAKE & PARTNERS LTD. --------------------------------------------------------------------Page 9
SITE DATA
The subject property is located on the east side of the Halifax Peninsula.
The general area of the redevelopment site is shown edged red on the Site Plan (preceding page). The lands
slated for redevelopment comprise approximately 6.5 hectares.
While the site is relatively flat between the north and south boundaries, between the east and west boundaries
there are steeper slopes, with an average gradient of 9.5%.
Reference
We have taken as our source, the provincial parcel boundary map layer, published by Service Nova Scotia
as well as provincially sourced elevation contours (5 metre resolution).
Services Available to the Site
Main sewer, water, natural gas, and electrical services are available to the site. As per information from the
client, upgrading is likely required.
--------------------------------------------------------------------- TURNER DRAKE & PARTNERS LTD. -----------Page 10
ZONING
The area is located primarily in the Downtown Halifax Plan Area, zoned DH-1 “Downtown Halifax Zone”.
The uses permitted under this zoning, are described below:
7(1) Commercial uses, excluding adult entertainment uses;
Cultural uses;
Institutional uses;
Marine-related uses;
Open Space uses;
Residential uses;
Transportation uses; and
Uses accessory to the foregoing.
Conclusion
The Downtown Halifax Zone is a flexible one which allows for a variety of uses.
However we have not attempted to verify that any planned building would meet all of the requirements
contained in the current Zoning By-Law, such as set-backs and building envelope constraints, etc. Formal
confirmation of full compliance should be obtained from the Municipality.
----------- TURNER DRAKE & PARTNERS LTD. --------------------------------------------------------------------Page 11
ABSORPTION STUDY METHODOLOGY
Scope
The objective of this assignment is to render an opinion as to the historic and forecast absorption for office
and residential real estate in Halifax Regional Municipality, in the context of the demolition of the Cogswell
Interchange and subsequent availability of “new” land for development. This report was commissioned to
support the memorandum written by Mr. Ken Greenberg which provided a high level assessment of the current
plans for the redevelopment of the site.
We collected and analysed data on demographic and economic trends and projections pertinent to the local
real estate market. We also identified planned and approved medium and large scale developments which
include residential components. Based on historic and current market trends, we quantified anticipated
market demand by real estate type for the overall Halifax Regional Municipality and relevant sub-markets
thereof. Our findings, analysis and conclusions are set out in this narrative report.
Methodology
It was necessary to proceed through a number of steps in order to achieve the foregoing objective. Market
Assessment is by nature often experiential, in which the output of one stage results in re-computing the input
to a prior stage so that the final results are arrived at by an iterative process: rather than by rigidly proceeding
in a mechanical fashion through a series of steps in fixed order. Thus, whilst we have described the steps
below in ordinal sequence, the reader should bear in mind that this has been done purely for administrative
convenience and readability.
(i) Demographic and Economic Trends and Projections Influencing the Halifax Real Estate
Market to 2025 – the objective of this section is to identify the key drivers of demand for real estate
in the Halifax Metro market and to provide a background overview of the characteristics that make up
the Halifax Regional Municipality.
(ii) Halifax Real Estate Market Demand and Absorption Forecast to 2025 – the objective of this
section is to summarise the current market demand for residential, office and local commercial real
estate, and to forecast the anticipated demand and absorption rates through the projection period for
Halifax Regional Municipality.
--------------------------------------------------------------------- TURNER DRAKE & PARTNERS LTD. -----------Page 12
DEMOGRAPHIC AND ECONOMIC TRENDS AND PROJECTIONS
INFLUENCING THE HALIFAX REAL ESTATE MARKET TO 2025
Introduction
This section provides an overview of key demographic and economic trends and projections influencing the
Halifax real estate market.
A 2015 National Association of Realtors® study found the following characteristics for home buyers in the
United States:
Age of Home Buyers
Median Age in
Generation Year Born: Age in 2014 Percent Group
Millennials/Gen Y/ Gen Next 1980-1995 34 or younger 32% 29
Gen X 1965-1979 35 to 49 27% 41
Younger Boomers 1955-1964 50 to 59 16% 54
Older Boomers 1946-1954 60 to 68 15% 64
Silent Generation 1925-1945 69 to 89 10% 73
Source: 2015 National Association of Realtors® Home Buyer and Seller Generational Trends
Household Income of Age of Home Buyer
Home Buyers All Buyers ≤34 35 to 49 50 to 59 60 to 68 69 to 89
< $25,000 3% 2% 2% 5% 4% 7%
$25,000 to $34,999 6% 8% 3% 4% 7% 14%
$35,000 to $44,999 7% 9% 5% 6% 8% 10%
$45,000 to $54,999 8% 9% 6% 7% 10% 10%
$55,000 to $64,999 9% 10% 7% 5% 12% 11%
$65,000 to $74,999 8% 10% 8% 7% 9% 9%
$75,000 to $84,999 8% 10% 7% 8% 9% 8%
$85,000 to $99,999 10% 11% 10% 10% 10% 10%
$100,000 to $124,999 14% 13% 17% 13% 12% 9%
$125,000 to $149,999 9% 8% 13% 9% 7% 5%
$150,000 to $174,999 5% 4% 6% 8% 3% 2%
$175,000 to $199,999 3% 3% 4% 5% 2% 1%
$200,000 + 9% 3% 14% 12% 9% 5%
Median Income (2013) $84,500 $76,900 $104,600 $96,600 $76,400 $63,600
Source: 2015 National Association of Realtors® Home Buyer and Seller Generational Trends
Age of Home Buyer
Prior Living Arrangement All Buyers ≤34 35 to 49 50 to 59 60 to 68 69 to 89
Owned previous residence 46% 22% 45% 55% 66% 80%
Rented an apartment or
house 42% 59% 45% 37% 28% 14%
Lived with parents, relatives
or friends 10% 18% 8% 7% 5% 4%
Rented the home the buyer
ultimately purchased 1% 1% 2% 2% 1% 2%
Source: 2015 National Association of Realtors® Home Buyer and Seller Generational Trends
Note: A first-time buyer may have owned a home prior to their first home purchase, e.g. via inheritance or gift. Buyers moving from rented
accommodation may have previously owned a home.
The Canadian Home Buyer Preference National Study, conducted by the Canadian Home Builders’
Association, indicates that Generation X is the largest cohort of home buyers in this country, at 46%, followed
by Generation Y/Millennials at 38%; the majority of buyers are singles or couples without children.
----------- TURNER DRAKE & PARTNERS LTD. --------------------------------------------------------------------Page 13
Household income plays a major role in the decision to purchase a home. In the lower- and middle-income
brackets, the cost of renting versus buying a home is a significant factor in the decision regarding housing
tenure, but this relationship diminishes as household incomes increase. Between 1981 and 2006, the
percentage of Canadians owning versus renting their homes increased from 62% to 69%. The increase was
not evenly distributed amongst various demographic profiles: homeownership for couples aged 20 to 39 with
children dropped from 47% to 35% for those with household incomes in the bottom quintile, while it increased
from 88% to 94% for those in the top income quintile. Family formation is another key driver in the decision
to purchase versus rent. As couples establish themselves in their careers and have children, they become
less mobile and more inclined to purchase a home rather than rent.2
Demographic Profile
The following tables provide an overview of the demographic characteristics for each of Halifax Regional
Municipality and the Metro Halifax area.
2015 Households Metro Halifax HRM
% %
2015 Households by Size 135,357 172,873
1 person 45,432 33.6% 51,323 29.7%
2 persons 49,024 36.2% 62,887 36.4%
3 persons 20,847 15.4% 28,381 16.4%
4 persons 14,389 10.6% 21,878 12.7%
5 persons 4,137 3.1% 6,197 3.6%
6+ persons 1,528 1.1% 2,207 1.3%
Persons in private households 288,562 387,696
Persons per household 2.13 2.24
Source: Environics Analytics via ArcGIS Online
2015 Families Metro Halifax HRM
% %
2015 Population Aged 15+ by Marital Status 254,931 336,934
Married, not separated 103,679 40.7% 150,713 44.7%
Living common law 27,775 10.9% 36,256 10.8%
Single, never married 84,848 33.3% 103,094 30.6%
Separated 7,626 3.0% 9,499 2.8%
Divorced 17,022 6.7% 20,422 6.1%
Widowed 13,981 5.5% 16,950 5.0%
2015 Children at Home 71,688 102,751
Aged 0 to 4 14,128 19.7% 19,920 19.4%
Aged 5 to 9 12,949 91.7% 18,809 18.3%
Aged 10 to 14 12,069 93.2% 17,828 17.4%
Aged 15 to 19 13,217 109.5% 19,144 18.6%
Aged 20 to 24 10,393 78.6% 14,825 14.4%
Aged 25 & over 8,932 85.9% 12,225 11.9%
Average children per census family (2015) 0.57 0.78
Average Persons per census family (2015) 1.44 2.15
Source: Environics Analytics via ArcGIS Online
2
Brown, W. M. and A. Lafrance. 2013. “Trends in Home Ownership by Age and Household Income: Factors Associated with the
Decision to Own, 1981 to 2006.” Statistics Canada Economic Analysis Research Paper Series. Catalogue no. 11F0027M – No. 083.
--------------------------------------------------------------------- TURNER DRAKE & PARTNERS LTD. -----------Page 14
2015 Education Metro Halifax HRM
% %
Household Population 15 & over by
Educational Attainment (2015) 330,071 432,348
No certificate, diploma, degree 33,903 10.3% 47,710 11.0%
Grade 9-13, High School 59,602 18.1% 77,499 17.9%
Apprentice/Trades, certificate/diploma 20,918 6.3% 30,689 7.1%
College, certificate/diploma 43,854 13.3% 60,233 13.9%
University, certificate/diploma, no bachelor 10,486 3.2% 13,814 3.2%
University, bachelor degree or higher 80,654 24.4% 101,202 23.4%
University bachelor degree 51,421 15.6% 65,048 15.0%
University above bachelor degree 29,233 8.9% 36,153 8.4%
Source: Environics Analytics via ArcGIS Online
2015 Income & Jobs Metro Halifax HRM
% %
2015 Households By Size 135,357 172,873
Current Year $ (2015)
Average household income 79,197 83,447
Median household income 62,190 67,242
Aggregate household income 10,564,204,139 14,913,910,511
Household Population 15+ 249,415 331,143
Projected Year (2020)
Average household income 90,481 94,880
Median household income 70,567 76,133
Household Population 15+ (proj.) 252,406 374,988
Projected Year (2025)
Average household income 105,109 109,592
Median household income 80,958 87,080
Household Population 15+ (Proj.) 270,500 356,782
Source: Environics Analytics via ArcGIS Online
----------- TURNER DRAKE & PARTNERS LTD. --------------------------------------------------------------------Page 15
2015 Income & Jobs Metro Halifax HRM
% %
Household Pop 15+ by Labour
Force Activity
Current Year (2015)
Employed Rate 93.02% 93.04%
Unemployed Rate 7.80% 6.96%
Participation Rate 75.00% 86.88%
Projected Year (2020)
Employed Rate 93.01% 92.94%
Unemployed Rate 6.99% 7.06%
Participation Rate 74.77% 82.10%
Projected Year (2025)
Employed Rate 92.01% 92.91%
Unemployed Rate 7.99% 7.09%
Participation Rate 73.99% 83.10%
Source: Environics Analytics via ArcGIS Online
In Metro Halifax, the dominant age group is 25- to 34-year-olds, at 18.5%, followed by 45- to 54-year-olds,
with 14.0%, though we note that there is relatively even distribution across the ten-year age brackets between
from age 35 to 64. The population is almost evenly split between males (48.6%) and females (51.4%). Over
half the population lives in 1- or 2-person households (69.8%), while the population aged 15 or older who are
married or living common law (51.6%) is almost equal to those who are single by virtue of never having been
married or via separation, divorce or being widowed (48.4%). Census families average 1.44 persons, with an
average of 0.57 children per census family. Of the children living at home, 73.0% are aged 19 or under, while
27.0% are young adults aged 20 or older.
The average household income is $79,197, with 75% of the population participating in the labour force. Of
the population aged 15 and over, 62.5% have some form of post-secondary education and an additional
23.9% have achieved their high school diploma. Of the population aged 15 and over, 13.6% has no formal
educational certification; we note that 4.8% of the total population is aged 15 to 19 years and that the typical
age at high school graduation is 18, so the 13.6% is likely somewhat overstated.
--------------------------------------------------------------------- TURNER DRAKE & PARTNERS LTD. ---------------------- TURNER DRAKE & PARTNERS LTD. --------------------------------------------------------------------
Page 16
POPULATION CHANGE: LOW-, MEDIUM- AND HIGH-GROWTH SCENARIOS
2015-2025 Population Projections HRM
Baseline Low Growth Scenario Medium Growth Scenario High Growth Scenario
2010 2015 2020 2025 2020 2025 2020 2025
change change change change change change change
0 to 4 years 20,034 20,198 0.8% 19,701 -2.5% 19,129 -2.9% 20,914 3.5% 21,288 1.8% 22,612 12.0% 24,200 7.0%
5 to 9 years 19,052 19,850 4.2% 20,411 2.8% 20,109 -1.5% 20,691 4.2% 21,469 3.8% 21,018 5.9% 23,266 10.7%
10 to 14 years 20,920 18,993 -9.2% 19,497 2.7% 19,771 1.4% 19,627 3.3% 20,173 2.8% 19,670 3.6% 20,574 4.6%
15 to 19 years 24,924 22,836 -8.4% 20,609 -9.8% 21,280 3.3% 20,830 -8.8% 21,599 3.7% 21,006 -8.0% 21,962 4.6%
20 to 24 years 32,237 32,318 0.3% 30,120 -6.8% 28,009 -7.0% 30,720 -4.9% 28,801 -6.2% 31,265 -3.3% 29,933 -4.3%
25 to 29 years 30,956 36,153 16.8% 36,718 1.6% 35,030 -4.6% 37,238 3.0% 35,864 -3.7% 37,629 4.1% 36,698 -2.5%
30 to 34 years 28,025 31,231 11.4% 33,694 7.9% 34,772 3.2% 34,052 9.0% 35,471 4.2% 34,350 10.0% 36,043 4.9%
35 to 39 years 28,411 28,524 0.4% 30,065 5.4% 31,698 5.4% 30,331 6.3% 32,259 6.4% 30,491 6.9% 32,708 7.3%
40 to 44 years 28,933 28,678 -0.9% 28,432 -0.9% 29,522 3.8% 28,631 -0.2% 29,991 4.8% 28,731 0.2% 30,304 5.5%
45 to 49 years 34,344 28,527 -16.9% 27,812 -2.5% 27,203 -2.2% 27,950 -2.0% 27,538 -1.5% 28,043 -1.7% 27,778 -0.9%
50 to 54 years 31,094 33,241 6.9% 28,631 -13.9% 27,817 -2.8% 28,720 -13.6% 28,095 -2.2% 28,809 -13.3% 28,280 -1.8%
55 to 59 years 26,612 30,292 13.8% 32,154 6.1% 27,578 -14.2% 32,237 6.4% 27,750 -13.9% 32,321 6.7% 27,923 -13.6%
60 to 64 years 23,075 25,450 10.3% 28,682 12.7% 30,224 5.4% 28,759 13.0% 30,383 5.6% 28,836 13.3% 30,583 6.1%
65 to 69 years 16,143 22,155 37.2% 24,391 10.1% 27,746 13.8% 24,466 10.4% 27,941 14.2% 24,578 10.9% 28,214 14.8%
70 to 74 years 11,411 14,626 28.2% 19,129 30.8% 20,492 7.1% 19,230 31.5% 20,662 7.4% 19,365 32.4% 20,934 8.1%
75 to 79 years 9,171 9,902 8.0% 12,390 25.1% 16,421 32.5% 12,455 25.8% 16,619 33.4% 12,586 27.1% 16,982 34.9%
80 to 84 years 6,465 7,316 13.2% 8,638 18.1% 11,158 29.2% 8,709 19.0% 11,340 30.2% 8,851 21.0% 11,705 32.2%
85 to 89 years 4,191 4,522 7.9% 5,281 16.8% 6,441 22.0% 5,353 18.4% 6,593 23.2% 5,426 20.0% 6,860 26.4%
90 years and over 2,261 2,806 24.1% 3,335 18.9% 3,955 18.6% 3,407 21.4% 4,069 19.4% 3,443 22.7% 4,221 22.6%
Total 398,259 417,617 4.9% 429,688 2.9% 438,354 2.0% 434,323 4.0% 447,906 3.1% 439,033 5.1% 459,168 4.6%Page 17
Population Profile
The Statistics Canada 2011 census records a population of 390,328 for the Halifax Census Metropolitan Area
(CMA), up 4.7% over the 2006 census. In the Halifax Population Centre, which is approximately equivalent
to the Metro Halifax submarket, the population according to the 2011 census was 297,943, up 4.4% over
2006. We have utilised two sources of data for population to allow for two types of analysis: estimates and
projections by age and by area. The table on the preceding page is based on Statistics Canada estimates,
and we note that the starting point estimates for 2010 are higher than those indicated by the census; the
following table uses data from Environics Analytics (EA) and has as its starting point figures closer to those
indicated by the census. However, the growth rates in each case are similar and indicate that the most
probable outcome will be low- to medium-growth during the projection period.
2015 Population Metro Halifax HRM
% %
Total Population
2010 (estimated) 289,190 400,910
2015 (estimated) 294,130 402,816
2020 Total Population (projected) 298,565 400,265
2025 Total Population (projected) 305,668 410,602
% Pop. Change (2010-2015) 1.7% 0.5%
% Pop. Change (2015-2020) 1.5% -0.6%
% Pop. Change (2020-2025) 2.4% 2.6%
2015 Total Population by Age 294,130 402,816
0 to 4 years 14,153 4.8% 20,346 5.1%
5 to 19 years 39,483 13.4% 57,937 14.4%
20 to 24 years 22,595 7.7% 28,626 7.1%
25 to 34 years 54,363 18.5% 66,771 16.6%
35 to 44 years 40,042 13.6% 55,975 13.9%
45 to 54 years 41,222 14.0% 59,953 14.9%
55 to 64 years 38,379 13.0% 54,197 13.5%
65 to 84 years 38,450 13.1% 52,008 12.9%
85 years & over 5,889 2.0% 6,962 1.7%
Source: Environics Analytics via ArcGIS Online
Population and Demographic Projections
We extracted the projected population change for HRM through 2025, using Statistics Canada’s low, medium
(M1), and high growth scenarios3 for Nova Scotia. As noted above, in using this methodology, the total
3
The low-growth scenario is defined by the following assumptions: a Canadian total fertility rate that reaches 1.53 births per woman
in 2021/2022 and remains constant thereafter; a Canadian life expectancy that reaches 85.9 years for males and 87.1 years for
females in 2062/2063; interprovincial migration based on the trends observed between 1991/1992 and 2010/2011; a national
immigration rate that reaches 0.5% in 2022/2023 and remains constant thereafter; an annual number of non-permanent residents
(Canada) that reaches 733,600 in 2014 and remains constant thereafter; a national net emigration rate of 0.16%.
The medium-growth and 1991/1992 to 2010/2011 interprovincial migrations trends scenario is defined by the following assumptions:
a Canadian total fertility rate that reaches 1.67 births per woman in 2021/2022 and remains constant thereafter; a Canadian life
expectancy that reaches 87.5 years for males and 89.1 years for females in 2062/2063; interprovincial migration based on the trends
observed between 1991/1992 and 2010/2011; a national immigration rate that reaches 0.75% in 2022/2023 and remains constant
thereafter; an annual number of non-permanent residents (Canada) that reaches 864,600 in 2021 and remains constant thereafter; a
national net emigration rate of 0.19%.
The high-growth scenario is defined by the following assumptions: a Canadian total fertility rate that reaches 1.88 births per woman in
2021/2022 and remains constant thereafter; a Canadian life expectancy that reaches 89.9 years for males and 91.9 years for females in
2062/2063; interprovincial migration based on the trends observed between 1991/1992 and 2010/2011; a national immigration rate that
reaches 0.9% in 2022/2023 and remains constant thereafter; an annual number of non-permanent residents (Canada) that reaches
1,144,300 in 2031 and remains constant thereafter; a national net emigration rate of 0.21%.
--------------------------------------------------------------------- TURNER DRAKE & PARTNERS LTD. -----------Page 18
population projections exceed those of EA in all growth scenarios. Nevertheless, the information is useful
because it allows the projections to be broken down by age groups.
The results reveal the following anticipated patterns in the decade ahead:
1. In each of the low-, medium-, and high-growth scenarios the population aged 70 and above is
expected to experience the highest growth rate. The population is rapidly aging; this will drive
changing demand in the housing market, as more seniors seek to downsize or require housing in
specialised facilities.
2. Only under the high-growth scenario is there a notable increase in children aged 9 and under,
represented by an increase in 0-4 year-olds in 2020 and 5-9 year-olds in 2025. This is supported by
moderate growth projections for the population aged 30 to 39 years; Statistics Canada reports that
as of 2011, the average age of mothers at first birth was 28.5 years, while the average age of mothers
at birth was 30.2, both of which were the oldest on record.
The Municipality has stated in its 2016-21 Economic Strategy a long-term vision for the city to grow the
population to 550,000 by the year 2031. To this end, they have established strategic goals including growing
the labour force to 271,000 in the next five years by attracting and retaining students/graduates and
immigrants and aligning the various municipal and provincial economic development organizations such that
they are all working towards shared goals and not at cross-purposes. This demonstrates a recognition of the
fact that in order to attract and retain population, job creation is essential. The Provincial government has
been actively lobbying the federal government to increase provincial immigration caps, particularly for
immigrants who may be nominated for permanent residence under the economic stream of the federal
immigration program. Immigration has been identified as a key priority for the province in order to counter the
demographic challenges presented by aging population and low birth rate. The Office of Immigration’s 2015-
2016 Statement of Mandate targets nomination of 1,050 immigrants for permanent residence, in part by
focusing on liaising with business about hiring immigrants and establishing an immigration stream for
entrepreneurs.
In Nova Scotia, natural increase no longer contributes to population growth, as deaths now outnumber births
– a symptom of the rapidly aging population and historically low fertility rates. Statistics Canada anticipates
that this will remain the case over the next two decades, meaning that all population growth will be due to in-
migration, either from other parts of the country or internationally. The current collapse of oil prices and
subsequent bust cycle ongoing in Alberta may spur the return of many who left for work in the oil patch, but
international immigration will become increasingly important. Population growth in Halifax in recent years has
largely depended on people moving from more rural areas of the province; eventually, this supply will dry up
and the city will need to look elsewhere to support population increases, albeit not during the projection time
frame of this study. Municipal and Provincial efforts may provide a boost to the population over the next ten
years, but their targets represent a dramatic shift from the trends of the past five years, and may be considered
optimistic. Having regard to the foregoing, we have adopted the medium-growth scenario as the most likely
outcome over the next decade.
The following table shows the projections for households by size. By 2025, the percentage of 1- and 2-person
households in Metro Halifax is expected to increase from 69.8% to 73.7%. The same measure in Halifax
Regional Municipality is anticipated to increase from 66.1% to 71.4%.
----------- TURNER DRAKE & PARTNERS LTD. --------------------------------------------------------------------Page 19
Households Metro Halifax HRM
% %
2020 Households by Size 142,991 189,029
1 person 47,952 33.5% 55,848 29.5%
2 persons 51,811 36.2% 69,041 39.9%
3 persons 22,060 15.4% 31,064 18.0%
4 persons 15,209 10.6% 23,908 13.8%
5 persons 4,357 3.0% 6,806 3.9%
6+ persons 1,602 1.1% 2,362 1.4%
Persons in private households 292,779 407,206
Persons per household 2.05 2.15
2025 Households by Size 149,995 198,603
1 person 50,269 33.5% 58,581 29.5%
2 persons 54,356 40.2% 72,520 41.9%
3 persons 23,166 17.1% 32,680 18.9%
4 persons 15,960 11.8% 25,184 14.6%
5 persons 4,573 3.4% 7,157 4.1%
6+ persons 1,671 1.2% 2,481 1.4%
Persons in private households 288,562 417,664
Persons per household 1.92 2.10
Source: Environics Analytics via ArcGIS Online
Average household incomes (detailed in the earlier Income & Jobs table) are projected to increase 31.3% in
the next ten years for HRM, with a 17.7% increase in Metro Halifax. We note that the All-Items Consumer
Price Index (CPI) for Halifax increased by 18.5% between the years 2005 and 2014. If it follows a similar
trend for the projection period, gains in household income for the Metro Halifax area will just barely keep pace.
Employment levels and labour force participation rates are expected to remain largely unchanged, as are
achieved levels of education.
Conclusion
The Metro Halifax market is expected to experience low- to moderate growth in population over the next ten
years. The driving force behind this population increase will be migration. The in-migration of people from
rural areas of Nova Scotia to the city is expected to continue for the duration of the projection period.
International immigration represents an opportunity for population growth which the province has previously
appeared unable or unwilling to capitalise on, but there are signs that a shift in attitude may be underway (e.g.
the recent support for refugees from Syria) and further efforts may be put towards encouraging immigrants to
settle in Nova Scotia, most likely in Halifax. Income levels are expected to increase, albeit not in excess of
the cost of living for the Metro area.
--------------------------------------------------------------------- TURNER DRAKE & PARTNERS LTD. -----------Page 20
HALIFAX REAL ESTATE MARKET DEMAND AND ABSORPTION FORECAST
RESIDENTIAL MARKET
Owner Occupied Housing Demand
Demand for real estate is measured by the number of units sold. The residential sales processed through the
Multiple Listing Service (MLS®) include existing and newly constructed units. Almost all existing dwelling stock
is sold through the MLS®, but a far lower proportion of new units are marketed in this fashion. Although this
fact does bias the data the trend probably holds true over time so the information can be utilised for longitudinal
analysis. The following table shows the historic figures for sales in HRM between 2005 and 2015, as well as
the established projected number of sales for the projection period. Under the demographic and economic
conditions of the past ten years, the volume of sales in HRM has declined, despite growth in the total
population and various key age segments thereof, the median and average household incomes, and each of
the provincial Real Gross Domestic Product (GDP) and Consumer Price Index (CPI). Having regard to the
largely similar demographic and economic forecast for the next ten years, and in the presence of limited
reason to think otherwise, it is reasonable to assume that this pattern will continue for the projection period.
Residential Sales (All HRM)
Total Single Detached Semi-Detached Row Condominium
Semi-Det. & Row Apartment
% % % % % %
2025 (proj.) 3,112 2,222 377 121 76 315
2024 (proj.) 3,214 2,295 390 125 79 326
2023 (proj.) 3,319 2,370 403 129 81 336
2022 (proj.) 3,428 2,448 416 133 84 347
2021 (proj.) 3,540 2,528 429 137 87 359
2020 (proj.) 3,656 2,611 443 142 89 371
2019 (proj.) 3,776 2,696 458 147 92 383
2018 (proj.) 3,899 2,784 473 151 95 395
2017 (proj.) 4,027 2,876 488 156 98 408
2016 (proj.) 4,159 2,970 504 162 102 422
2015 4,295 - 3,168 73.8% 469 10.9% 163 3.8% 84 2.0% 411 9.6%
2014 4,497 - 3,246 72.2% 515 11.5% 198 4.4% 112 2.5% 426 9.5%
2013 4,746 - 3,469 73.1% 557 11.7% 180 3.8% 94 2.0% 446 9.4%
2012 5,753 - 4,101 71.3% 703 12.2% 206 3.6% 144 2.5% 599 10.4%
2011 5,689 - 4,008 70.5% 672 11.8% 241 4.2% 137 2.4% 631 11.1%
2010 5,471 - 3,902 71.3% 651 11.9% 231 4.2% 132 2.4% 555 10.1%
2009 5,563 - 3,944 70.9% 648 11.6% 229 4.1% 172 3.1% 570 10.2%
2008 5,923 - 4,255 71.8% 723 12.2% 201 3.4% 156 2.6% 588 9.9%
2007 6,628 - 4,620 69.7% 855 12.9% 265 4.0% 160 2.4% 728 11.0%
2006 5,834 - 4,108 70.4% 778 13.3% 201 3.4% 151 2.6% 596 10.2%
2005 5,928 - 4,257 71.8% 745 12.6% 228 3.8% 133 2.2% 565 9.5%
Total 60,327 43,078 71.4% 7,316 12.1% 2,343 3.9% 1,475 2.4% 6,115 10.1%
Source: Historic: NSAR MLS® Projected: Turner Drake & Partners Ltd.
----------- TURNER DRAKE & PARTNERS LTD. --------------------------------------------------------------------Page 21
Residential Sales in HRM
5,000
4,000
3,000
2,000
1,000
-
2005 2006 2007 2008 2009 2010 2011 2012 2013 2014 2015
Single Detached Semi-Detached Row Condo Semi & Row Condo Apartments
Source: NSAR MLS®
Supply
We compiled the inventory of real estate in Metro Halifax using the municipal building footprint map layer,
overlaid with the provincial property tax assessment map layer in order to extract only those buildings with a
residential tax designation. The results indicate that there are 88,967 residential buildings in Metro Halifax.
These are shown on the Residential Building Inventory Map on the following page; for the purposes of
relevance to this report (as well as useful scale), the map has been centered on the Halifax Peninsula. This
figure includes both rented and owned dwellings. We note that it counts buildings, not units, and is therefore
an underestimate of the total number of dwelling units in the area.
The foregoing residential building estimate is supported by dwelling unit data from EA: the following table
presents the historic and projected figures for the total number of occupied dwellings, by tenure, in the
submarkets considered in this report:
Households Metro Halifax HRM
% %
2015 Occupied private dwellings 135,356 172,868
Owned 72,464 53.5% 107,135 62.0%
Rented 62,873 46.5% 65,714 38.0%
Band housing 19 0.01% 19 0.01%
2020 Occupied private dwellings (proj.) 142,975 188,336
Owned 76,329 53.4% 117,998 62.7%
Rented 66,646 46.6% 70,338 37.3%
2025 Occupied private dwellings (proj.) 149,980 197,855
Owned 80,268 53.5% 124,137 62.7%
Rented 69,712 46.5% 73,718 37.3%
Source: Environics Analytics via ArcGIS Online
Based on the foregoing data, approximately 78% of the total occupied private dwellings are located in the
Metro Halifax submarket.
The following table presents figures on occupied dwellings in HRM from Canada Mortgage and Housing
Corporation (CMHC). We note that, as between Statistics Canada and EA, there is discrepancy in the figures,
but each allows for a different and useful way to analyse the data, and so both are included here. The CMHC
data shows the increasing trend over time; the year over year increases in the total number are related (though
not identical) to the number of housing starts each year.
--------------------------------------------------------------------- TURNER DRAKE & PARTNERS LTD. -----------You can also read