Real-time monitoring the transmission potential of COVID-19 in Singapore, March 2020 - BMC Medicine
←
→
Page content transcription
If your browser does not render page correctly, please read the page content below
Tariq et al. BMC Medicine     (2020) 18:166
https://doi.org/10.1186/s12916-020-01615-9

 RESEARCH ARTICLE                                                                                                                                  Open Access

Real-time monitoring the transmission
potential of COVID-19 in Singapore,
March 2020
Amna Tariq1*, Yiseul Lee1, Kimberlyn Roosa1, Seth Blumberg2, Ping Yan3, Stefan Ma4 and Gerardo Chowell1

  Abstract
  Background: As of March 31, 2020, the ongoing COVID-19 epidemic that started in China in December 2019 is
  now generating local transmission around the world. The geographic heterogeneity and associated intervention
  strategies highlight the need to monitor in real time the transmission potential of COVID-19. Singapore provides a
  unique case example for monitoring transmission, as there have been multiple disease clusters, yet transmission
  remains relatively continued.
  Methods: Here we estimate the effective reproduction number, Rt, of COVID-19 in Singapore from the publicly
  available daily case series of imported and autochthonous cases by date of symptoms onset, after adjusting the
  local cases for reporting delays as of March 17, 2020. We also derive the reproduction number from the distribution
  of cluster sizes using a branching process analysis that accounts for truncation of case counts.
  Results: The local incidence curve displays sub-exponential growth dynamics, with the reproduction number
  following a declining trend and reaching an estimate at 0.7 (95% CI 0.3, 1.0) during the first transmission wave by
  February 14, 2020, while the overall R based on the cluster size distribution as of March 17, 2020, was estimated at
  0.6 (95% CI 0.4, 1.02). The overall mean reporting delay was estimated at 6.4 days (95% CI 5.8, 6.9), but it was shorter
  among imported cases compared to local cases (mean 4.3 vs. 7.6 days, Wilcoxon test, p < 0.001).
  Conclusion: The trajectory of the reproduction number in Singapore underscores the significant effects of
  successful containment efforts in Singapore, but it also suggests the need to sustain social distancing and active
  case finding efforts to stomp out all active chains of transmission.
  Keywords: SARS-CoV-2, COVID-19, Singapore, Transmission potential, Transmission heterogeneity, Reproduction
  number, Cluster distribution, Reporting delay

Background                                                                            Subsequently, rapid human-to-human transmission of the
The ongoing Coronavirus Disease 2019 (COVID-19) pan-                                  disease was confirmed in January 2020, and the etiological
demic started with a cluster of pneumonia cases of unknown                            agent was identified as severe acute respiratory syndrome-
etiology in Wuhan, China, back in December 2019 [1, 2].                               related coronavirus 2 (SARS-CoV-2) due to its genetic simi-
The initial cases have been linked to a wet market in the city                        larity to the SARS-CoV (severe acute respiratory syndrome
of Wuhan, pointing to an animal source of the epidemic [3].                           coronavirus) discovered in 2003 [4, 5]. The total global case
                                                                                      tally has reached 750,890 infections including 36,405 deaths
                                                                                      and involving 199 countries as of March 31, 2020 [6]. As the
* Correspondence: atariq1@student.gsu.edu
1
 Department of Population Health Sciences, School of Public Health, Georgia
                                                                                      virus continues to spread in the human population, obtaining
State University, Atlanta, GA 30303, USA                                              an accurate “real-time” picture of the epidemic’s trajectory is
Full list of author information is available at the end of the article

                                       © The Author(s). 2020 Open Access This article is licensed under a Creative Commons Attribution 4.0 International License,
                                       which permits use, sharing, adaptation, distribution and reproduction in any medium or format, as long as you give
                                       appropriate credit to the original author(s) and the source, provide a link to the Creative Commons licence, and indicate if
                                       changes were made. The images or other third party material in this article are included in the article's Creative Commons
                                       licence, unless indicated otherwise in a credit line to the material. If material is not included in the article's Creative Commons
                                       licence and your intended use is not permitted by statutory regulation or exceeds the permitted use, you will need to obtain
                                       permission directly from the copyright holder. To view a copy of this licence, visit http://creativecommons.org/licenses/by/4.0/.
                                       The Creative Commons Public Domain Dedication waiver (http://creativecommons.org/publicdomain/zero/1.0/) applies to the
                                       data made available in this article, unless otherwise stated in a credit line to the data.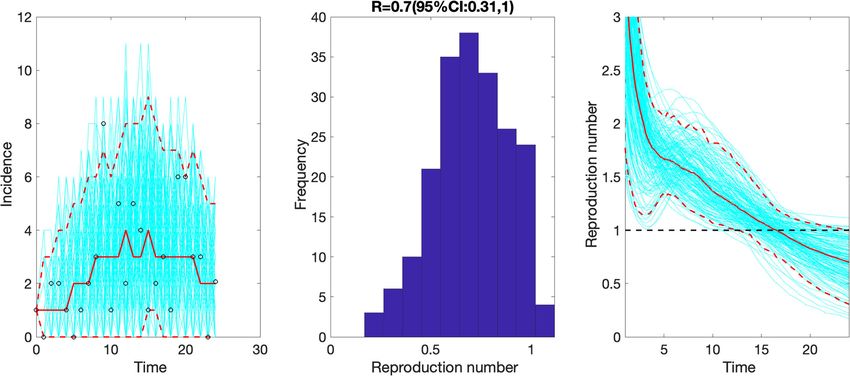
Tariq et al. BMC Medicine     (2020) 18:166                                                                                             Page 2 of 14

complicated by several factors including reporting delays and             reported, with approximately 3400 cases involving
changes in the case definition [7, 8]. Although the COVID-                healthcare workers [15]. This pattern aligns well with
19 case incidence in China has substantially declined, active             past outbreaks of severe acute respiratory syndrome
transmission is now occurring in multiple countries around                (SARS) and Middle Eastern respiratory syndrome
the world [2]. Epidemiological data from these countries can              (MERS) [16], including substantial nosocomial transmis-
help to monitor transmission potential of SARS-CoV-2 in                   sion during the 2003 SARS outbreak in Singapore [17]. To
near real time.                                                           minimize the risk of hospital-based transmission of SARS-
   Outside of China, Singapore, where the first symptom-                  CoV-2, the Ministry of Health of Singapore has restricted
atic imported case (66 years old Chinese male) was re-                    the movement of patients and staff across hospitals [18].
ported on January 23, 2020, has been able to maintain                     Also, because multiple unlinked COVID-19 cases have
relatively low COVID-19 incidence levels through active                   been reported in the community [19] and the recognition
case finding and strict social distancing measures. Up until              that a substantial proportion of asymptomatic cases may
March 31, 2020, Singapore has reported 926 laboratory                     be spreading the virus [20–22], strict social distancing
confirmed cases, including 24 reported case importations                  measures have been put in place including advising the
from Wuhan China and 501 non-Wuhan-related case im-                       public against large social gatherings in order to mitigate
portations [9]. Imported cases include six individuals who                the risk of community transmission [23]. These social dis-
were evacuated from China between January 30 and Feb-                     tancing measures reduce the risk of onward transmission
ruary 9, 2020, and multiple citizens and long-term                        not only within Singapore, but also beyond the borders of
Singapore pass holders returning from Asia, Europe, and                   this highly connected nation [24]. A recent influx of
North America in late March 2020 [9–11]. Moreover,                        imported cases from Asia, Europe, and North America
Singapore has reported 3 deaths as of March 31, 2020 [9].                 into Singapore has triggered travel bans and restrictions
On February 4, 2020, the Ministry of Health of Singapore                  for travelers and citizens [9].
reported its first local cluster of COVID-19, which was                     The reproduction number is a key threshold quantity to
linked to the Yong Thai Hang shop [12]. A total of 18                     assess the transmission potential of an emerging disease
clusters with 2 or more COVID-19 cases have been re-                      such as COVID-19 [25, 26]. It quantifies the average num-
ported thus far. Table 1 summarizes the characteristics of                ber of secondary cases generated per case. If the
the 6 largest clusters in Singapore.                                      reproduction number is below 1.0, infections occur in iso-
   Although large-scale community transmission has not                    lated clusters as self-limited chains of transmission, and
been reported in Singapore, the novel coronavirus can                     persistence of the disease would require continued un-
rapidly spread in confined and crowded places, as illus-                  detected importations. On the other hand, reproduction
trated by large clusters of COVID-19 cases linked to the                  numbers above 1.0 indicate sustained community trans-
Grace Assembly of God Church, the Life Church and                         mission [16, 26]. Using epidemiological data and mathem-
Missions Singapore, Wizlearn Technologies, and the                        atical modeling tools, we are monitoring the effective
SAFRA Jurong cluster [13, 14]. In China, substantial                      reproduction number, Rt, of SARS-CoV-2 transmission in
hospital-based transmission of SARS-CoV-2 has been                        Singapore in real-time, and here we report the evolution
Table 1 Characteristics of the largest COVID-19 outbreak in Singapore as of March 17, 2020
Cluster name            Cluster location                   Cluster   Number of         Number of       Number of      Reporting date   Reporting date
                                                           size      imported          local cases     secondary      for the first    for the last
                                                                     cases linked to   linked to the   cases in the   case linked to   case linked to
                                                                     the cluster       cluster         cluster        cluster          cluster
Yong Thai Hang          Yong Thai Hang Medical Store on    9         0                 9               1              February 4,      February 8,
cluster                 Cavan Road                                                                                    2020             2020
Grand Hyatt cluster     Grand Hyatt hotel in Orchard       3         0                 3               0              February 6,      February 8,
                                                                                                                      2020             2020
The Life Church and     The Life Church and Missions at    33        2                 31              10             January 29,      March 9, 2020
Missions and The        Paya Lebar and The Grace                                                                      2020
Grace Assembly of       Assembly of God Church at
God cluster             Tanglin and Bukit Batok
Seletar Aerospace       Seletar Aerospace Heights          5         0                 5               4              February 9,      February 15,
Heights construction    construction site                                                                             2020             2020
cluster
Wizlearn                Wizlearn Technologies in Science   14        0                 14              8              February 26,     March 3, 2020
Technologies cluster    park                                                                                          2020
SAFRA Jurong cluster SAFRA Jurong restaurant               48        0                 48              29             February 27,     March 16,
                                                                                                                      2020             2002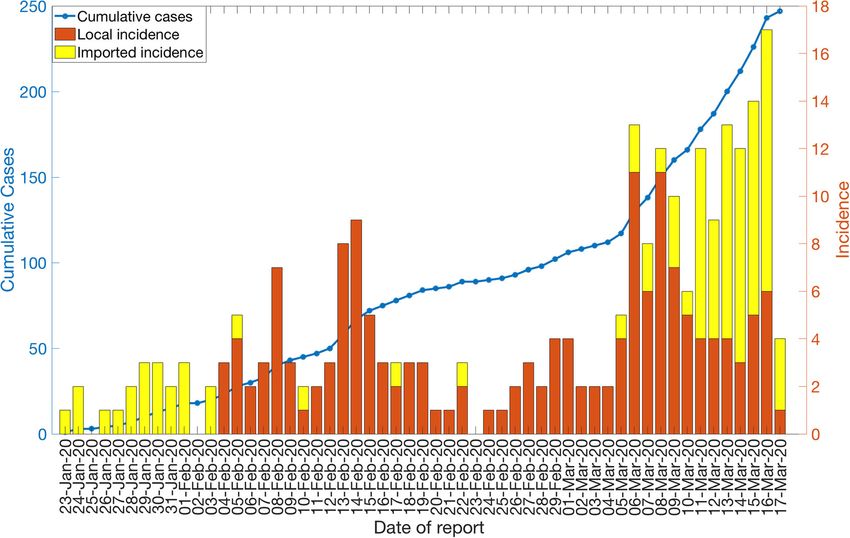
Tariq et al. BMC Medicine   (2020) 18:166                                                                   Page 3 of 14

of Rt by March 17, 2020. Specifically, we characterize the   cluster had left Singapore before the onset of symptoms.
growth profile and the effective reproduction number dur-    All Singaporean residents associated with this cluster
ing the first transmission wave from the daily case series   have recovered as of February 19, 2020 [30]. No add-
of imported and autochthonous cases by date of symp-         itional cases have been added to this cluster as of Febru-
toms onset after adjusting for reporting delays, and we      ary 8, 2020.
also derive an estimate of the overall reproduction number
based on the characteristics of the clusters of COVID-19     Seletar Aerospace Heights cluster
in Singapore.                                                This cluster with 5 Bangladeshi work pass holders was
                                                             identified on February 9, 2020. No further cases have
Methods                                                      been added to this cluster as of February 15, 2020.
Data
We obtained the daily series of 247 confirmed COVID-         The Life Church and Missions and The Grace Assembly of
19 cases in Singapore between January 23 and March 17,       God cluster
2020, from public records of the Ministry of Health,         This Singaporean cluster is composed of 33 cases, in-
Singapore, as of March 17, 2020 [27]. Individual-level       cluding two imported cases and 31 local cases. The clus-
case details including the dates of symptom onset, the       ter started during The Life Church and Missions service
date of reporting, and whether the case is autochthonous     event in Paya Lebar on January 19, 2020. This event was
(local transmission) or imported are publicly available.     apparently seeded by two visitors from Wuhan China
Clusters consisting of two or more cases according to        who infected a couple with SARS-CoV-2 at the church.
the infection source were also assembled from case de-       The infected couple likely passed the infection to an-
scriptions obtained from field investigations conducted      other case during a Lunar New Year’s celebration on
by the Ministry of Health, Singapore [27]. Single            January 25, 2020. This case had subsequently infected
imported cases are analyzed as clusters of size 1 whereas    Grace Assembly of God church staff at the Tanglin
unlinked cases were excluded from the cluster analysis.      branch, generating secondary cases by the time he
                                                             was reported on February 14, 2020. Two branches
Transmission clusters                                        of the Grace Assembly of God church at Tanglin
As of March 17, 2020, 18 different clusters of COVID-        and Bukit Batok have been included in this cluster
19 cases with 2–48 cases per cluster have been reported      [28, 31]. This church serves an average of 4800
in Singapore. A schematic diagram and characteristics of     people in attendance over the weekend. While the
the COVID-19 clusters in Singapore are given in Fig. 1       church has momentarily closed, field investigations
and Table 1. The geographic location of the six clusters     have not led to conclusive evidence regarding super-
accounting for 45.3% of the total cases is shown in Fig. 2   spreading transmission. No further cases have been
whereas the corresponding distribution of cluster sizes is   added to this cluster as of March 9, 2020.
shown in Fig. 3.
                                                             SAFRA Jurong cluster
Yong Thai Hang cluster                                       The largest cluster composed of 48 local cases is linked
This cluster with 9 cases was the first to be reported in    to a private dinner function at SAFRA Jurong restaurant
Singapore. It has nine traceable links, including eight      on February 15, 2020. The restaurant was closed for
Chinese and one Indonesian national associated with the      cleaning from February 16 to February 19, 2020, follow-
visit of Chinese tourists to the Yong Thai Hang health       ing the dinner function. The latest case was added to
products store, a shop that primarily serves the Chinese     this cluster on March 16, 2020.
population, on January 23, 2020. Four shop employees
and the tour guide were first identified as a cluster on     Wizlearn Technologies cluster
February 4, 2020 [12, 28, 29]. The tour guide subse-         This cluster which comprises of 14 cases was identified
quently infected her husband, a newborn, and the do-         on February 26, 2020. Wizlearn Technologies is an
mestic helper [29]. No further cases have been added to      e-learning solutions company. The latest case was added
this cluster as of February 8, 2020.                         to this cluster on March 3, 2020.

Grand Hyatt hotel                                            Church of Singapore cluster
This cluster with 3 local cases was the second cluster to    The first case of this cluster was identified on March 14,
receive international attention, as it originated from a     2020, originating as a secondary case from a case in the
business meeting held at the Grand Hyatt hotel attended      SAFRA Jurong cluster. This cluster is composed of 3
by Singaporean locals and the Chinese visitors from          local cases. No further cases have been added to this
Hubei [30]. Four international cases associated with this    cluster since March 16, 2020.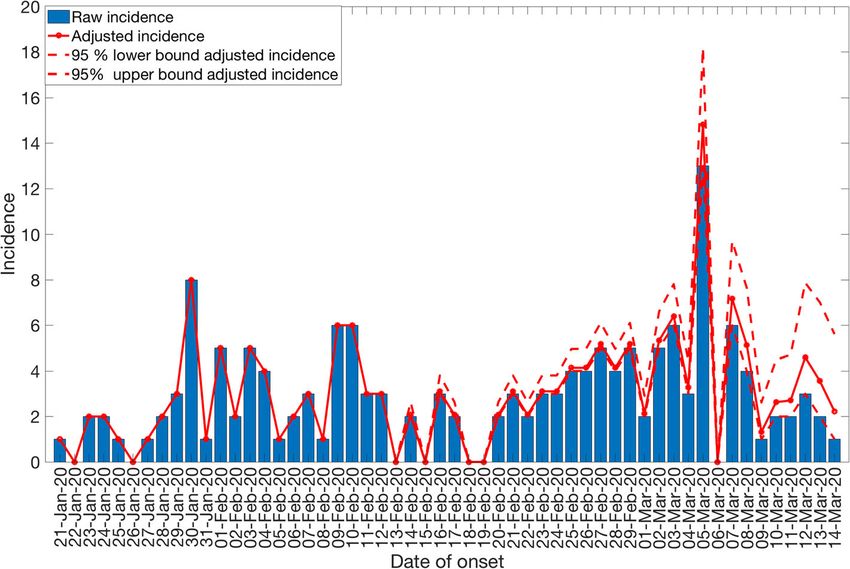
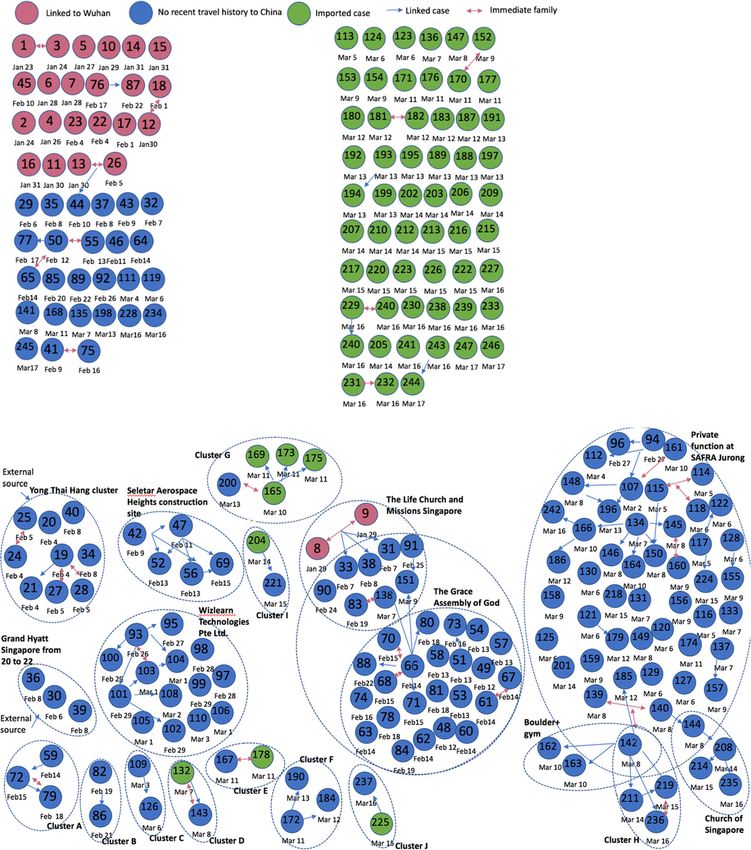
Tariq et al. BMC Medicine   (2020) 18:166                                                                                   Page 4 of 14

 Fig. 1 Cluster network of the cases in Singapore for the COVID-19 global pandemic as of March 17, 2020. The pink circles represent
 the cases linked to Wuhan, the green circles represent the non-Wuhan-related case importations, and the blue circles represent cases
 with no travel history to China. The larger dotted circles represent the COVID-19 disease clusters. Each blue arrow represents the
 direction in which the disease was transmitted. Pink arrows represent immediate family. Dates below the circles are the dates of
 case reporting

Boulder gym cluster                                                  cluster. This cluster is composed of 3 local cases.
The first case of this cluster was identified on                     No further cases have been added to this cluster
March 8, 2020, also linked to the SAFRA Jurong                       since March 10, 2020.
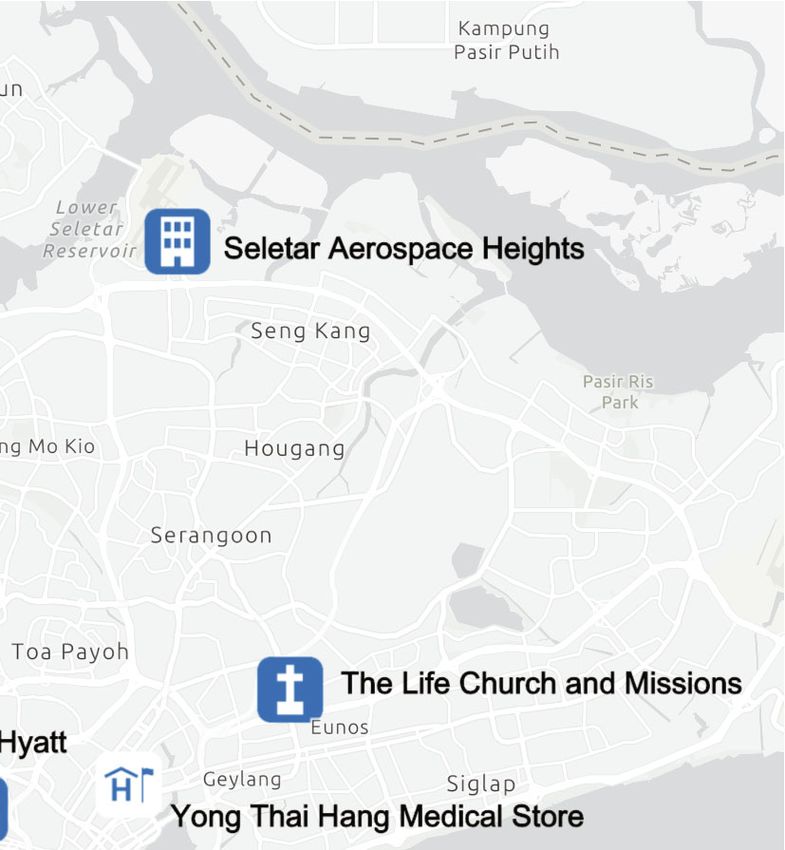
Tariq et al. BMC Medicine     (2020) 18:166                                                                                              Page 5 of 14

 Fig. 2 Map depicting the spatial distribution of the 6 largest COVID-19 clusters in Singapore; Grand Hyatt cluster, Yong Thai Hang cluster, Seletar
 Aerospace cluster, Wizlearn Technologies cluster, SAFRA Jurong cluster, and The Grace Assembly of God Church and Life Church and Missions
 cluster as of March 17, 2020

 Fig. 3 Distribution of COVID-19 cluster sizes in Singapore as of March 17, 2020

Tariq et al. BMC Medicine   (2020) 18:166                                                                    Page 6 of 14

Cluster A                                                    Cluster J
The first case of this cluster was identified on February    The first case of this cluster was identified on March 15,
14, 2020. The cluster comprises of 3 local cases. No fur-    2020. This cluster is composed of one imported and one
ther cases have been added in this cluster as of February    local case. No further cases have been added to this clus-
18, 2020.                                                    ter since March 16, 2020.

Cluster B                                                    Adjusting for reporting delays
The first case of this cluster was identified on February    As an outbreak progresses in real time, epidemiological
19, 2020. This cluster is composed of two local cases.       curves can be distorted by reporting delays arising from
No further cases have been added in this cluster since       several factors that include (i) delays in case detection
February 21, 2020.                                           during field investigations, (ii) delays in symptom onset
                                                             after infection, (iii) delays in seeking medical care, (iv)
Cluster C                                                    delays in diagnostics, and (v) delays in processing data in
This first case of this cluster was identified on March 3,   surveillance systems [32]. However, it is possible to gen-
2020. This cluster is composed of 2 local cases. No fur-     erate reporting-delay-adjusted incidence curves using
ther cases have been added to this cluster since March       standard statistical methods [33]. Briefly, the reporting
6, 2020.                                                     delay for a case is defined as the time lag in days be-
                                                             tween the date of onset and date of reporting. Here we
Cluster D                                                    adjusted the COVID-19 epidemic curve of local cases by
The first case of this cluster was identified on March 7,    reporting delays using a non-parametric method that
2020. The two cases (one imported and one local) in this     employs survival analysis known as the Actuaries
cluster are related to each other. No further cases have     method for use with right truncated data, employing re-
been added in this cluster since March 8, 2020.              verse time hazards to adjust for reporting delays as de-
                                                             scribed in a previous publication [34–36]. The 95%
Cluster E                                                    prediction limits are derived according to Lawless and
The two cases (an imported and a local case) of this         Kalbfleisch [37]. For this analysis, we exclude 7 imported
cluster were identified on March 11, 2020. No further        cases and 5 local cases for which dates of symptoms on-
cases have been added in this cluster since March 11,        set are unavailable.
2020.
                                                             Effective reproduction number from case incidence
Cluster F                                                    We assess the effective reproduction number over the
The first case of this cluster was identified on March 11,   course of the outbreak, Rt, which quantifies the temporal
2020. This cluster is composed of 3 local cases. No fur-     variation in the average number of secondary cases gen-
ther cases have been added to this cluster since March       erated per case during the course of an outbreak after
13, 2020.                                                    considering multiple factors including behavior changes,
                                                             cultural factors, and the implementation of public health
Cluster G                                                    measures [16, 26, 38]. Estimates of Rt > 1 indicate sus-
This cluster is composed of 5 cases, including 4             tained transmission, whereas, Rt < 1 implies that the out-
imported cases. The first case of this cluster was identi-   break is slowing down and the incidence trend is
fied on March 10, 2020. No further cases have been           declining. Hence, maintaining Rt < 1 is required to bring
added to this cluster since March 13, 2020.                  an outbreak under control. Using the reporting delay ad-
                                                             justed incidence curve, we estimate the most recent esti-
Cluster H                                                    mate of Rt for COVID-19 in Singapore by characterizing
The first case of this cluster was identified on March 14,   the early transmission phase using a phenomenological
2020, a secondary case generated from a case at SAFRA        growth model as described in previous publications [39–
Jurong cluster. This cluster is composed of 3 local cases.   42]. Specifically, we first characterize daily incidence of
No further cases have been added to this cluster since       local cases for the first transmission wave (January 21–
March 16, 2020.                                              February 14, 2020) using the generalized logistic growth
                                                             model (GLM) after adjusting for imported cases. This
Cluster I                                                    model characterizes the growth profile via three parame-
The first case of this cluster was identified on March 14,   ters: the growth rate (r), the scaling of the growth par-
2020. This cluster is composed of one local and one          ameter (p), and the final epidemic size (K). The GLM
imported case. No further cases have been added to this      can reproduce a range of early growth dynamics, includ-
cluster since March 15, 2020.                                ing constant growth (p = 0), sub-exponential or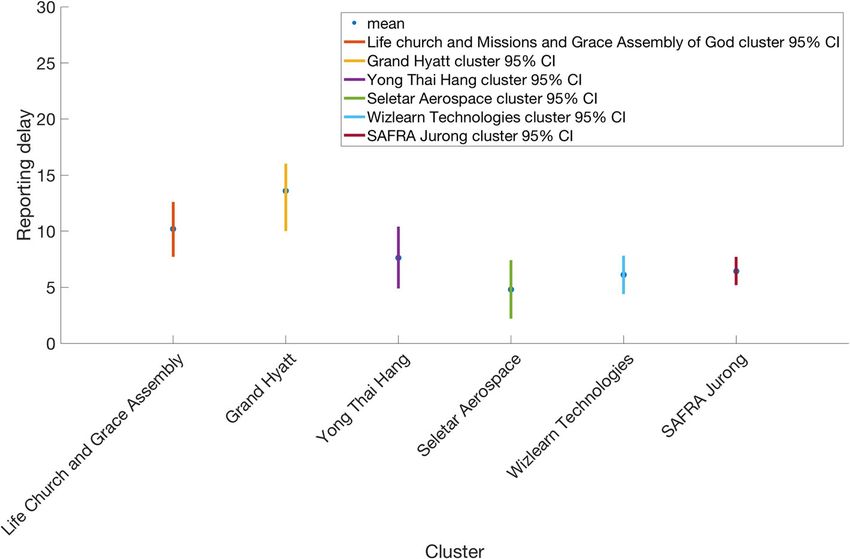
Tariq et al. BMC Medicine            (2020) 18:166                                                                            Page 7 of 14

polynomial growth (0 < p < 1), and exponential growth          infections being unobserved. This is accomplished by de-
(p = 1) [40, 42]. We denote the local incidence at calen-      noting x as the sum of the observed number of serial in-
dar time ti by Ii, the raw incidence of imported cases at      tervals in a cluster. Then the likelihood that an observed
calendar time ti by Ji, and the discretized probability dis-   cluster of size j containing m imported cases is gener-
tribution of the generation interval by ρi. The generation     ated by x infectious intervals is given by:
interval is assumed to follow a gamma distribution with
a mean of 4.41 days and a standard deviation of 3.17 days                                  m
based on refs. [43, 44]. Then, we can estimate the effect-        lCm→ j ðReff ; k; xÞ ¼     lx→ð j−mÞ ðReff ; k Þ                       ð1Þ
                                                                                           j
ive reproduction number by employing the renewal
equation given by [45, 46]                                        where the likelihood of i infections causing j infections
                                                               is given by:
                               Ii
    Rti ¼ Pi
                         I i− j þ α J i− j ρi
               j¼0                                                                                                   ki               j
                                                                                          Γð j þ kiÞ           k                Reff
                                                                  li→ j ðReff ; k Þ ¼
  In this equation, the numerator represents the new                                    Γð j þ 1ÞΓðkiÞ     Reff þ k           Reff þ k
cases Ii, and the denominator represents the total num-                                                                                  ð2Þ
ber of cases that contribute to the new cases Ii at time ti.
Parameter 0 ≤α ≤ 1 represents the relative contribution        where Γ is the gamma function.
of imported cases to the secondary disease transmission.         To determine the number of observed serial intervals
We perform a sensitivity analyses by setting α = 0.15 and      in each cluster, we first estimate the cumulative prob-
α = 1.0 [47]. Next, in order to derive the uncertainty         ability distribution of the serial interval. We assume the
bounds around the curve of Rt directly from the uncer-         serial interval is a gamma distribution, with a mean of
tainty associated with the parameters estimates (r, p, K),     4.7 days and a standard deviation of 2.9 days [43]. This
we estimate Rt for 300 simulated curves assuming a             translates to a shape parameter of 2.63 and a scale par-
Poisson error structure [48].                                  ameter of 1.79. We then use the difference between the
                                                               onset data and the end of our study (March 17, 2020) to
Reproduction number (R) from the analysis of cluster           determine how much of the infectious period was ob-
sizes                                                          served. For cases that only have a report date, but no on-
A second method of inferring the reproduction number           set date, we assume an onset date that is 6 days earlier
applies branching process theory to cluster size data to       than the reporting date. This is based on the average
infer the degree of transmission heterogeneity [49, 50].       duration between onset date and report date that was
Simultaneous inference of heterogeneity and the                observed in the data. When applied to the case series,
reproduction number has been shown to improve the              we are able to assign a total size, the number of
reliability of confidence intervals for the reproduction       imported cases, and the observed number of infectious
number [51]. In the branching process analysis, the            periods for each cluster in the case series. When no
number of transmissions caused by each new infection is        imported cases are known to be in a cluster, we assign
modeled as a negative binomial distribution. This is pa-       the number of imported cases to be one as the cluster
rameterized by the effective reproduction number, R,           must have been initiated by someone (e.g., the index
and the dispersion parameter, k. The reproduction num-         case had contact with a foreign visitor).
ber provides the average number of secondary cases per           When Eq. (1) is applied to the table of cluster size
index case, and the dispersion parameter varies inversely      characteristics, the likelihood of the data can be calcu-
with the heterogeneity of the infectious disease. In this      lated as a function of R and k. Minimizing the likelihood
parameterization, a lower dispersion parameter indicates       produces the maximum likelihood estimates of R and k.
higher transmission heterogeneity.                             Applying the likelihood ratio test by profiling and R and
  Branching process theory provides an analytic repre-         k produces confidence intervals [53]. Code was run in R
sentation of the size distribution of cluster sizes as a       version 3.6.1.
function of R, k, and the number of primary infections
in a cluster (as represented in equation of 6 of the sup-      Results
plement of [52]). This permits direct inference of the         Incidence data and reporting delays
maximum likelihood estimate and confidence interval            The COVID-19 epidemic curve by the date of reporting,
for R and k. In this manuscript, we modify the calcula-        stratified for local and imported incidence case counts,
tion of the likelihood of a cluster size to account for the    is shown in Fig. 4. It shows that the majority of the
possibility that truncation of case counts at a specific       imported cases are concentrated at the beginning of the
time point (i.e., March 17, 2020) may result in some           outbreak (January 23, 2020 to February 3, 2020) and
Tariq et al. BMC Medicine     (2020) 18:166                                                                                           Page 8 of 14

 Fig. 4 Local and imported incidence cases by date of reporting as of March 17, 2020. The solid blue line represents the cumulative case count
 for the COVID-19 cases in Singapore

after March 10, 2020, in Singapore, with an average of                     the scaling of growth parameter p at 0.7 (95% CI 0.4,
~12 new cases reported per day between March 1, 2020,                      1.0), the intrinsic growth rate r estimated at 0.6 (95% CI
and March 17, 2020 (Fig. 4). Out of 88 imported cases,                     0.3, 1.1) and parameter K estimating the wave size esti-
only 14 cases have been linked to secondary cases.                         mated at 95 (95% CI 56, 230). Because of the sub-
Meanwhile, a total of 159 autochthonous cases have                         exponential growth dynamics, the effective reproduction
been reported as of March 17, 2020, including 27 cases                     number followed a declining trend with the latest esti-
that are unlinked to any known transmission chains.                        mate at 0.7 (95% CI 0.3, 1.0) when α = 0.15 (Fig. 8). This
  The reporting-delay adjusted epidemic curve of local                     estimate was not sensitive to changes in parameter α.
cases by date of symptoms onset roughly displays two                         Based on the entire distribution of cluster sizes, we
small waves of transmission reflecting the occurrence of                   jointly estimated the overall reproduction number R and
asynchronous case clusters (Fig. 5). Moreover, the                         the dispersion parameter k as of March 17, 2020. Fitting
gamma distribution provided a reasonable fit to the dis-                   the negative binomial distribution to the cluster data in
tribution of reporting delays for all cases, with a mean                   the empirical distributions of the realizations during the
reporting delay at 6.4 days (95% CI 5.8, 6.9) (Fig. 6). We                 early stages of the outbreak in Singapore, the reproduction
also found that imported cases tend to have shorter                        number is estimated at 0.61 (95% CI 0.39, 1.02) after
reporting delays compared to local cases (mean 4.3 vs.                     adjusting for the truncation of the time series leading to
7.6 days, Wilcoxon test, p < 0.001), as imported cases                     the possibility that some infected cases might still cause
tend to be identified more quickly. The mean of report-                    new infections after March 17, 2020. The dispersion par-
ing delays for the six large clusters ranged from 4.8 to                   ameter is estimated at 0.11 (95% CI 0.05, 0.25) consistent
13.6 days (Fig. 7).                                                        with SARS-CoV-2 transmission heterogeneity.

Reproduction numbers                                                       Discussion
For the first small wave of transmission comprising the                    Overall, current estimates of transmission potential in
first 25 epidemic days, the delay-adjusted local incidence                 Singapore, based on two different data sources and different
curve displays sub-exponential growth dynamics with                        methods, suggest that temporary local transmission

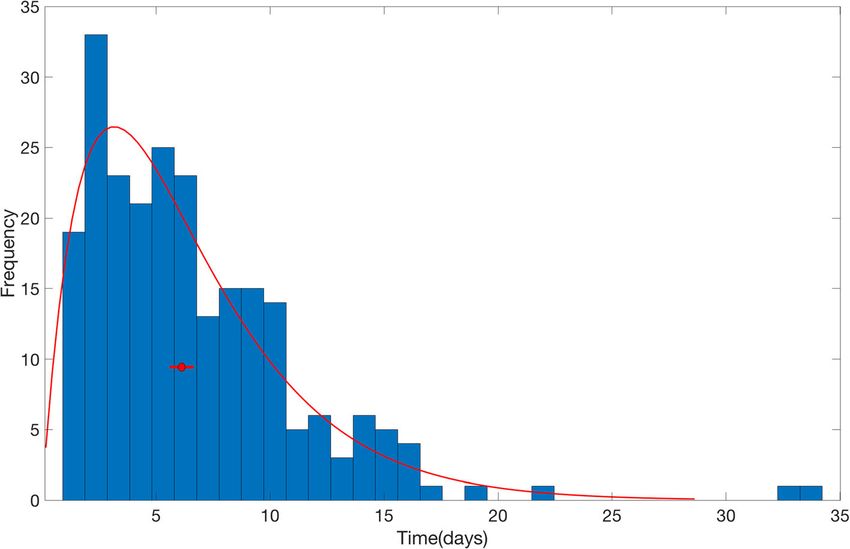
Tariq et al. BMC Medicine      (2020) 18:166                                                                                               Page 9 of 14

 Fig. 5 Reporting delay adjusted local incidence for the COVID-19 outbreak in Singapore as of March 17, 2020. Blue bars represent the raw
 incidence, red solid line represents the adjusted incidence, and red dotted lines represent the 95% lower and upper bound of the
 adjusted incidence

potential of SARS-CoV-2 has occurred in Singapore while                       case importations and initiation of local transmission in the
our most recent estimate of the effective reproduction                        region. While large-scale local transmission has not been
number is below the epidemic threshold of 1.0 whereas the                     reported in Singapore, the fact that asymptomatic and sub-
overall reproduction number derived from the distribution                     clinical cases are now well documented for COVID-19 [54]
of cluster sizes just barely crosses 1.0 (R = 0.61 (95% CI                    suggests that our estimates could be underestimated [55].
0.39, 1.02). Temporary sustained transmission in the begin-                   On the other hand, it is not clear if asymptomatic or sub-
ning of the epidemic can be partly attributed to multiple                     clinical cases are as infectious as symptomatic cases. Indeed,

 Fig. 6 The distribution of reporting delays for all cases as of March 17, 2020. The red line represents the fit of a gamma distribution to the data.
 The red circle represents the mean of gamma distribution and the horizontal line represents the 95% CI
Tariq et al. BMC Medicine      (2020) 18:166                                                                                             Page 10 of 14

 Fig. 7 Reporting delay distribution with mean (blue circle) and 95% CI (vertical lines) for each big cluster in Singapore; Grand Hyatt cluster, Yong
 Thai Hang cluster, Seletar Aerospace cluster, Wizlearn Technologies cluster, SAFRA Jurong cluster, and The Grace Assembly of God Church and
 Life Church and Missions cluster as of March 17, 2020

we have reported that multiple local cases have yet to be                    SARS-CoV-2 [56]. It is worth noting that imported cases
traced to existing transmission chains [9]. Additional data                  have minor contribution to secondary cases in Singapore,
collected during the course of the outbreak will help ob-                    with most of the imported cases dating back to the early
tain an improved picture of the transmission dynamics.                       phase of the epidemic and between March 10 and 17,
These findings emphasize the need to strengthen public                       2020. However, there are examples such as the Grant
health interventions including active case contact tracing                   Hyatt Singapore cluster and the Yong Thai Hang cluster
activities in countries with emerging transmission of                        that were linked to imported sources, and the original

 Fig. 8 The effective reproduction number reproduction number with 95% CI estimated by adjusting for the imported cases α = 0.15 during the
 first transmission wave by February 14, 2020. The effective reproduction number followed a declining trend with the latest estimate at 0.7 (95% CI
 0.3, 1.0) by February 14, 2020
Tariq et al. BMC Medicine      (2020) 18:166                                                                                            Page 11 of 14

sources had left Singapore before these local clusters                       transmission despite a subcritical reproduction num-
emerged [30].                                                                ber [68]. The lower estimate of the dispersion parameter
  Our Rt estimates for Singapore are substantially lower                     in our study also indicates significant transmission hetero-
than mean estimates reported for the COVID-19 epi-                           geneity in Singapore. Superspreading events of MERS-
demic in other parts of the world [57–65]. This indicates                    CoV and SARS-CoV associated with nosocomial out-
that containment efforts have a significant impact in                        breaks are well documented and driven largely by substan-
Singapore (Table 2). However, some differences in the                        tial diagnostic delays [16]. Although the average delay
reproduction numbers reported for the epidemic in                            from onset of symptoms to diagnosis/reporting for
China may result from different methods, differences in                      COVID-19 patients in Singapore is at 6.4 days and no
data sources and time periods used to estimate the                           superspreading events has been observed yet, the disper-
reproduction number. Similarly, a recent study has                           sion parameter, k < 1, indicates the probability of observ-
shown an average reporting delay of 6.1 days in China                        ing large clusters and the potential for superspreading
[66] which agrees with our mean estimate for cases in                        such as the SAFRA Jurong cluster [50, 68]. Therefore,
Singapore (6.4 days). Moreover, the scaling parameter                        public health measures enacted by public health author-
for growth rate (p) indicates a sub-exponential growth                       ities in Singapore that advise the public to avoid mass
pattern in Singapore, reflecting the effective isolation                     gatherings and confined places are crucial to prevent dis-
and control strategies in the region. This is consistent                     ease amplification events. However, the presence of
with a sub-exponential growth pattern for Chinese prov-                      asymptomatic cases in the community represents an on-
inces excluding Hubei (p ~ 0.67), as estimated by a re-                      going threat although it is not currently known if subclin-
cent study [67] whereas an exponential growth pattern                        ical cases are less infectious [20, 69]. This highlights the
was estimated for Hubei (p ~ 1.0) [67].                                      need for rapid testing of suspected cases to quickly isolate
  A previous study on the 2015 MERS outbreak in South                        those that test positive for the novel coronavirus. To
Korea reported substantial potential for superspreading                      achieve this goal, public health authorities in Singapore
Table 2 Timeline of COVID-19 epidemic in Singapore as of March 31, 2020 [9]
Date                        Event
1/23/2020                   First imported case of SARS-CoV-2 confirmed
1/23/2020–1/26/2020         Flights to Wuhan canceled by the Singaporean government
1/29/2020                   Travelers from Hubei denied entry in Singapore
2/1/2020                    New visitors with recent travel history to mainland China within the last 14 days denied entry into Singapore, or
                            transit through Singapore
2/1/2020                    Distribution of masks by the government
2/4/2020                    First cases of local SARS-CoV-2 transmission
2/6/2020                    First recovered patient in Singapore
2/7/2020                    Singapore’s outbreak response level upgraded from yellow to orange
2/17/2020                   Stay at home notices issued for 14 days for all Singapore residents and long-term work pass holders returning from China
2/23/2020                   Travel advisory extended to visitors from South Korea
2/25/2020                   Links between Grace Assembly of God cluster and The Life Church and Missions cluster established
2/26/2020                   Ban on visitors arriving from Cheongdo and Daegu in South Korea.
2/28/2020                   Singapore company Biotech introduced COVID-19 test kit for in vitro case diagnosis
3/4/2020                    Ban implemented on visitors arriving from South Korea, Iran, and Italy
3/10/2020                   600 passengers disembarked from the Italian cruise ship, Costa Fortuna and social distancing measures announced
3/12/2020                   First two deaths from COVID-19 reported
3/15/2020                   Ban implemented on visitors arriving from Italy, France, Spain, and Germany
3/18/2020                   Announcement made for all visitors entering Singapore from March 20, 2020 onwards to observe a 14-day quarantine
3/22/2020                   Ban implemented on all short term visitors arriving or transiting from Singapore from March 23, 2020 onwards
3/23/2020                   Announcement made for travelers including Singapore citizens who will be required to submit a health
                            declaration before entering Singapore
3/24/2020                   Social distancing measures reinforced including bans on large gatherings and social events
3/26/2020                   Punishments announced for individuals breaching the stay at home notices
Tariq et al. BMC Medicine (2020) 18:166 Page 12 of 14
are reactivating 900 general practitioner clinics [70]. While Acknowledgements
new clusters emerge in Singapore, some clusters including Not applicable.
the Yong Thai Hang cluster, Seletar Aerospace cluster, Authors’ contributions
Wizlearn Technologies, and the Grand Hyatt cluster have A.T, S.B., P.Y., and G.C. analyzed the data. A.T., Y.L, P.Y, and S.M. retrieved and
stabilized (no recent additional cases in most clusters). managed data; A.T and G.C wrote the first draft of the manuscript. All
authors contributed to writing and revising subsequent versions of the
The “Grace Assembly of God and the Life Church and manuscript. All authors read and approved the final manuscript.
Missions” cluster and the “SAFRA Jurong” cluster con-
tinue to be consolidated . Funding
G.C. is supported by NSF grants 1610429 and 1633381. G.C. and S.B. are
Beyond Singapore, COVID-19 cases are now being re- partially supported by R01 GM 130900.
ported in 204 countries including identifiable clusters in
many parts of the world [2, 71–74]. Moreover, Singapore Availability of data and materials
has also produced secondary chains of disease transmis- The data supporting the conclusion of this article is available from the
Ministry of Health, Singapore website [27].
sion beyond its borders [24]. Although Singapore has
been detecting and isolating cases with diligence, our Ethics approval and consent to participate
findings underscore the need for continued and sus- Not applicable.
tained containment efforts to prevent large-scale com- Consent for publication
munity transmission including nosocomial outbreaks. Not applicable.
Overall, the current situation in Singapore highlights the
Competing interests
need to investigate the imported, unlinked, and asymp-
G.C. is a Board Member for the journal. The other authors declare that they
tomatic cases that could be a potential source of second- have no competing interests.
ary cases and amplified transmission in confined
Author details
settings. Although Singapore has a world-class health 1
Department of Population Health Sciences, School of Public Health, Georgia
system including a highly efficient contact tracing mech- State University, Atlanta, GA 30303, USA. 2F. I. Proctor Foundation, University
anism in place that has prevented the outbreak from get- of California, San Francisco, CA, USA. 3Infectious Disease Prevention and
Control Branch, Public Health Agency of Canada, Ottawa, Canada.
ting out of control [24, 75], continued epidemiological 4
Epidemiology and Disease Control Division, Public Health Group, Ministry of
investigations and active case finding efforts are needed Health Singapore, Singapore, Singapore.
to contain the outbreak.
Received: 22 February 2020 Accepted: 4 May 2020
Our study is not exempt from limitations. First, the
outbreak is still ongoing and we continue to monitor the
transmission potential of COVID-19 in Singapore. Sec- References
ond, onset dates are missing for 12 cases, which were ex- 1. World Health Organization. Coronavirus disease 2019 (COVID-19) Situation
Report – 27. World Health Organization; 2020. Available from: https://www.
cluded from our analyses. Third, we cannot rule out that who.int/docs/default-source/coronaviruse/situation-reports/20200216-
additional cases will be added to existing clusters, which sitrep-27-covid-19.pdf?sfvrsn=78c0eb78_4.
may lead to underestimating the reproduction number 2. Worldometer. COVID-19 coronavirus / cases 2020. Available from: https://
www.worldometers.info/coronavirus/coronavirus-cases/.
based on the cluster size distribution. Fourth, some of 3. Nishiura H, Jung S, Linton N, Kinoshita R, Yang Y, Hayashi K, et al. The extent of
the cases are associated with generating secondary transmission of novel Coronavirus in Wuhan, China, 2020. J Clin Med. 2020;9(2):330.
chains in more than one cluster, which were included in 4. Tian H, Li Y, Liu Y, Kraemer M, Chen B, Cai J, et al. Early evaluation of Wuhan
City travel restrictions in response to the 2019 novel coronavirus outbreak.
the most relevant cluster. medRxiv. 2020:2020.01.30.20019844.
5. World Health Organization. Novel Coronavirus (2019-nCoV), Situation report -
1. 2020. Available from: https://www.who.int/docs/default-source/
Conclusion coronaviruse/situation-reports/20200121-sitrep-1-2019-ncov.pdf?sfvrsn=
This is a real-time study to estimate the evolving trans- 20a99c10_4. Accessed 25 Feb 2020.
mission potential of SARS-CoV-2 in Singapore. Our 6. World Health Organization. Situation Reports Coronavirus World Health
Organization 2020. Available from: https://www.who.int/emergencies/
current findings point to temporary sustained transmis- diseases/novel-coronavirus-2019/situation-reports. Accessed 20 Feb 2020.
sion of SARS-CoV-2, with our most recent estimate of 7. Olowski LJ. Coronavirus worse than reported – here's how China is catching
the effective reproduction number lying below 1.02. up to reality. Fox News; 2020.
8. Kottasová I. China's coronavirus numbers highlight the challenges of an
These estimates highlight the significant impact of con- evolving epidemic. CNN; 2020.
tainment efforts in Singapore while at the same time 9. Ministry Of Health. News Highlights Ministry of Health Singapore. Available
suggest the need to maintain social distancing and active from: https://www.moh.gov.sg/news-highlights/. Accessed 31 Mar 2020.
10. Ang D. The Big Story: 92 Singaporeans evacuated from Wuhan; Hikikomori
case finding efforts to stomp out all active or incoming in Singapore. The Straits Times; 2020.
chains of transmission. 11. Tan A. Coronavirus: Flight with 174 Singaporeans evacuated from Wuhan
lands at Changi airport on Sunday morning. The Straits Times; 2020.
Abbreviations 12. Ministry Of Health. Confirmed cases of local transmission of novel coronavirus
COVID-19: Coronavirus Disease 2019; MERS: Middle Eastern Respiratory infection in Singapore Minstry of Health Singapore. Available from: https://www.
Syndrome; SARS: Severe acute respiratory syndrome; SARS-CoV-2: Severe moh.gov.sg/news-highlights/details/confirmed-cases-of-local-transmission-of-
acute respiratory syndrome-related coronavirus 2 novel-coronavirus-infection-in-singapore. Accessed 20 Feb 2020.Tariq et al. BMC Medicine (2020) 18:166 Page 13 of 14
13. Ministry Of Health. Five more cases discharged, three new cases of covid-19 patterns and final burden of Zika epidemics. PLoS Curr. 2016;8:ecurrents.
infection confirmed Ministry of Health. Available from: https://www.moh. outbreaks.f14b2217c902f453d9320a43a35b583.
gov.sg/news-highlights/details/five-more-cases-discharged-three-new-cases- 40. Shanafelt DW, Jones G, Lima M, Perrings C, Chowell G. Forecasting the 2001
of-covid-19-infection-confirmed. Accessed 20 Feb 2020. foot-and-mouth disease epidemic in the UK. Ecohealth. 2018;15(2):338–47.
14. Ministry Of Health. Two more cases discharged; five new cases of COVID-19 41. Pell B, Kuang Y, Viboud C, Chowell G. Using phenomenological models for
infection confirmed. Ministry of Health; 2020. Available from: https://www. forecasting the 2015 Ebola challenge. Epidemics. 2018;22:62–70.
moh.gov.sg/news-highlights/details/two-more-cases-discharged-five-new- 42. Chowell G, Luo R, Sun K, Roosa K, Tariq A, Viboud C. Real-time forecasting
cases-of-covid-19-infection-confirmed. Accessed 6 Mar 2020. of epidemic trajectories using computational dynamic ensembles.
15. Secon H. Nearly 3,400 Chinese healthcare workers have gotten the Epidemics. 2020;30:100379.
coronavirus, and 13 have died. Business Insider; 2020. 43. Nishiura H, Linton NM, Akhmetzhanov AR. Serial interval of novel
16. Chowell G, Abdirizak F, Lee S, Lee J, Jung E, Nishiura H, et al. Transmission coronavirus (COVID-19) infections. Int J Infect Dis. 2020;93:284-6.
characteristics of MERS and SARS in the healthcare setting: a comparative 44. You C, Deng Y, Hu W, Sun J, Lin Q, Zhou F, et al. Estimation of the time-
study. BMC Med. 2015;13(1):210. varying reproduction number of COVID-19 outbreak in China. Int J Hyg
17. Gopalakrishna G, Choo P, Leo Y, Tay B, Lim Y, Khan A, et al. SARS transmission Environ Health. 2020:113555.
and hospital containment. Emerg Infect Dis. 2004;10(3):395–400. 45. Nishiura H, Chowell G. The Effective Reproduction Number as a Prelude to
18. Lim J. Coronavirus: Doctors, staff and patients to restrict movements to Statistical Estimation of Time-Dependent Epidemic Trends. Springer D,
within one hospital. The Straits Times Singapore; 2020. editor 2009. 103-12 p. Mathematical and Statistical Estimation Approaches
19. Aravindan A, Geddie J. Singapore lifts virus alert to SARS level, sparking in Epidemiology. ISBN 978-90-481-2313-1.
panic buying. Rueters; 2020. 46. Paine S, Mercer G, Kelly P, Bandaranayake D, Baker M, Huang Q, et al.
20. Mizumoto K, Kagaya K, Zarebski A, Chowell G. Estimating the asymptomatic Transmissibility of 2009 pandemic influenza A(H1N1) in New Zealand: effective
proportion of coronavirus disease 2019 (COVID-19) cases on board the reproduction number and influence of age, ethnicity and importations. Euro
Diamond Princess cruise ship, Yokohama, Japan, 2020. Euro Surveill. 2020; surveill. 2010;15(24). https://doi.org/10.2807/ese.15.24.19591-en.
25(10):2000180. 47. Nishiura H, Roberts MG. Estimation of the reproduction number for 2009
21. Nishiura H, Kobayashi T, Miyama T, Suzuki A, Jung SM, Hayashi K, et al. pandemic influenza a(H1N1) in the presence of imported cases.
Estimation of the asymptomatic ratio of novel coronavirus infections Eurosurveillance. 2010;15(29):19622.
(COVID-19). Int J Infect Dis. 2020;94:154-5. 48. Chowell G. Fitting dynamic models to epidemic outbreaks with quantified
22. Hu Z, Song C, Xu C, Jin G, Chen Y, Xu X, et al. Clinical characteristics of 24 uncertainty: a primer for parameter uncertainty, identifiability, and forecasts.
asymptomatic infections with COVID-19 screened among close contacts in Infect Dis Model. 2017;2(3):379–98.
Nanjing, China. Sci China Life Sci. 2020;63(5):706-11. 49. Blumberg S, Lloyd-Smith JO. Inference of R0 and transmission heterogeneity from
23. Sim D. Coronavirus: why did Singapore have more cases than Hong Kong – the size distribution of stuttering chains. PLoS Comput Biol. 2013;9(5):e1002993.
until now? This Week in Asia; 2020. 50. Lloyd-Smith JO, Schreiber SJ, Kopp PE, Getz WM. Superspreading and the
24. Vaswani K. Coronavirus: Why Singapore is so vulnerable to coronavirus effect of individual variation on disease emergence. Nature. 2005;438(7066):
spread. BBC News; 2020. 355–9.
25. Diekmann O, Heesterbeek JAP. Mathematical Epidemiology of Infectious Diseases: 51. Blumberg S, Lloyd-Smith JO. Comparing methods for estimating R0 from the
Model Building, Analysis and Interpretation. 1st ed. Wiley; 2000. ISBN 0-471-49241-8. size distribution of subcritical transmission chains. Epidemics. 2013;5(3):131–45.
26. Anderson RM, May RM. Infectious Diseases of Humans. Oxford: Oxford 52. Blumberg S, Funk S, Pulliam JRC. Detecting differential transmissibilities that
Univeristy Press; 1991. ISBN 978-0198540403. affect the size of self-limited outbreaks. PLoS Pathog. 2014;10(10):e1004452.
27. Ministry Of Health. Data retrieved from updates on COVID-19, Press Release. 53. Bolker BM. Ecological models and data in R. Press PU, editor 2008.
Ministry of Health Singapore; 2020. Available from: https://www.moh.gov. 54. The Novel Coronavirus Pneumonia Emergency Response Epidemiology
sg/covid-19. Accessed 29 Mar 2020. Team. The Epidemiological Characteristics of an Outbreak of 2019 Novel
28. Khalik S. Coronavirus in Singapore: of the 50 cases so far, local cases exceed Coronavirus Diseases (COVID-19) — China, 2020[J]. China CDC Weekly. 2020;
imported ones. The Straits Times; 2020. 2(8):113-22. https://doi.org/10.46234/ccdcw2020.032.
29. CNA. Coronavirus cases in Singapore: trends, clusters and key numbers to 55. Belluz J. Why the coronavirus outbreak might be much bigger than we
watch. CNA; 2020. know. Vox; 2020.
30. Wong L. Coronavirus: Full recovery for all three local cases linked to Grand 56. Pung R, Chiew CJ, Young BE, Chin S, Chen MIC, Clapham HE, et al.
Hyatt event. The Straits Times; 2020. Investigation of three clusters of COVID-19 in Singapore: implications for
31. MalayMail. COVID-19: SAF regular among three new victims in Singapore as surveillance and response measures. Lancet. 2020;395(10229):1039–46.
Grace Assembly of God cluster grows to 18 cases. Malaymail; 2020. 57. Shen M, Peng Z, Xiao Y, Zhang L. Modelling the epidemic trend of the 2019
32. Yan P, Chowell G. Quantitative methods for infectious disease outbreak novel coronavirus outbreak in China. bioRxiv.2020.01.23.916726.
investigations. Springer; 2019. ISBN 978-3-030-21923-9. 58. Mizumoto K, Kagaya K, Chowell G. Early epidemiological assessment of the
33. Yan P. Estimation for the infection curves for the spread of Severe Acute transmission potential and virulence of 2019 Novel Coronavirus in Wuhan
Respiratory Syndrome (SARS) from a back-calculation approach Center for City: China, 2019–2020. medRxiv. 2020:2020.02.12.20022434.
Discrete Mathematics & Theoratical Computer Science Founded as a 59. Zhao S, Lin Q, Ran J, Musa SS, Yang G, Wang W, et al. Preliminary estimation
National Science Foundation Science and Technology Center 2018. of the basic reproduction number of novel coronavirus (2019-nCoV) in
Available from: http://archive.dimacs.rutgers.edu/Workshops/Modeling/ China, from 2019 to 2020: a data-driven analysis in the early phase of the
slides/Yan.pdf. Accessed 15 Feb 2020. outbreak. Int J Infect Dis. 2020;92:214–7.
34. Lawless JF. Adjustments for reporting delays and the prediction of occurred 60. Liu T, Hu J, Kang M, Lin L, Zhong H, Xiao J, et al. Transmission dynamics of
but not reported events. Can J Stat. 1994;22(1):15-31. 2019 novel coronavirus (2019-nCoV). bioRxiv.2020.01.25.919787.
35. Taylor GC. Claims Reserving In Non Life Insurance: Elsevier; 1985. ISBN 978- 61. Wu JT, Leung K, Leung GM. Nowcasting and forecasting the potential
0444878465. domestic and international spread of the 2019-nCoV outbreak originating in
36. Tariq A, Roosa K, Mizumoto K, Chowell G. Assessing reporting delays and Wuhan, China: a modelling study. The Lancet. 2020;395(10225):689-97.
the effective reproduction number: the Ebola epidemic in DRC, May 2018- 62. Read JM, Bridgen JR, Cummings DA, Ho A, Jewell CP. Novel coronavirus
January 2019. Epidemics. 2019;26:128–33. 2019-nCoV: early estimation of epidemiological parameters and epidemic
37. Kalbfleisch JD, Lawless JF. Estimating the incubation time distribution and predictions. medRxiv. 2020:2020.01.23.20018549.
expected number of cases of transfusion-associated acquired immune 63. Li Q, Guan X, Wu P, Wang X, Zhou L, Tong Y, et al. Early Transmission
deficiency syndrome. Transfusion. 1989;29(8):672–6. Dynamics in Wuhan, China, of Novel Coronavirus–Infected Pneumonia. N
38. Nishiura H, Chowell G, Heesterbeek H, Wallinga J. The ideal reporting Engl J Med. 2020:382:1199-207. https://doi.org/10.1056/NEJMoa2001316.
interval for an epidemic to objectively interpret the epidemiological time 64. Sanche S, Lin YT, Xu C, Romero-Severson E, Hengartner N, Ke R. High
course. J R Soc Interface. 2010;7(43):297–307. contagiousness and rapid spread of severe acute respiratory syndrome
39. Chowell G, Hincapie-Palacio D, Ospina J, Pell B, Tariq A, Dahal S, et al. Using coronavirus 2. Emerg Infect Dis. 2020. https://doi.org/10.3201/eid2607.
phenomenological models to characterize transmissibility and forecast 200282.Tariq et al. BMC Medicine (2020) 18:166 Page 14 of 14
65. Shim E, Tariq A, Choi W, Lee Y, Chowell G. Transmission potential and
severity of COVID-19 in South Korea. Int J Infect Dis. 2020;93:339-44.
66. Kucharski AJ, Russell TW, Diamond C, Liu Y, Edmunds J, Funk S, et al. Early
dynamics of transmission and control of COVID-19: a mathematical
modelling study. Lancet Infect Dis. 2020;20(5):553-8.
67. Roosa K, Lee Y, Luo R, Kirpich A, Rothenberg R, Hyman JM, et al. Real-time
forecasts of the COVID-19 epidemic in China from February 5th to February
24th, 2020. Infect Dis Model. 2020;5:256–63.
68. Kucharski AJ, Althaus CL. The role of superspreading in Middle East
respiratory syndrome coronavirus (MERS-CoV) transmission. Eurosurveillance.
2015;20(25):21167.
69. Sim D, Xinghui K. Singapore: nine new coronavirus cases, no plans to raise
outbreak alert to red. This Week in Asia; 2020.
70. Chang N, Yong M. Public health preparedness clinics reactivated to reduce
risk of COVID-19 spread. CNA; 2020.
71. Marcus I. Chronology: Germany and Covid 19 (‘Coronavirus’). The Berlin
Spectator; 2020.
72. Rueters. Germany Confirms Seventh Coronavirus Case. Rueters; 2020.
73. McCurry J. Japan reports first coronavirus death as 44 more cases confirmed
on cruise ship. The Guardian; 2020.
74. Woods A. 44 new coronavirus cases reported on quarantined Diamond
princess cruise. Newyork Post; 2020.
75. Ng Y, Li Z, Chua YX, Chaw WL, Zhao Z, Er B, et al. Evaluation of the
Effectiveness of Surveillance and Containment Measures for the First 100
Patients with COVID-19 in Singapore — January 2–February 29, 2020.
MMWR Early Release; March 20, 2020. Centers for Disease Control and
Prevention.
Publisher’s Note
Springer Nature remains neutral with regard to jurisdictional claims in
published maps and institutional affiliations.You can also read