REAL-TIME TSUNAMI INUNDATION FORECAST FOR THE PACIFIC COAST OF NICARAGUA
←
→
Page content transcription
If your browser does not render page correctly, please read the page content below

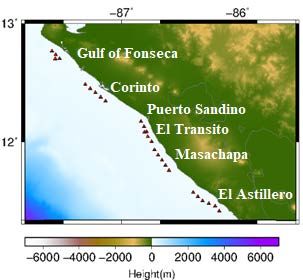
REAL-TIME TSUNAMI INUNDATION FORECAST
 FOR THE PACIFIC COAST OF NICARAGUA

Ulbert Grillo Rodriguez ∗ Supervisor: Yuichiro TANIOKA∗∗
MEE17719

 ABSTRACT

We constructed a pre-computed tsunami database for six areas located along the Pacific coast of
Nicaragua, which could be categorized as tsunami-susceptible areas. The database was created from a
set of tsunami waveforms and inundation models from several fault model scenarios of Mw 7.0 to Mw
8.2 with an increment of 0.2 on the magnitude scaling. We evaluated the reliability of Near-field
Tsunami Inundation Forecast (NearTIF) algorithm following the methodology suggested by Gusman et
al. (2014) using the 1992 Nicaragua tsunami earthquake (Mw 7.6). The linear tsunami propagation and
nonlinear inundation computations were performed by using TUNAMI code developed by Tohoku
University. Finally, we applied the NearTIF algorithm to evaluate the calculation time of the best
solution for tsunami inundation forecasting in the areas. We adopted 70 fault model scenarios (FMS)
and found tsunami waveforms from the database which share similarities with those from numerical
forward modeling (NFM) of the 1992 El Transito-Masachapa tsunami earthquake. We extracted the
inundation map associated with the best FMS from the inundation database for the comparison with the
inundation area generated from the NFM.

Keywords: Tsunami waveform database, Tsunami inundation database, Real-time inundation forecast,
1992 tsunami earthquake.

 1. INTRODUCTION

As Charles Lyell said in 1832, nor should we omit to mention the havoc on low coasts during
earthquakes. With the goal to develop the Central American Tsunami Advisory Center (CATAC)
included in the framework of the Intergovernmental Oceanographic Commission of the UNESCO, the
Pacific Tsunami Warning and Mitigation System (PTWS) and Warning System for the Caribbean and
Adjacent Regions (CARIBE EWS), a set of procedures was developed in INETER since 1996 to support
regional monitoring and deal with tsunamis with the target of protecting lives and properties for benefits
of all Central American countries. In this study we apply the NearTIF method suggested by Gusman et
al. (2014), in order to develop a real-time tsunami inundation forecast for Nicaragua. The target areas
correspond to Gulf of Fonseca, Corinto, Puerto Sandino, El Transito, Masachapa and El Astillero on the
Pacific coast of Nicaragua. We used the 1992 El Transito-Masachapa tsunami earthquake as the case
study.

 2. DATA

Bathymetry data from General Bathymetry Chart of the Oceans, (GEBCO) 2014 (Weatherall et al.,
2015) with a resolution of 30 arc-sec was used to conduct tsunami propagation simulations. Topography
data from the Shuttle Radar Topography Mission (Jarvis et al., 2008) with a resolution of 3 arc-sec
(SRTM3) was also used to cover the computational domain of the areas.

∗
 Nicaraguan Institute of Territorial Studies, INETER, General Directorate of Geophysics, Nicaragua.
∗∗
 Professor, Faculty of Science, Institute of Seismology and Vulcanology, Hokkaido University, Japan.

 1
3. METHODOLOGY

3.1. Near Field Tsunami Inundation Forecasting (NearTIF) Algorithm

The methodology was constructed by Gusman et al. (2014), which is based on the idea that similar
tsunami waveforms reaching the nearshore sites can produce, inundation in coastal areas with similar
characteristics independent of their arrival times, location or source mechanisms of different earthquakes.

3.2. Virtual Observation Points and Fault Model Scenarios

We set reference points along the subduction zone off Nicaraguan Pacific coast and determine seismic
parameters that define the fault plane for each model. Virtual Observation Points (VOPs) are selected
along the Pacific coast (Figure 1) to precompute tsunami waveform database implementing linear waves
for tsunami propagation. Figure 2 shows the fault model scenarios for the tsunami computation from
Mw 7.0 to 8.2 with an increment of 0.2 on the moment magnitude (seven magnitudes). According to
Tanioka et al. (2017), appropriate fault length scaling relationships is provided by the equation logL = -
2.28+0.55Mw from Blaser et al. (2010) due to our events generated by thrust faults, where Mw
corresponds to the moment magnitude and L is a length. Fault width is obtained from the equation logW
= -1.8+0.45Mw, also proposed by Blaser et al. (2010). A rigidity (µ) curve which is dependent from
depth proposed by Bilek and Lay (1999) is used to set appropriate slip value (D) for the equation of
seismic moment (Mo) D = Mo/μ(L*W) suggested by Kanamori (1977).

 Figure 2. Fault model scenarios for tsunami.
 Figure 1. Virtual observation points (red computations. The smaller black rectangle
 triangles) along the coast. represents an Mw 7.0 fault model, and the greater
 red one illustrates an Mw 8.2 fault model. Orange
 circles represent the reference source points along
 trench and closer to coast.

3.3. Tsunami Numerical Simulation

Tsunami waveforms at VOPs and the pre-computed inundation were created by using the TUNAMI
code (Yanagisawa, 2018) which solves the linear and non-linear equations with a finite differential
scheme. The equations of continuity and momentum are the followings:

 2
 1
 + [ + ( )] = 0 (1)
 t

 1 2 1 2
 + + + � �+ 7 √ 2 + 2 = 0 (2)

 3

 1 2 1 2 2

 + ( ) + �
 � + �

 � + 7 √ + 2 = 0 (3)
 3

where M and N correspond to flux charge along the coordinate parameters, D represents total water
depth of h+ , h corresponds to the water depth, is water elevation, t is the time, λ is longitude and θ
represents co-latitude, g is gravitational acceleration, R the earth’s radius, n corresponds to Manning’s
coefficient. We selected a constant time step value (dt) of 0.5 sec. Bottom friction is considered using
Manning’s coefficient, a uniform value on the grid system equivalent to 0.0025 m-1/3 s is adopted (Linsey
and Franzini, 1979). We made four grids named D1 to D4 for the areas where the largest grid (D1)
contemplates all the computational domains, includes the tsunami source model and the target areas.
GEBCO 2014 Grid data is implemented for making bathymetry and topography. We subsample and
interpolate D1 to create grids for D2 with a spacing of 20 arc-sec. We use a 6.67 arc-sec for D3. The
finest domain was created adding GEBCO 2014 bathymetry with SRTM3 interpolated to 2.22 arc-sec
interval to improve the model and inundation simulation.

3.4. Computing Tsunami Waveform and Tsunami Inundation Database

Tsunami waveforms at VOPs in front of the regions were computed considering the 1992 El Transito-
Masachapa tsunami earthquake. Databases were created by storing the pre-computed tsunami
waveforms and maximum tsunami inundation from 70 fault model scenarios.

 4. RESULTS AND DISCUSION

4.1. Calculation Times for Forward Modeling and NearTIF Method

The first step is the calculation of waveforms at VOPs. The NearTIF algorithm looks for the scenario
with the best fit among all potential solutions stored in the database (with the minimum root mean square
error, RMSE), which provides the most similar waveforms gotten from linear wave calculation. The
calculation time to get the inundation model through a numerical forward model for six hours takes
5,700 sec (for each area). After the earthquake occurs, we register the first arrival of a tsunami at tide
gauge stations in 2,000 sec. Therefore, there is not enough time to issue an alert based on the numerical
forward calculation of inundation.

4.2. Comparison of Tsunami Inundation Models for Target Regions

4.2.1. Puerto Sandino
Figures 3 shows the results from the best FMS for Puerto Sandino. The maximum inundation height and
the maximum inundation distance reached 11.846 m and 1,600.976 m respectively. Figure 4 shows the
results from NFM where the maximum inundation height and inundation distance reached 13.132 m and
1,705.495 m respectively. Figure 5 shows the comparison of waveforms from NFM (orange) and the
best FMS, (blue) from the tsunami waveform database. The maximum tsunami amplitude was measured
in 5.8 m at VOP3 for the best FMS, in comparison with 6.1 m registered in the NFM.

 3
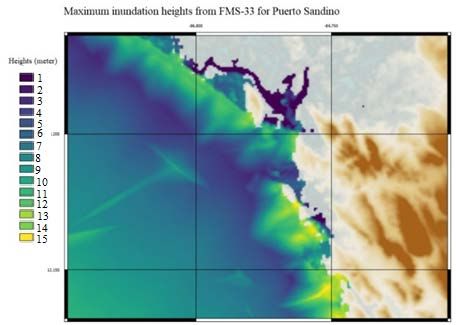
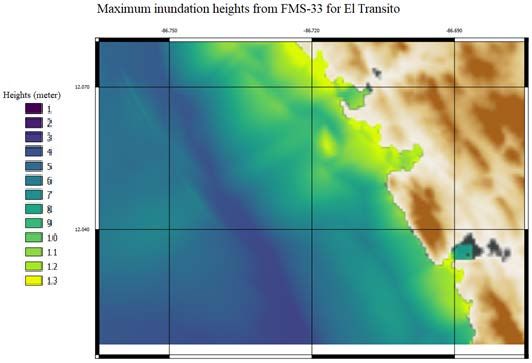
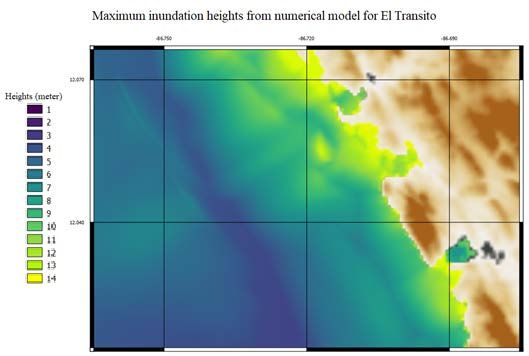
Figure 3. Inundation map from the best FMS Figure 4. Inundation map from the NFM for Puerto
 for Puerto Sandino. Sandino.

 Figure 5. Comparison of waveforms from the NFM (orange) and the best FMS, (blue) from the
 tsunami waveform database for Puerto Sandino.

4.2.2. El Transito
Figures 6 and 7 illustrate the resultant inundation models for El Transito. The best FMS shows the
maximum height reaching 12.783 m and a maximum inundation distance of 918.378 m. These results
are consistent with those gotten through NFM corresponding to 14.145 m as the maximum inundation
height and the maximum inundation distance showing a similar measure of 990.321 m. Regarding the
maximum tsunami amplitude (Figure 8), we measured 5.6 m on VOP3 for the waveforms generated
from the best FMS, in comparison with 6 m registered in the NFM.

 Figure 6. Inundation map obtained from FMS-33 Figure 7. Inundation map obtained from the NFM
 for El Transito. for El Transito.

 4

Figure 8. Same as Figure 5, but for El Transito.

4.3. Optimization of Time Shifts for Target Regions

The optimization of a time shift allows us to find waveforms from the database which share similarities
with those signals from the reference event (real or hypothetical case). The optimum time shift for the
minimization of the root means square error is -25 sec for El Transito, -80 sec for Corinto, -40 sec for
Puerto Sandino, -5 sec for Masachapa, -105 sec for Gulf of Fonseca and +75 sec for El Astillero. We
can notice variation regarding the time shift on each area, whose nearest points to the source had the
smallest difference regarding the reference waveform. These variations result from the location of the
fault and its constitution (pure thrust fault) because the best FMS and the reference model come from
different source models, but the waveforms from those models share similarities. Therefore, under the
considered assumption, both source models have similar inundation areas. Comparing the results of
inundation from NFM and those from the best FMS for each area, it is possible to appreciate similarities.

4.4. Comparison with the Tsunami Heights from Field Survey

We interpreted tsunami height values surveyed by Abe et al. (1993) and Satake (1995) along the
Nicaraguan Pacific coast and compared them with computed ones at six locations. For Gulf of Fonseca,
Corinto, Masachapa and El Astillero, the results are consistent, showing some similarities. For El
Transito and Puerto Sandino, the results from the tsunami numerical simulation and the observed
tsunami heights or run-up heights have variations regarding the surveyed data. Tsunami inundation
obtained for El Transito from NFM is larger than the observed area.

 5. CONCLUSION

We carried out the tsunami simulations and applied the NearTIF method to forecast a real-time tsunami
inundation for Nicaragua, taking in consideration six areas along the coast cataloged as prone areas. We
used 70 fault model scenarios from Mw 7.0 to Mw 8.2 with an increment of 0.2 in magnitude to create
a tsunami waveforms and inundation database. We tried the efficiency of the NearTIF algorithm for the
case of study of the 1992 El Transito-Masachapa tsunami earthquake measured at 7.6 in moment
magnitude scale. The NearTIF assessment indicated that we required much less time (around 30 sec) to
get a tsunami inundation forecast for each area, compared with direct numerical forward modeling for
the event on each area (5,700 sec). The NearTIF employs a few seconds for searching the best scenario,
whereby this methodology offers the possibility of issuing a tsunami warning in minimum time. The
prone areas corresponded to El Transito, Puerto Sandino and Masachapa, where the maximum
inundation heights and maximum inundation distances were obtained. We conclude that the results from
the NearTIF algorithm affirmed its ability for the forecast purpose. Because it provides time to
Nicaraguan Institute of Territorial Studies and the National System of Disaster Mitigation for warning
issuance and evacuation to inhabitants of the affected areas. It also allows updating the inundation map
through the fast estimation of tsunami inundation parameters during a tsunamigenic earthquake.

 5
6. RECOMENDATION

The implementation of a tide gauge network along the Nicaragua Pacific coast is useful to validate the
tsunami warning system and to get real observation points for detection of waveforms from potential
tsunamigenic earthquakes. The database updating of waveforms and inundation areas becomes an
important point for the system improvement also the database expansion of seismic events by
considering events from Mw 6.5 to Mw 9.0. We need to update the tsunami waveform and inundation
database through the inclusion of new areas located on the Pacific coast using more accurate bathymetry
and topography data. We also need more capacity for the seismological shift participants about the
methodology regarding its implementation, tide gauge stations acquisition and installation.

 ACKNOWLEDGEMENTS

I would like to express my sincere gratitude to Dr. Yuichiro Tanioka of Hokkaido University for
supervising me and giving me very useful advice and suggestions during my individual study, the goals
were reached thanks to him. I extend my gratitude to Dr. Yushiro Fujii of Building Research Institute,
IISEE for his support, and extra-official supervision during this research. Further, I am extremely
thankful to my parents, my wife and daughter for their unconditional support and love, therefore this
study is for them. Finally, infinite thanks are given to the almighty, because we are nothing without him.

 REFERENCES

Abe, K., Tsuji, Y., Imamura, F., Katao, H., Iio, Y., and Estrada, F., 1993, Field survey of the Nicaragua
 earthquake and tsunami of September 2, 1992. Earthquake Research Institute, University of
 Tokyo, 68, 23–70. (in Japanese).
Bilek, L., and Lay, T., 1999, Rigidity variations with depth along interplate megathrust faults in
 subduction zones. Nature, 400(6743), 443–446.
Blaser, L., Krüger, F., Ohrnberger, M., and Scherbaum, F., 2010, Scaling relations of earthquake source
 parameter estimates with special focus on subduction environment. Bulletin of the Seismological
 Society of America, 100(6), 2914–2926.
Gusman, A. R., Y. Tanioka, B. T. MacInnes, and H. Tsushima, 2014, A methodology for near-field
 tsunami inundation forecasting: Application to the 2011 Tohoku tsunami, J. Geophys. Res. Solid
 Earth, 119, 8186–8206, doi:10.1002/2014JB010958.
Jarvis, A., Reuter, H., Nelson, A., Guevara, E., 2008, Hole-filled seamless SRTM data Version 4. In
 CGIAR Consortium for Spatial Information (CGIAR-CSI) (2008) Key: citeulike:14258097.
Kanamori, H., 1977, The energy release in great earthquakes, J. Geophys. Res. Solid Earth, Volume 82,
 Issue 20, 2981–2987, doi:10.1029/JB082i020p02981.
Linsey, R. K. and J. B. Fransini, Eater–Resources Engineering, 3rd. Edition, MacGrawh–Hill
 Kogakusha Ltd., 716p., 1979.
Satake, K., 1995, Linear and nonlinear computations of the 1992 Nicaragua earthquake tsunami. Pure
 and Applied Geophysics PAGEOPH 144 (3-4): 455-470. http://hdl.handle.net/2027.42/43193.
Tanioka, Y., Arguello, G., Gusman, A., and Fujii, Y., 2017, Method to determine appropriate source
 models of large earthquakes including tsunami earthquakes for tsunami early warning in Central
 América. Pure appl. Geophys. 174, 3237-3248, doi: 10.1007/s00024-017-1630-y.
Weatherall, P., Marks, K., Jakobsson, M., Schmitt, T., Tani, S., Arndt, J., Rovere, M., Ferrini, V., Wigley,
 R., 2015, A new digital bathymetric model of the world’s oceans. AGU100. Earth and Space Science,
 Volume 2, Issue 8, doi: 10.1002/2015EA000107.
Yanagisawa, H., 2018, Lecture notes on Numerical simulation of tsunami inundation and its application,
 IISEE/BRI.

 6
You can also read