Recent surging event of a glacier on Geladandong Peak on the Central Tibetan Plateau
←
→
Page content transcription
If your browser does not render page correctly, please read the page content below
Journal of Glaciology                                Recent surging event of a glacier on
                                                             Geladandong Peak on the Central Tibetan
                                                             Plateau
        Letter                                               Junli Xu1        , Donghui Shangguan2                     and Jian Wang1
        Cite this article: Xu J, Shangguan D, Wang J         1
                                                              College of Urban and Environmental Sciences, Yancheng Teachers University, Yancheng 224002, China and 2State
        (2021). Recent surging event of a glacier on
                                                             Key Laboratory of Cryospheric Sciences (SKLCS), Northwest Institute of Eco-Environment and Resources, Chinese
        Geladandong Peak on the Central Tibetan
                                                             Academy of Sciences, Lanzhou 730000, China
        Plateau. Journal of Glaciology 67(265),
        967–973. https://doi.org/10.1017/jog.2021.86
                                                             Abstract
        Received: 2 December 2020
        Revised: 27 June 2021                                Few surges on the Central Tibetan Plateau have been reported. Here, we report observations of a
        Accepted: 28 June 2021                               recent surging event of the Gangjiaquba Glacier in the Geladandong Peak region using surface
        First published online: 27 July 2021                 velocity and morphology changes that were extracted from Landsat MSS/TM/ETM+/OLI images
                                                             obtained from 1973 to 2019. The results reveal that the active surge of this glacier initiated at the
        Key words:
        Geladandong Peak; glacier surging; surface           end of summer in 2014 and terminated in 2016. The surge resulted in a total advance of 500 ±
        velocity changes                                     11.2 m and many fresh crevasses in the surging zone. The maximum velocity was 1100 m a−1
                                                             during the active surge phase, which is much smaller than those observed in Karakoram but simi-
        Author for correspondence:                           lar to observations in West Kunlun.
        Junli Xu, E-mail: xujunli@lzb.ac.cn

                                                             1. Introduction
                                                             Surge-type glaciers account for only ∼1% of all global glaciers, but they tend to cluster in a few
                                                             regions (Sevestre and Benn, 2015). Usually, dozens of such glaciers develop in the same arctic
                                                             or alpine region (Benn and Evans, 2010). This brings the challenge to reconstruct or forecast
                                                             glaciers response to climate change (Yde and Paasche, 2010).
                                                                 Two well-known theories about the trigger mechanism of surging have been formed based
                                                             on field observations: hydrological control and thermal control (Kamb and others, 1985;
                                                             Clarke and others, 1986; Murray and others, 2003). Hydrologically controlled surges are typ-
                                                             ical for glaciers in Alaska (Kamb, 1987), while a thermally controlled meltwater mechanism
                                                             might explain some surges in Svalbard (Fowler and others, 2001; Murray and others, 2003).
                                                             However, a recent theory for surging behaviour includes both temperate and polythermal gla-
                                                             cier surges and is based on coupled mass and enthalpy budgets (Sevestre and Benn, 2015; Benn
                                                             and others, 2019). However, the mechanism of surges in most regions are still ambiguous,
                                                             especially that of glacier surges in areas of the Tibetan Plateau, like the Karakoram
                                                             Mountains, Muztag Peak in Pamir and West Kunlun Mountains (Paul, 2020).
                                                                 There is especially limited knowledge about how glaciers surge on the central Tibetan
                                                             Plateau. Only tens of surge-type glaciers in West Kunlun and Central Kunlun have informa-
                                                             tion available about the surface velocity changes of the surging phase (Yasuda and Furuya,
                                                             2015; Chudley and Willis, 2018; Fu and others, 2019; Gao and others, 2021; King and others,
                                                             2021). There may even be more surge-type glaciers that have not been reported. Wei and
                                                             others (2014) concluded that ∼890 (1.5%) potential surge-type glaciers were located in the
                                                             interior area of the Tibetan Plateau during the period of 1970–2009. Thus, more observations
                                                             on the surging glaciers on the Tibetan Plateau are required.
                                                                 Geladandong Peak in the Central Tibetan Plateau is the highest mountain in the source
                                                             region of the Yangtze River (Figs 1a, b). There were 19 surge-type glaciers identified based
                                                             on elevation and velocity changes analysis (Yan and others, 2019; Gao and others, 2021;
                                                             King and others, 2021).
                                                                 Gangjiaquba Glacier (33.46°N, 91.17°E, GLIMS ID G091171E33460N) originates from
                                                             Geladandong Peak (Figs 1b, c). In 1968, it covered an area of 37.44 ± 1 km2, had an average
                                                             thickness of 146 ± 3 m and descended across a large altitudinal range of 6621–5300 m a.s.l.
                                                             (Pu, 1994). There is a long medial moraine between tributaries 2 and 3 but the glacier is almost
        © The Author(s), 2021. Published by                  devoid of debris except for this medial moraine. Gangjiaquba Glacier was reported as the largest
        Cambridge University Press. This is an Open          shrinkage in area and recession in length of all glaciers in Geladandong region, with five main
        Access article, distributed under the terms of
        the Creative Commons Attribution-                    tributaries reducing to four tributaries between 1973 and 2013 (Xu and others, 2018), and was
        NonCommercial-NoDerivatives licence (http://         identified as a surge-type glacier by King and others (2021). However, change of morphology
        creativecommons.org/licenses/by-nc-nd/4.0/),         (geometry, crevasses) and detailed change of velocity during the active surge phase, and veloci-
        which permits non-commercial re-use,                 ties over the quiescent phase, which was not shown in previous study (King and others, 2021),
        distribution, and reproduction in any medium,
        provided the original work is unaltered and is
                                                             are important parameters for the glacier surge model (Benn and others, 2019). Here changes in
        properly cited. The written permission of            surface velocity, surface elevation, tongue area and the medial moraine are employed to recog-
        Cambridge University Press must be obtained          nize how the surge build up over the quiescent phase and how the glacier surges and terminates.
        for commercial re-use or in order to create a
        derivative work.
                                                             2. Datasets and methods
                                                             Thirty-nine Landsat 1 MSS, 5 TM, 7 ETM+ and 8 OLI images from 1973 to 2019, offered by
        cambridge.org/jog                                    the United States Geological Survey (USGS, http://earthexplorer.usgs.gov/), were used in this

Downloaded from https://www.cambridge.org/core. 16 Sep 2021 at 13:03:02, subject to the Cambridge Core terms of use.
968                                                                                                                                                 Junli Xu and others

       Fig. 1. Location of the Geladandong region and the Gangjiaquba Glacier. (a) The location of Geladandong region, (b) the location of the glacier (background is the
       Landsat TM of 8 November 2008), and (c) the Gangjiaquba Glacier on the Landsat MSS of 16 July 1973. The tributaries are numbered 1–5. The glacier boundaries in
       1973 and 2013 were obtained from Xu and others (2018).

       study (Table S1). Velocities were extracted by employing the                             minimum-distance supervised classification into ice and ice-free
       COSI-CORR (Co-registration of Optically Sensed Images and                                areas, implementing in ENVI/IDL 5.3 software using the compos-
       Correlation) software (Leprince and others, 2007; Scherler and                           ite image of bands 7, 6 and 5 after resampling to 30 m × 30 m
       others, 2008), which has been proven to be effective for displace-                       resolution. Glacier tongue area changes between images were clas-
       ment measurement using Landsat images (Pitte and others, 2016;                           sified as 1 for expansion (non-glacier changing to glacier), 0 for
       Paul and others, 2017; Chudley and Willis, 2018; Liu and others,                         no change and −1 for shrinkage by post-event binary image
       2020). We set the initial search window and the final window to                          minus previous one. In addition, the annual medial moraine
       32 and 16 pixels for TM band 3 (64 and 16 pixels for OLI band 8),                        was digitized to figure out the changes of tributaries based on
       which is a compromise between the image pixel size and the                               36 images. The position of medial moraine relative to 1973 was
       expected displacement of the glacier surface. The threshold of                           calculated using the average of seven points on the change direc-
       the signal-to-noise ratio was set to 0.95 and the step size of 2 pix-                    tion (Fig. S1). For supraglacial lake and crevasse changes, we clas-
       els for TM (4 for OLI) was set for velocity interpolation with 60 m                      sified only whether the features existed at each time period, and
       resolution. The influence of cloud and shadow was removed by                             did not calculate their area.
       the low-pass filter, and the anomalous flow direction of vectors                             Glacier surface elevation changes were used to confirm the
       was removed manually (Fu and others, 2019). The displacement                             surge through the downstream transfer of ice which is proven
       was scaled to velocity with units of m a−1. Seventeen phases of vel-                     to be a characteristic of the surge event (Grant and others,
       ocity were calculated based on 18 images (Table S2).                                     2009; Sund and others, 2009). Three multitemporal digital eleva-
           The glaciomorphological change of glacier tongue area, medial                        tion models (DEMs) from topographic maps of 1968 based on
       moraine, supraglacial lakes and crevasses were assessed by the ter-                      aerial photography (DEM1968), shuttle radar topography mission
       minus evolution (Fig. 1). Six glacier-tongue-area binary images of                       (SRTM) in band C from 2000, and SPOT 6/7 stereo image pairs
       Landsat TM/OLI (30 July 1986, 31 August 1992, 17 September                               from 6 October 2013 and 18 November 2014 (DEM2014) were
       1998, 1 September 2004, 1 August 2010, 2 October 2015) were                              provided by Xu and others (2018) for the elevation difference ana-
       generated through the segmentation of the band ratio image                               lysis. The penetration in snow and ice of SRTM C has been cor-
       TM 3/TM 5 (for Landsat 8 image OLI 4/OLI 6) by a threshold                               rected using SRTM X. The error due to the co-registration and
       of 2.1–2.4 (Table S1). A binary classification image of glacier ton-                     coarse resolution was removed using the method of Gardelle
       gue area from MSS (16 July 1973) was generated by the                                    and others (2012). The difference between SRTM and

Downloaded from https://www.cambridge.org/core. 16 Sep 2021 at 13:03:02, subject to the Cambridge Core terms of use.
Journal of Glaciology                                                                                                                                                 969

        Fig. 2. Evolution of flow velocities from 1986 to 2019 along the flowline in Figure S3. (a) The Hovmöller plot, (b) velocity from 9 August 2013 to 16 November 2014
        (the surge build up to the maximum), (c) 16 November 2014 to 23 December 2016 (the surge weakening until exhausted), and (d) 23 December 2016 to 10 August
        2019 (after the surge).

        Fig. 3. Surface elevation changes of the glacier from 1968 to 2014 masked by the glacier boundary from 1973. (a) Changes between 1968 and 2000 (DBL: dynamic
        balance line) and (b) changes between 2000 and 2014 (shadow area removed, purple line is the glacier boundary in 2000).

        DEM1968 (DEM2014) off glacier area shown in Figure S2 was                                 are shown in Figure 2. From 1986 to 2010, the velocity across much
        assessed as 0.36 ± 8.95 m (−0.05 ± 3.92 m, mean ± std dev.).                              of the glacier area was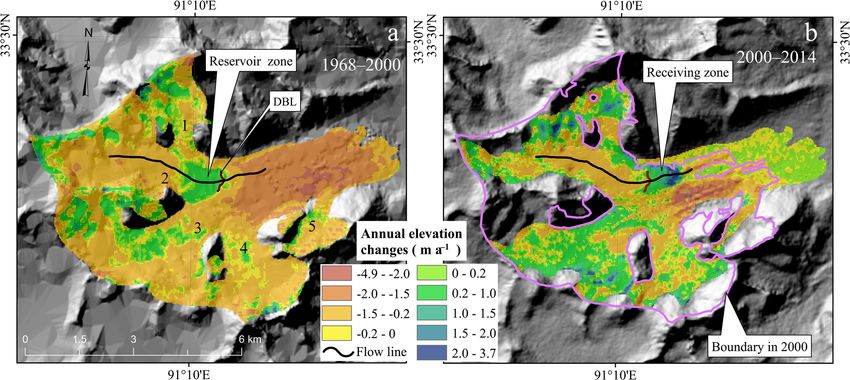
Downloaded from https://www.cambridge.org/core. 16 Sep 2021 at 13:03:02, subject to the Cambridge Core terms of use.

                                                                                                                                                                                                                                                                                                                                                     970
                                                                                                                                                                                                                                                                                                                                                     Junli Xu and others
                                                                                                                       Fig. 4. Changes of glacier tongue from 1973 to 2019. (a–f) The area change over 1973–1986, 1986–1992, 1992–1998, 1992–2004, 2004–2010, 2010–2015, the background is the panchromatic band of Landsat 8 OLI from 2013/08/09;
                                                                                                                       (g) the annual shrinkage area from during these periods; and (h) the position relative to 1973.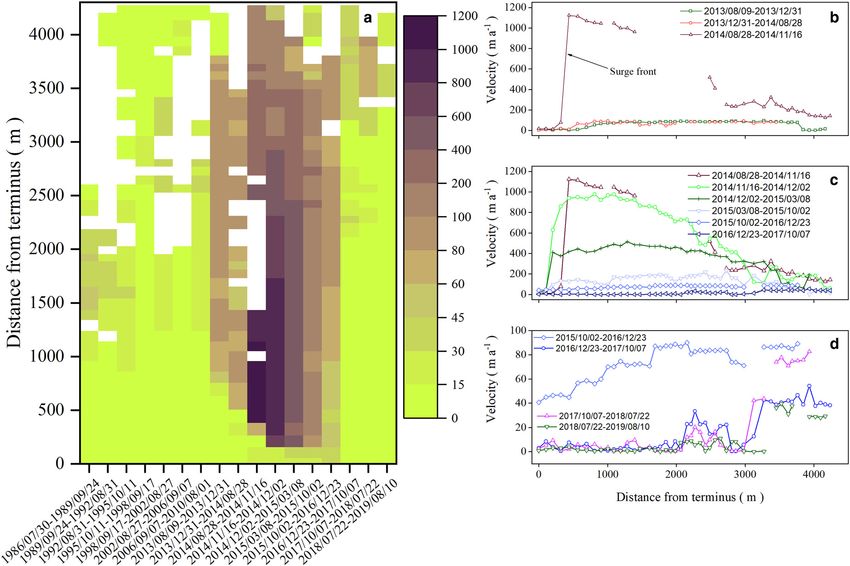
Journal of Glaciology                                                                                                                                            971

        Fig. 5. Surface changes of Gangjiaquba Glacier from 2013 to 2019. The yellow arrows show the changes at the terminus of tributary 1, the green arrows show the
        changes at the terminus of tributary 2, and the blue arrows show supraglacial lakes that formed after surging. Here arrows do not change with images.

        increased to 45–86 m a−1 over the ablation area of tributary 2 and                       and 23 December 2016 with velocity decreasing to 45–85 m a−1,
        propagated down to the terminus with the same speed (Figs S3h–                           similar to the pre-surge velocity. Although tributary 1 was also
        i), while the surge built up. The maximum motion of 1100 m a−1                           observed to surge, it had a much lower maximum velocity than
        (3.0 m d−1) occurred over 28 August to 16 December 2014, fol-                            tributary 2 during this surging phase (Figs S3h–j). The maximum
        lowing the surge initiation (Figs 2a, b). A surge front, which                           speed of tributary 1 was ∼150 m a−1, which occurred between 16
        was described as a kinematic wave (Kamb and others, 1985),                               November 2014 and 8 March 2015, 3 months later than in tribu-
        accompanied this strongest acceleration of the glacier. After this                       tary 2.
        peak movement, the surge front advanced and weakened continu-                                After 23 December 2016, the velocity decreased to
972                                                                                                                                             Junli Xu and others

       upstream of tributary 2 increased to 60 m a−1, indicative of a                           was also much smaller than that of Gangjiaquba (Gao and others,
       potential subsequent phase of surging.                                                   2021; King and others, 2021).
           Change maps with a resolution of 30 m on the glacier surface                            The maximum velocity of Gangjiaquba Glacier is comparable
       elevation from 1968 to 2014 are visualised in Figure 3. These indi-                      to that of reported surging-type glaciers in the West Kunlun and
       cate a reduction in elevation of the tongue area at a rate of 2.0 ±                      Central Kunlun Mountains (0.2–4.5 km a−1) (Yasuda and
       1.1 m a−1 from 1968 to 2000, alongside an area of thickening on                          Furuya, 2013; Chudley and Willis, 2018; Fu and others, 2019).
       the junction of tributary 2 towards 3 at a rate of 0.35 ± 0.16 m                         Although some surge-type glaciers in the West-Kunlun are
       a−1 (Fig. 3a). This 1.5 km-long thickening zone (1.1 ± 0.4 km2                           smaller, they have similar terminus advance (549–1524 m) but
       with 1.3 ± 0.2 × 10⁷ m3 ice volume) is likely the reservoir zone.                        longer surging duration (Chudley and Willis, 2018). However,
       From 2000 to 2014, ice transferred towards the snout from the                            the maximum velocity of Gangjiaquba is much smaller than
       reservoir zone (Fig. 3b). A dynamic balance line was identified,                         that of the Shisper Glacier (48 m d−1) in the Karakoram
       which had no elevation change when ice transferred to the receiv-                        Mountains, even in the similar size with an area of 26 km2
       ing zone, and was observed on many glaciers (Raymond and                                 (Rashid and others, 2020). Gangjiaquba has a much shorter sur-
       others, 1987; Kochtitzky and others, 2019). Continuous thicken-                          ging duration than some surge-type glaciers in Svalbard (Murray
       ing in the upstream of tributary 3 and thinning in the lower                             and others, 1998, 2003).
       part from 1968 to 2014 steepened this tributary.                                            Transfer of ice from the reservoir area to the receiving area was
           The glacier tongue covered an area of 10.7 ± 2.1 km2 in 1973.                        observed through the elevation changes from 1968 to 2014.
       The glacier tongue area experienced expansion and shrinkage at                           Although the reservoir zone of Gangjiaquba Glacier was not cal-
       the same time in different zones from 1973 to 2015 (Figs 4a–f).                          culated over the entire quiescent phase, the location of the
       The shrinkage occurred in the lower part of the tongue at hetero-                        dynamic balance line changed little (cf. Raymond and others,
       geneous speed temporally. The shrinkage rate of area increased                           1987; Kochtitzky and others, 2019). Our observed length of reser-
       from 0.1 ± 0.02 to 0.27 ± 0.08 km2 a−1 from 1973 to 2004, and                            voir zone of Gangjiaquba Glacier was much shorter than that of
       then slowed down (Fig. 4g). Meanwhile, expansion was observed                            Sabche Glacier in Nepal, which has a much smaller area (9.1
       at the junction of tributaries 2 towards the 3 over the observation                      km2) (Lovell and others, 2018). This might be why this surge of
       period, and the front of tributary 1 from 2010 to 2015 (Fig. 4h). In                     Gangjiaquba Glacier has a relatively low surge peak velocity.
       combination with the surface velocity and elevation changes, it is                          Our results show two tributaries surged in different amplitudes
       likely that the ice being received from tributary 2 displaced tribu-                     during 2013 and 2016, another tributary was still in thickening of
       tary 3 and thus the medial moraine between them. It moved                                reservoir zone. This heterogeneous surging pattern across differ-
       southeastwards by 356 ± 11.4 m (9.1 ± 0.3 m a−1) from 1973 to                            ent tributaries also occurs on other glaciers (Hewitt, 2007;
       2012, and 302 ± 11.3 m from 2012 to 2016 (Fig. S1 and Fig. 4h).                          Shangguan and others, 2016; Paul, 2020).
           Changes of crevasses and supraglacial lakes on the terminus
                                                                                                Supplementary material. The supplementary material for this article can
       from 2013 to 2019 are shown in Figure 5. From 9 August 2013
                                                                                                be found at https://doi.org/10.1017/jog.2021.86
       to 28 August 2014, an advance of 50 ± 11.3 m without an area
       of fresh crevasses was observed. During the active surging phase                         Acknowledgements. This research was funded by the Key Research
       (28 August 2014 to 23 December 2016), many fresh transverse                              Program of Frontier Sciences, CAS (grant No.: XDA19070501), National
       crevasses emerged on the surging zone (Fig. 5c). However, the                            Natural Science Foundation of China (grant No.: 41671075 and 41950410575).
       surge bulge was not visible on Gangjiaquba glacier on Landsat
       images during the observed period, which was clear on some
       surge-type glaciers during the active surge phase (Murray and                            References
       others, 1998; Jiskoot and Juhlin, 2009). This surge also resulted
                                                                                                Benn DI and Evans DJA (2010) Glaciers & Glaciation, 2nd Edn. London, UK:
       in a total advance of 500 ± 11.2 m by tributary 2 (Fig. 5, green
                                                                                                  Hodder Education.
       arrows), and of 180 ± 11.2 m by tributary 1 (Fig. 5, yellow arrows).                     Benn DI, Fowler AC, Hewitt I and Sevestre H (2019) A general theory of gla-
           After the surge, an increase in supraglacial meltwater in ponds                        cier surges. Journal of Glaciology 65(253), 701–716. doi: 10.1017/jog.2019.62
       and crevasses was observed over the surged zone (Fig. 5, blue                            Chudley TR and Willis IC (2018) Glacier surges in the north-west West
       arrows). Soon after the surge (23 December 2016 to 10 August                               Kunlun Shan inferred from 1972 to 2017 Landsat imagery. Journal of
       2019), a recession of tributary 1 occurred, but not of tributary 2.                        Glaciology 65(249), 1–12. doi: 10.1017/jog.2018.94
                                                                                                Clarke GKC, Schmok JP, Ommanney CSL and Collins SG (1986)
                                                                                                  Characteristics of surge-type glaciers. Journal of Geophysical Research:
       4. Discussion and conclusion                                                               Solid Earth 91(B7), 7165–7180. doi: 10.1029/JB091iB07p07165
                                                                                                Fowler AC, Murray T and Ng FSL (2001) Thermally controlled glacier sur-
       A complete surging process of Gangjiaquba Glacier was observed
                                                                                                  ging. Journal of Glaciology 47(159), 527–538. doi: 10.3189/
       through changes of velocity, terminus morphology and elevation
                                                                                                  172756501781831792
       changes. Surging initiated in the summer of 2013, was active from                        Fu X, Li Z and Zhou J (2019) Characterizing the surge behavior of Alakesayi
       the end of summer in 2014–2016, and was depleted after 2016.                               Glacier in the West Kunlun Shan, Northwestern Tibetan Plateau, from
       The surging lasted for ∼3 years, resulting in the terminus advan-                          remote-sensing data between 2013 and 2018. Journal of Glaciology 65
       cing by 500 ± 11.2 m, pushing the medial moraine southeastwards                            (249), 168–172. doi: 10.1017/jog.2019.2
       302 ± 11.3 m. The maximum velocity occurred between 28 August                            Gao Y and 6 others (2021) Characterizing the behaviour of surge-type glaciers
       and 2 December 2014, and was 1100 m a−1 (3 m d−1). It has com-                             in the Geladandong Mountain Region, Inner Tibetan Plateau, from 1986 to
       parable maximum velocity and similar surging duration with its                             2020. Geomorphology 389, 107806. doi: 10.1016/j.geomorph.2021.107806
       two adjacent surge-type glaciers (G091091E33424N and                                     Gardelle J, Berthier E and Arnaud Y (2012) Slight mass gain of Karakoram
                                                                                                  glaciers in the early twenty-first century. Nature Geoscience 5(5), 322–325.
       G091071E33463N) (Yan and others, 2019), which have a similar
                                                                                                  doi: 10.1038/ngeo1450
       area as Gangjiaquba (27.03 ± 0.83 and 34.92 ± 1.08 km2) (Xu and
                                                                                                Grant KL, Stokes CR and Evans IS (2009) Identification and characteristics of
       others, 2018). The maximum velocity observed in our study is                               surge-type glaciers on Novaya Zemlya, Russian Arctic. Journal of Glaciology
       about seven times as that observed by King and others (2021). It                           55(194), 960–972. doi: 10.3189/002214309790794940
       is the longer observation period by King and others (2021) that                          Hewitt K (2007) Tributary glacier surges: an exceptional concentration at
       reduce the velocity value. Correspondingly, the maximum velocity                           Panmah Glacier, Karakoram Himalaya. Journal of Glaciology 53(181),
       of other surge-type glaciers (
Journal of Glaciology 973
Jiskoot H and Juhlin DT (2009) Surge of a small East Greenland glacier, Pu J (1994) Glacier Inventory of China VII the Yangtze River Drainage Basin.
2001–2007, suggests Svalbard-type surge mechanism. Journal of Lanzhou, China: Gansu Culture Press.
Glaciology 55(191), 567–570. doi: 10.3189/002214309788816605 Rashid I, Majeed U, Jan A and Glasser NF (2020) The January 2018 to
Kamb B (1987) Glacier surge mechanism based on linked cavity configuration September 2019 surge of Shisper Glacier, Pakistan, detected from remote
of the basal water conduit system. Journal of Geophysical Research 92(B9), sensing observations. Geomorphology 351, 106957. doi: 10.1016/j.geo-
9083. doi: 10.1029/JB092iB09p09083 morph.2019.106957
Kamb B and 7 others (1985) Glacier surge mechanism: 1982–1983 surge of Raymond C, Johannesson T, Pfeffer T and Sharp M (1987) Propagation of a
variegated glacier, Alaska. Science (New York, N.Y.) 227, 469–479. doi: 10. glacier surge into stagnant ice. Journal of Geophysical Research 92(B9),
1126/science.227.4686.469 9037. doi: 10.1029/JB092iB09p09037
King O, Bhattacharya A and Bolch T (2021) The presence and influence of gla- Scherler D, Leprince S and Strecker M (2008) Glacier-surface velocities in
cier surging around the Geladandong ice caps, North East Tibetan Plateau. alpine terrain from optical satellite imagery – accuracy improvement and
Advances in Climate Change Research. doi: 10.1016/j.accre.2021.05.001 quality assessment. Remote Sensing of Environment 112(10), 3806–3819.
Kochtitzky W and 6 others (2019) Terminus advance, kinematics and mass doi: 10.1016/j.rse.2008.05.018
redistribution during eight surges of Donjek Glacier, St. Elias Range, Sevestre H and Benn DI (2015) Climatic and geometric controls on the global
Canada, 1935 to 2016. Journal of Glaciology 65(252), 565–579. doi: 10. distribution of surge-type glaciers: implications for a unifying model of sur-
1017/jog.2019.34 ging. Journal of Glaciology 61(228), 646–662. doi: 10.3189/2015JoG14J136
Leprince S, Barbot S, Ayoub F and Avouac J-P (2007) Automatic and precise Shangguan D and 6 others (2016) Characterizing the May 2015 Karayaylak
orthorectification, coregistration, and subpixel correlation of satellite images, Glacier surge in the eastern Pamir Plateau using remote sensing. Journal
application to ground deformation measurements. IEEE Transactions on of Glaciology 62(235), 944–953. doi: 10.1017/jog.2016.81
Geoscience and Remote Sensing 45(6), 1529–1558. doi: 10.1109/tgrs.2006.888937 Sund M, Eiken T, Hagen JO and Kääb A (2009) Svalbard surge dynamics
Liu Q and 6 others (2020) Interannual flow dynamics driven by frontal retreat derived from geometric changes. Annals of Glaciology 50(52), 50–60. doi:
of a lake-terminating glacier in the Chinese Central Himalaya. Earth and 10.3189/172756402781817491
Planetary Science Letters 546, 116450. doi: 10.1016/j.epsl.2020.116450 Tian L and 9 others (2016) Two glaciers collapse in western Tibet. Journal of
Lovell AM, Carr JR and Stokes CR (2018) Topographic controls on the sur- Glaciology 63(237), 194–197. doi: 10.1017/jog.2016.122
ging behaviour of Sabche Glacier, Nepal (1967 to 2017). Remote Sensing of Wei J and 6 others (2014) Surface-area changes of glaciers in the Tibetan
Environment 210, 434–443. doi: 10.1016/j.rse.2018.03.036 Plateau interior area since the 1970s using recent Landsat images and his-
Murray T, Dowdeswell JA, Drewry DJ and Frearson I (1998) Geometric evo- torical maps. Annals of Glaciology 55(66), 213–222. doi: 10.3189/
lution and ice dynamics during a surge of Bakaninbreen, Svalbard. Journal 2014AoG66A038
of Glaciology 44(147), 263–272. doi: 10.3189/s0022143000002604 Xu J, Shangguan D and Wang J (2018) Three-dimensional glacier changes in
Murray T, Strozzi T, Luckman A, Jiskoot H and Christakos P (2003) Is there Geladandong Peak Region in the Central Tibetan Plateau. Water 10(12),
a single surge mechanism? Contrasts in dynamics between glacier surges 1749. doi: 10.3390/w10121749
in Svalbard and other regions. Journal of Geophysical Research: Solid Yan J, Lv M, Ruan Z, Yan S and Liu G (2019) Evolution of surge-type glaciers
Earth 108(B5), 2237. doi: 10.1029/2002jb001906 in the Yangtze river headwater using multi-source remote sensing data.
Paul F (2020) A 60-year chronology of glacier surges in the central Karakoram Remote Sensing 11(24), 2991. doi: 10.3390/rs11242991
from the analysis of satellite image time-series. Geomorphology 352, 106993. Yasuda T and Furuya M (2013) Short-term glacier velocity changes at West
doi: 10.1016/j.geomorph.2019.106993 Kunlun Shan, Northwest Tibet, detected by synthetic aperture radar data.
Paul F, Strozzi T, Schellenberger T and Kääb A (2017) The 2015 surge of Remote Sensing of Environment 128, 87–106. doi: 10.1016/j.rse.2012.09.021
Hispar Glacier in the Karakoram. Remote Sensing 9(9), 888. doi: 10.3390/ Yasuda T and Furuya M (2015) Dynamics of surge-type glaciers in West
rs9090888 Kunlun Shan, Northwestern Tibet. Journal of Geophysical Research: Earth
Pitte P and 7 others (2016) Geometric evolution of the Horcones Inferior Surface 120(11), 2393–2405. doi: 10.1002/2015jf003511
Glacier (Mount Aconcagua, Central Andes) during the 2002–2006 surge. Yde JC and Paasche Ø (2010) Reconstructing climate change: not all glaciers
Journal of Geophysical Research: Earth Surface 121(1), 111–127. doi: 10. suitable. Eos Transactions AGU 91(21), 189–190. doi: 10.1029/
1002/2015jf003522 2010EO210001
Downloaded from https://www.cambridge.org/core. 16 Sep 2021 at 13:03:02, subject to the Cambridge Core terms of use.You can also read