Record high positive refractive index change in bismuth germanate crystals through ultrafast laser enhanced polarizability - Nature
←
→
Page content transcription
If your browser does not render page correctly, please read the page content below
www.nature.com/scientificreports
OPEN Record‑high positive
refractive index change
in bismuth germanate crystals
through ultrafast laser enhanced
polarizability
T. Toney Fernandez1*, Karen Privat2, Michael J. Withford1 & Simon Gross1
Unlike other crystals, the counter intuitive response of bismuth germanate crystals (Bi4 Ge3 O12, BGO)
to form localized high refractive index contrast waveguides upon ultrafast laser irradiation is explained
for the first time. While the waveguide formation is a result of a stoichiometric reorganization of
germanium and oxygen, the origin of positive index stems from the formation of highly polarisable
non-bridging oxygen complexes. Micro-reflectivity measurements revealed a record-high positive
refractive index contrast of 4.25 × 10⁻². The currently accepted view that index changes > 1 × 10⁻²
could be brought about only by engaging heavy metal elements is strongly challenged by this report.
The combination of a nearly perfect step-index profile, record-high refractive index contrast, easily
tunable waveguide dimensions, and the intrinsic high optical non-linearity, electro-optic activity and
optical transparency up to 5.5 µm of BGO make these waveguides a highly attractive platform for
compact 3D integrated optics.
Bismuth Germanate, Bi4 Ge3 O12 (BGO) crystals are generally known as an efficient scintillation material for high
energy radiation d etection1. The versatility of the femtosecond laser direct-write technique to form localized
high refractive index change ( n) in BGO crystal has been proposed for applications such as two dimensional
gamma ray s pectrometers2,3, positron emission tomography4 and other optical waveguide devices5,6. The densely
packed lattice of crystals makes it difficult to obtain an increase in refractive index upon ultrafast laser e xposure7,8.
As a result positive refractive index change has been reported only in a few selected crystals. Examples include
a thermally stable type-I waveguides in Pr3+ : Y2 SiO5 crystal9, colour-centres in L iF10, a transverse magnetic
polarization guiding in potassium dihydrogen phosphate (KDP) c rystal11, a change in the spontaneous polariza-
tion in LiNbO3 that increases the extraordinary refractive index7,12, exploitation of the higher refractive index of
amorphous silicon versus crystalline silicon13 and ultrafast laser-induced lattice defects in Nd:YCOB crystals14.
But, those waveguides either suffer from a low refractive index change of the order of 10−3 or only guide a single
polarization. This limitation is evident from the preferential choice of stress-induced or depressed cladding
waveguides in crystalline media7,8. In contrast, BGO crystal was reported to produce waveguides of a smooth
positive refractive index (type-I m odifications15) in the thermal fabrication regime using megahertz pulse repeti-
tion rates5 as well as in the athermal regime at 1 kHz repetition r ate16. The waveguiding properties, such as mode
profiles and loss, has been reported e lsewhere5.
This work explains for the first time the formation of the positive type-I index change of record high mag-
nitude, which is unprecedented not only among crystals but for any dielectric medium. The combination of a
record-high refractive index change, clean step-refractive index profile, easily customisable waveguide dimen-
sions, wide wavelength transparency ranging from the UV to the mid-IR (0.3–5.5 µm17), electro-optic activity
and high optical non-linearity due to a bulk refractive index > 2.018 could make BGO a powerful platform for
ultrafast laser inscribed 3D photonic circuits.
1
MQ Photonics Research Centre, Department of Physics and Astronomy, Macquarie University, Sydney, NSW,
Australia. 2Electron Microscope Unit, Mark Wainwright Analytical Centre, University of New South Wales, Sydney,
NSW, Australia. *email: toney.teddyfernandez@mq.edu.au
Scientific Reports | (2020) 10:15142 | https://doi.org/10.1038/s41598-020-72234-w 1
Vol.:(0123456789)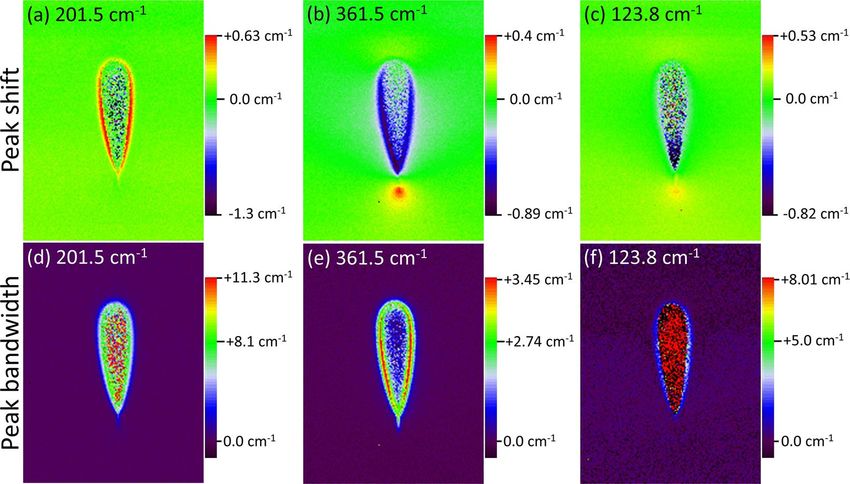
www.nature.com/scientificreports/
Figure 1. DIC images of waveguide end-faces written at 1,000 mm/min feed rate and energies of (a) 60 nJ, (b)
70 nJ, (c) 90 nJ, (d) 130 nJ and in the bottom row with an energy of 90 nJ at feed rates of (e) 4,000 mm/min, (f)
500 mm/min, (g) 200 mm/min and (h) 100 mm/min, respectively. The writing laser was incident from the top
of the images.
Results and discussion
Differential interference contrast (DIC) microscope images of the inscribed waveguides are shown in Fig. 1.
Terminologies of “shell” which is the highly distinguishable peripheral halo and “core”, which is the region at
the center will be used throughout the manuscript. The processing windows for type-I waveguides with smooth
positive refractive index that are crack-free were found to be, 50–80 nJ for 2,000–4,000 mm/min and 50–130 nJ
for 1,000 mm/min. Waveguides written with energies ≥ 90 nJ with 2,000–4,000 mm/min also exhibited a smooth
positive refractive index change, but due to BGO’s high thermal expansion c oefficient18 of 7 × 10⁻⁶ /◦ C, cracks
formed along the boundaries between modified and unmodified material and were running down the waveguid-
ing structures. The inverted tear drop structure of the waveguides can be attributed to a combination of spherical
aberrations, Kerr-nonlinearity and an extended confocal parameter due to the high linear and nonlinear refrac-
tive index of BGO. For feed rates slower than 1,000 mm/min, an additional optically dense vertical filament-like
structure became apparent within the core (Fig. 1f–h) . These filament structures likely resemble the shape of the
laser induced plasma profile, as observed in phosphate g lass19. This is supported by the observation of identi-
cal outer shell width irrespective of feed rates (Fig. 1c,f). Figure 1a–d shows waveguides written at 1,000 mm/
min with energies ranging between 60 and 130 nJ. Figure 1e illustrates the crack formation at high feed rates
(4,000 mm/min). All waveguides shown in Fig. 1e–g were written with 90 nJ energy. With decreasing feed rate
the index contrast gradually vanishes due to slow quenching and self-annealing. The waveguides in Fig. 1c,f
formed by identical pulse energy (90 nJ) but at feed rates of 1,000 and 500 mm/min, respectively, exhibit signifi-
cant differences. Quench times of 30 and 60 ms were calculated20 from the time it takes to translate the sample
by the average structure width of 5 um. Hence a 60 ms re-solidification window is too long to either produce a
modification or provides enough time for the melt to re-attain its long range order.This suggests that in BGO the
interplay between rapid thermal quenching and heat diffusion is critical for the formation of optical waveguides.
Micro-reflectivity (µ-PL) was used to measure the two-dimensional refractive index profiles (Fig. 2) at 833 nm
with a spatial resolution of ∼ 0.25 µm (Olympus Plan N oil immersion microscope objective, 100×, 1.25 NA).
The obtained 2-dimensional reflectance profile was converted into a refractive index profile using the Fresnel
formula. The back surface was polished at ∼ 45◦ to avoid retro reflections that affects the measurement. A record
refractive index change value of 4.25 × 10⁻² is observed for the waveguide inscribed at 1,000 mm/min. A value
of 1.7 × 10⁻² being the previous best was reported very recently using femtosecond-laser-induced electronic
band-gap shift (FLIBGS) t echnique21. But the same was limited to a particular operating wavelength in visible.
Also, unlike other previously reported peak index values in amorphous media, the index change in the current
report is highly uniform throughout the core area and resemble a perfect step-index. Additionally, there is an
absence of negative index zones, which are typically found for high-index waveguides in vitreous m edia19,22.
To reveal the structural dynamics of waveguide formation, micro-Raman spectroscopy was carried out using
633 nm excitation wavelength on a Renishaw inVia Raman microscope in confocal mode using a 100× objec-
tive (spatial resolution ∼ 0.5 µm). Figure 3 depicts the Raman spectrum of unmodified BGO exhibiting peaks
between 65 and 820 cm−1. The key features of BGO’s crystalline structure are (1) a distorted octahedral environ-
ment of oxygen around the Bi3+ ions, (2) influence of heavier Bi–O atoms on the low Raman frequencies and
Scientific Reports | (2020) 10:15142 | https://doi.org/10.1038/s41598-020-72234-w 2
Vol:.(1234567890)
www.nature.com/scientificreports/
Figure 2. Refractive index profiles of waveguides written at (a) 90 nJ/500 mm/min, (b) 90 nJ/1,000 mm/min,
(c) 120 nJ/1,000 mm/min and (d) 120 nJ/2,000 mm/min. Each map corresponds to an area of 15 × 40 µm.
Figure 3. Raman spectrum of the BGO bulk crystal.
(3) influence of lighter Ge–O bonds on high Raman f requencies23,24. The Raman spectrum of BGO is generally
divided into two regions. The first region between 60−300 cm−1, referred to as external vibrations, are the lattice
vibrations corresponding to the motion of whole GeO4 tetrahedral groups against the Bi3+ ion sub-lattice. The
second region between 360−820 cm−1 corresponds to isolated GeO4 tetrahera and is typically referred to as inter-
nal vibrations23,24. Since the vibrations are originating from a crystal, they are assigned to possible transverse optic
(TO) or longitudinal optic (LO) phonons. The bulk crystal featured two additional Raman peaks at 1, 210 cm−1
and 1, 627.5 cm−1 (inset of Fig. 3), which have not been reported previously. Their high frequencies suggest that
they are likely a combination mode from low frequency vibrations or vibrations of H2 O that are trapped within
the matrix. The elevated baseline at higher wavenumbers (> 2, 000 cm−1) is due to the luminescence tail caused
by defects which will be discussed in detail later on.
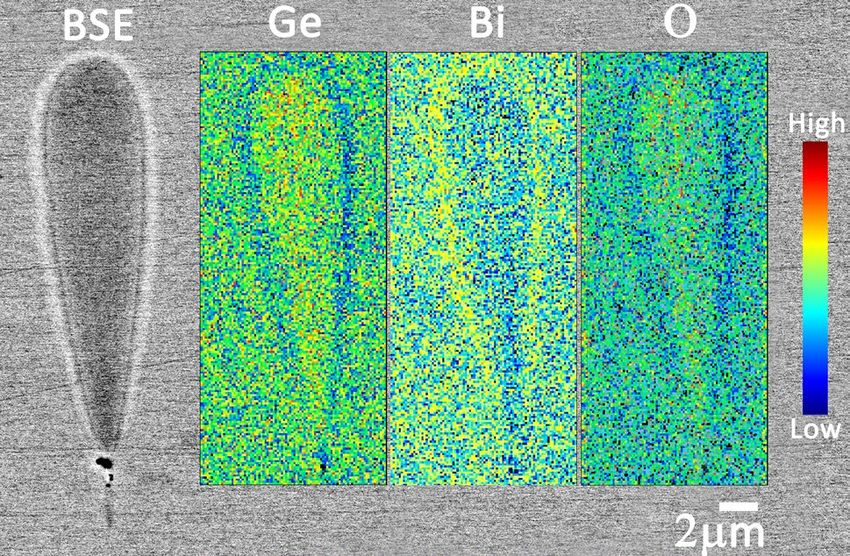
For Raman mapping a waveguide free of cracks, written at 90 nJ and with 1,000 mm/min, was chosen (Fig. 4).
Figure 4a shows the spatial map of the peak at 201.5 cm−1, which arises from lattice vibrations. While the peak
frequency shift for lattice vibration (60−300 cm−1) was fairly low, the 201.5 cm−1 band shows a distinct increase
in frequency (+0.3 cm−1) in the shell (red pixels) and decrease in the core (dark blue pixels) relative to the pris-
tine bulk. For the internal vibration, assigned to wavenumbers > 360 cm−1, none of the peaks exhibit a peak
Scientific Reports | (2020) 10:15142 | https://doi.org/10.1038/s41598-020-72234-w 3
Vol.:(0123456789)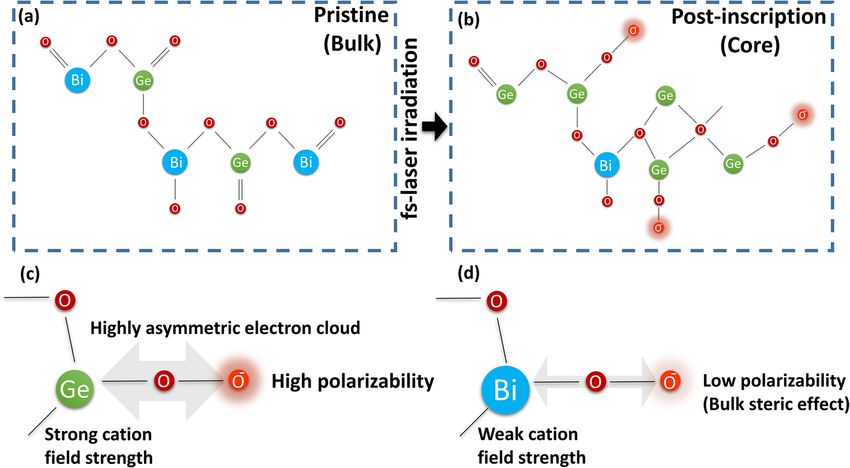
www.nature.com/scientificreports/
Figure 4. Raman maps of waveguide written at 90 nJ with 1,000 mm/min feed rate. First row shows shift in
frequency and the bottom row the full-width at half maximum bandwidth (FWHM). Each map corresponds to
an area of 30 × 40 µm.
shift, except for the 361.5 cm−1 vibration (Fig. 4b). This band is assigned to the degenerate bending vibration
of the isolated GeO4 tetrahedron. Unlike for lattice vibrations, both core and shell regions exhibit a decrease in
frequency shift, with the decrease more pronounced in the shell. The 361.5 cm−1 band shows an increase in fre-
quency at the bottom tip of the modification due to the mechanical stress typical for laser inscribed modifications
in crystalline m aterials7. Additionally, the 361.5 cm−1 band shows an increase in frequency at the bottom tip of
the modification. This could be a result of mechanical stress, which is typical for laser inscribed modifications
in crystalline materials7. Also, the lattice vibration at 123.8 cm−1 exhibits a similar feature (Fig. 4c). The peaks at
361 cm−1 and 123.8 cm−1 arise from transverse optical phonons which have an additional magnetic field com-
ponent in comparison to the longitudinal optical phonon vibration at 201.5 cm−1. A detailed polarized Raman
spectroscopy could reveal further information on the origin of this stress field.
By comparing the spatial morphology of the frequency shift of the 201.5 cm−1 (lattice, low frequency vibra-
tions) and 361.5 cm−1 (internal, high frequency vibrations) peak, a pattern of inversion is evident. This is indica-
tive of the migration of elements between the core and shell, since bismuth based vibrational units occupy the
low frequency region (< 360 cm−1) and germanium associated bands occupy the higher frequency regions
(> 360 cm−1). Mapping the distribution of FWHM (Fig. 4d–f) reveals an overall broadening of the vibrational
bands in the laser modified regions with respect to the pristine bulk material. This indicates amorphisation
within the structures. The lattice vibrations at 201.5 cm−1 and 123.8 cm−1 exhibit the strongest broadening in
the core region. In contrast, the internal vibration at 361.5 cm−1 only features a marginal bandwidth increase in
both core and shell. Changes in bandwidths are more pronounced in comparison to peak shifts, which indicates
that amorphisation is one of the key initiator for waveguide formation.
The field-emission backscattered electron (BSE) image, which gives contrast based on atomic number (Z-con-
trast) of the same 1,000 mm/min, 90 nJ waveguide reveals strong elemental variation across the waveguide’s
cross-section (Fig. 5). The shell region (bright boundary) shows an increase in heavy elements, whereas relatively
lighter elements are accumulated in the core (dark area). The BSE image rules out the possibility of refractive
index increase through stress-induced localized density variation due to the rapid quench at high feed rates. If
that was the case then the core would generate more backscattered electrons and a higher Z-contrast(psuedo)
due to incident electron beam interacting with more nuclei (protons) of stress accumulated constituent atoms
compared to the unirradiated z ones20.The compositional maps (insets of Fig. 5) acquired using electron probe
micro-analysis (EPMA) by utilising wavelength dispersive X-ray spectroscopy (WDS) clearly confirm elemental
migration. A migration of the heavy bismuth (at. no. 83) to the shell and migration of the lighter germanium (at.
no. 32) and oxygen (at. no. 8) to the core. The secondary electron image showed an entirely flat and featureless
surface morphology except for a sub-micron void structure found at the focal point (black spot in Fig. 5 BSE
image).
From the BSE image, the positive index in the shell can be explained by densification due to the migration
of relatively heavy Bi (bright zones due to the at. no. contrast) but the positive index in the core could not be
explained as it shows as a rarefied zone (darker zones)20. The increase of refractive index in the core due to the
migration of elements that exhibit a higher electronic polarizabiliy ( αe ), as for instance observed in the case of
chalcogenide glass25, can be ruled out since the discrepancy of polarizability between Ge ( 0.137 × 10⁻²⁴ cm3)
and Bi(1.508 × 10⁻²⁴ cm3) is more than one order of m agnitude26. This indicates the possible formation of a large
number of non-bridged oxygen in the core. Non-bridging oxygen possesses a significantly higher polarizability
Scientific Reports | (2020) 10:15142 | https://doi.org/10.1038/s41598-020-72234-w 4
Vol:.(1234567890)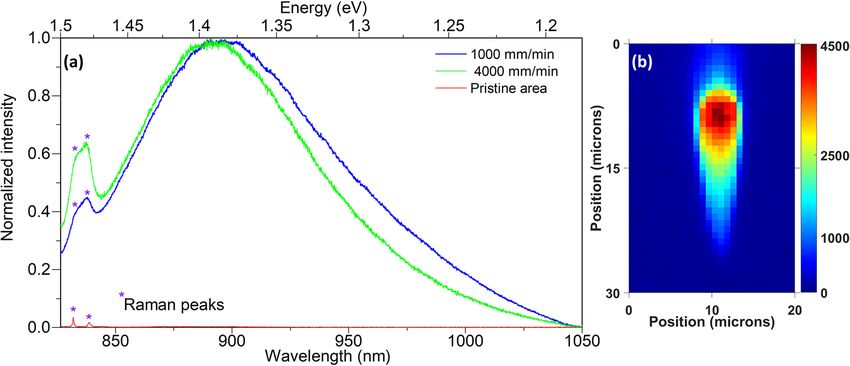
www.nature.com/scientificreports/
Figure 5. Backscattered electron image of the waveguide written at 90 nJ and 1,000 mm/min and its
corresponding spatially resolved compositional map of Ge, Bi and O.
Figure 6. (a) PL spectrum from the core of waveguides written at 1,000 and 4,000 mm/min and from a pristine
area using 785 nm excitation. (b) The 2-D intensity map of the PL across the waveguide written at 1,000 mm/
min with 90 nJ of energy.
(3.88 × 10⁻²⁴ cm3) compared to bridged o xygen27,28. This is underpinned by the migration of oxygen towards
the core observed using EPMA (Fig. 5, outmost right inset).
To investigate the presence and identify the type of non-bridged oxygen, confocal micro-photoluminescence
(µPL) was carried out using excitation lasers between 442 and 1,064 nm. Due to the wealth of publications based
on Si compared to relatively few on Ge, the discussion here is based on Si as it is isochemical to Ge. No PL relating
to interstitial O2, O329, oxygen deficiency related centers (ODC)30 or Ge based non-bridging oxygen (≡ Ge−O−)31
was detected. The excess availability of oxygen in the core due to migration can induce the formation of non-
bridging oxygen hole centers (NBOHCs) and/or interstitial molecular oxygen, which are generally found and
reported in oxygen excess silica. From the experimental observation, no Raman vibrations or PL of interstitial O2
(O + O → O2, ex = 1,064 nm, em = 1,275 nm, FWHM =∼ 12 nm) molecules were found and the lumines-
cence of O 3 are usually in the UV region (O2 + O → O3, em = 258 nm), which is below the UV absorption edge
of BGO c rystals29. It is possible that O2 and O3 are formed, but their existence might be a transient phase before
they are converted to other defects. PL due to oxygen deficiency related centers (ODC)30 was absent or could not
be observed with any of the excitation wavelengths. Since the core is enriched by the influx of oxygen, PL from
the oxygen excess d efects30 is expected, such as Ge based non-bridging oxygen (≡ Ge-O−, ex = 590−656 nm,
em = 666 nm, FWHM =∼ 58 nm)31 and/or peroxy linkage or peroxy radical center based defects.
Of all the excitation wavelengths, only 785 and 830 nm laser wavelength gave a PL spectra centered between
890 and 900 nm for different waveguides, as shown in Fig. 6a. The PL was observed only from the core of the
waveguide for feed rates between 1,000 and 4,000 mm/min. The bulk crystal did not show any PL (plotted
in red in Fig. 6a). From the broad peak it can be understood that the PL arises from amorphous sites and no
crystalline stark splitting is observed. The previous reports tentatively attributed the broad PL band centered
at 867 nm (1.43 eV) to the presence of a higher energy lying (326 nm/3.8 eV for silica) absorption b and32. This
UV absorption band was in turn attributed to the presence of peroxy radicals or otherwise known as superoxide
Scientific Reports | (2020) 10:15142 | https://doi.org/10.1038/s41598-020-72234-w 5
Vol.:(0123456789)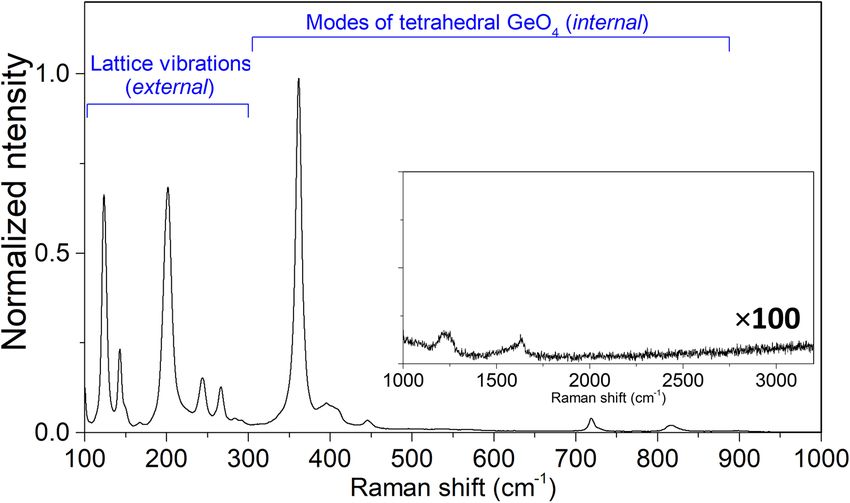
www.nature.com/scientificreports/
Figure 7. (a) The chemical structure of the pristine BGO crystal showing its long range order. (b) Post-
inscription structure of the waveguide core that illustrates amorphisation and inward migration of Ge & O to
replace Bi. (c) High polarizability induced due to strong asymmetry in the electron cloud caused by the strong
cation field of Ge. (d) Steric hinderance effect due to the presence of Bi instead of Ge within the same chain.
radicals (≡Si–O–O∗ , ∗ denoting an unpaired electron), which are formed when surplus oxygen molecules react
with network vacancies (≡Si–Si≡ + O 2 → ≡Si–O–O∗ ). In the present work, this mechanism is highly probable
as transient vacancies could be formed due to the outflow of bismuth with such vacancies becoming available
to the incoming oxygen to form peroxide radicals. The shift of PL towards a longer wavelength (lower energy)
is expected due to the heavier germanium atoms ( ≡Ge–Ge≡ + O 2 → ≡Ge–O–O∗ ) when compared to their
silicon counterparts31. The shift of approximately 0.052 eV in our case is very close to the previously reported
energy shift of the relatively higher energy 1.9 eV PL band (non-bridging oxygen hole centers) in pure SiO 2
glass towards 1.86 eV in pure GeO 2 glass31. Figure 6b shows the spatial map of PL intensity for the 90 nJ and
1,000 mm/min waveguide. It indicates a higher density of peroxy linkages at the top of the core overlapping with
the location of the vertical filament-like structure observed in Fig. 1f for waveguides written at lower feed rates.
This suggests that the formation and distribution of such defects tend to follow a thermal gradient profile which
is effectively the in-situ plasma profile as reported in phosphate glass waveguides (figures 4 & 8 in19). Hence
shaping the plasma profile within the matrix should provide a direct tunability on the waveguide morphology,
a key factor in waveguide design. Using the same excitation wavelengths (785 and 830 nm), the peroxy radical
PL was absent for feed rates slower than 500 mm/min. This is also reflected in the absence of a positive index
zone at the core (Fig. 1d).
Using the above evidence the waveguide formation can be explained as follows: As soon as the excitation/heat
source is spatially displaced (at feed rates > 500 mm/min) and thus initiating fast quenching, oxygen migrates
to the core, forming large numbers of superoxide radicals. This must occur within the re-solidification window.
As a crystal with long range order (Fig. 7a), the bond breakage and formation of non-bridging oxygens can
preferentially attract divalent cations to fulfill a cross link between two entirely different chains terminated with
NBO. Germanium, as the divalent cation among the two glass formers, therefore undertakes paired migration
towards the core with oxygen (Fig. 7b). However from the PL results it is clear that Ge migration is insufficient
for a complete cross linking of NBOs (· · ·O− ↔ Ge2+ ↔O− · · ·). The magnitude of polarizability induced by the
non-bridging oxygen depends on the linking cation field strength. The linked cation Germanium possesses a
small ionic radius and a strong field strength, causing strong electron cloud asymmetry (Fig. 7c) that induces a
high polarizability on the terminal NBOs which are present within its chain. Bismuth on the other hand suffers
from a bulk steric effect due to its larger ionic radius and thus can only induce weak polarizability on terminal
NBOs (Fig. 7d)33. This explains how the paired migration of Germanium and oxygen result in an increase of
refractive index to such unprecedented high levels.
Utilizing polarizability of oxygen in glass making is a well known technique to obtain high refraction with-
out engaging heavy elements. Also, a possibility of producing positive index waveguides in diamond by tuning
its polarizability through ion beam damage was proposed r ecently34. But this report is the first instance where
such a technique is fully exploited to produce and tune type-I waveguides, thereby demonstrating its superiority
over other techniques22. Hitherto it was generally accepted that tunable index changes of 10−2 could be brought
about only by engaging heavy metal elements within waveguiding structure22. While all other factors leading
to density decrease (outflow of Bi3+ and phase change from cyrstalline to amorphous) and molar refraction
(outflow of Bi3+) effectively work to lower the index, the observed increase in refractive index of 4.25 × 10⁻²
(≈ 6.4% increase from its base crystal refractive index) proves the importance of polarizability linked to anions.
These observations provide more insights towards the future design of super-high refractive index waveguides
in dielectric media induced by ultrafast lasers.
Scientific Reports | (2020) 10:15142 | https://doi.org/10.1038/s41598-020-72234-w 6
Vol:.(1234567890)www.nature.com/scientificreports/
Conclusion
To conclude, type-I waveguide formation by femtosecond laser direct-writing in a BGO is explained for the
first time. Raman spectra demonstrated inverted behaviour of peak shift between external and internal vibra-
tions, indicating migration of elements between the core and cladding of the inscribed structure. The large peak
bandwidth increase for all the Raman bands indicated significant amorphisation within the structure. BSE and
WDS confirmed the migration of bismuth to the peripheral shell and germanium and oxygen to the core. This
revealed that the positive index core, with a record value of 4.25 × 10⁻², is not formed due to densification or
change in molar volume. A µPL spectroscopy from the waveguiding region confirmed the formation of large
numbers of non-bridging oxygen associated to the peroxy radical. Non-bridged oxygen has a high polarizability
compared to bridged oxygen causing the significant increase in refractive index.
Methods
The waveguides were fabricated in commercially acquired BGO crystals (nD = 2.10918) using an extended cavity
Ti:Sapphire chirped pulse oscillator (CPO), operating at a 5.1 MHz repetition rate, emitting sub-50 fs laser pulses
at a center wavelength of 800 nm (FEMTOSOURCE scientific XL 500, Femtolasers GmbH). The circularly polar-
ized laser beam was focused to a depth of 170 µm below the sample surface by a 100 × 1.25NA oil immersion
objective (refractive of the immersion oil used was nD = 1.518). To fabricate the waveguides, pulse energy was
varied between 50 and 250 nJ and the feed rates between 10–4,000 mm/min. The micro-reflectivity technique
was used to quantitatively measure the refractive index profile of the waveguides. For this purpose, the back
surface of the BGO sample was polished at a 45◦ angle to avoid back reflections from the waveguide end. The
light from a single-mode fibre-coupled superluminescent diode ( = 833 nm , FWHM = 20 nm) was focused
by an Olympus 100× oil immersion microscope objective (Plan N, NA 1.25) to achieve a spatial resolution/spot
size of ≈ 0.3 µm. The recorded 2-dimensional reflectance profile was converted into a refractive index profile
using the Fresnel formula. Micro-Raman spectroscopy was carried out using 633 nm excitation wavelength on
a Renishaw inVia Raman microscope in confocal mode using a 100× objective (spatial resolution ∼ 0.5 µm ).
The obtained spectra were deconvolved by pseudo-Voigt curve fitting to identify the Raman bands. A mapping
of 30 × 40 µm area with waveguide as the center was done to understand the material response to ultrafast
laser pulses. Micro-photoluminescence measurements were also conducted in confocal mode to maximize the
resolution and restrict the light excitation and luminescence collection exclusively from the area of interest. A
100× objective with a spatial resolution of ∼ 0.5 µm was used. To reveal the elemental migration an electron
probe micro analysis (EPMA) based on wavelength dispersive spectroscopy (WDS) was used. Scanning electron
microscope imaging and X-ray intensity mapping of constituent elements were carried out on a JEOL JXA-8500F
field-emission EPMA.
Data availability
The datasets generated and analyzed during the current study are available from the corresponding author on
reasonable request.
Received: 19 May 2020; Accepted: 6 August 2020
References
1. Melcher, C. L. Thermoluminescence and radiation damage in bismuth germanate. Nature 313, 465–467. https: //doi.
org/10.1038/313465a0 (1985).
2. McGregor, D. S. Materials for gamma-ray spectrometers: inorganic scintillators. Annu. Rev. Mater. Res. 48, 245–277. https://doi.
org/10.1146/annurev-matsci-070616-124247 (2018).
3. Okajima, K., Takami, K., Ueda, K. & Kawaguchi, F. Characteristics of a gamma-ray detector using a bismuth germanate scintillator.
Rev. Sci. Instrum. 53, 1285–1286. https://doi.org/10.1063/1.1137124 (1982).
4. Bin, Q. et al. Femtosecond laser-written waveguides in a bismuth germanate single crystal. Chin. Phys. Lett. 26, 070601. https://
doi.org/10.1088/0256-307x/26/7/070601 (2009).
5. Miese, C., Gross, S., Withford, M. J. & Fuerbach, A. Waveguide inscription in bismuth germanate crystals using high repetition
rate femtosecond lasers pulses. Opt. Mater. Express 5, 323–329. https://doi.org/10.1364/OME.5.000323 (2015).
6. Pelli, S. et al. Characterisation of optical waveguides in BGO crystals fabricated by N+ ion implantation. In CLEO/Europe and
EQEC 2011 Conference Digest, 1 (OSA, Munich Germany, 2011). Paper CE P29.
7. Burghoff, J., Nolte, S. & Tunnermann, A. Origins of waveguiding in femtosecond laser-structured LiNbO3. Appl. Phys. A 89,
127–132. https://doi.org/10.1007/s00339-007-4152-0 (2007).
8. Okhrimchuk, A. Coherence and Ultrashort Pulse Laser Emission 519–542 (IntechOpen Limited, London, 2010).
9. Seri, A. et al. Laser-written integrated platform for quantum storage of heralded single photons. Optica 5, 934–941. https://doi.
org/10.1364/OPTICA.5.000934 (2018).
10. Kurobori, T., ichi Kawamura, K., Hirano, M. & Hosono, H. Simultaneous fabrication of laser-active colour centres and per-
manent microgratings in lithium fluoride by a single femtosecond pulse. J. Phys. Condens. Matter 15, L399–L405. https://doi.
org/10.1088/0953-8984/15/25/101 (2003).
11. Huang, L. et al. Waveguide fabrication in kdp crystals with femtosecond laser pulses. Appl. Phys. A 118, 831–836. https://doi.
org/10.1007/s00339-014-8899-9 (2015).
12. Thomson, R. .R., Campbell, S., Blewett, I. .J., Kar, A. .K. & Reid, D. .T. Optical waveguide fabrication in z-cut lithium niobate
(linbo3) using femtosecond pulses in the low repetition rate regime. Appl. Phys. Lett. 88, 111109. https://doi.org/10.1038/31346
5a00 (2006).
13. Kämmer, H. et al. Origin of waveguiding in ultrashort pulse structured silicon. Laser Photonics Rev. 13, 1800268. https://doi.
org/10.1002/lpor.201800268 (2019).
14. Rodenas, A. & Kar, A. K. High-contrast step-index waveguides in borate nonlinear laser crystals by 3d laser writing. Opt. Express
19, 17820–17833. https://doi.org/10.1038/313465a02 (2011).
15. Gross, S., Dubov, M. & Withford, M. J. On the use of the type i and ii scheme for classifying ultrafast laser direct-write photonics.
Opt. Express 23, 7767–7770. https://doi.org/10.1038/313465a03 (2015).
Scientific Reports | (2020) 10:15142 | https://doi.org/10.1038/s41598-020-72234-w 7
Vol.:(0123456789)www.nature.com/scientificreports/
16. He, R., Hernández-Palmero, I., Romero, C., de Aldana, J. R. V. & Chen, F. Three-dimensional dielectric crystalline waveguide beam
splitters in mid-infrared band by direct femtosecond laser writing. Opt. Express 22, 31293–31298. https://doi.org/10.1038/31346
5a04 (2014).
17. Bortfeld, D. P. & Meier, H. Refractive indices and electro-optic coefficients of the eulitities Bi4 Ge3 O12 and Bi4 Si3 O12. J. Appl.
Phys. 43, 5110–5111. https://doi.org/10.1063/1.1661080 (1972).
18. Williams, P. A. et al. Optical, thermo-optic, electro-optic, and photoelastic properties of bismuth germanate (Bi4 Ge3 O12). Appl.
Opt. 35, 3562–3569 (1996).
19. Fernandez, T. T. et al. Controlling plasma distributions as driving forces for ion migration during FS laser writing. J. Phys. D Appl.
Phys. 48, 155101. https://doi.org/10.1088/0022-3727/48/15/155101 (2015).
20. Fernandez, T. T., Gross, S., Arriola, A., Privat, K. & Withford, M. J. Revisiting ultrafast laser inscribed waveguide formation in
commercial alkali-free borosilicate glasses. Opt. Express 28, 10153–10164. https://doi.org/10.1038/313465a07 (2020).
21. Lapointe, J. et al. Nonlinear increase, invisibility, and sign inversion of a localized FS-laser-induced refractive index change in
crystals and glasses. Light Sci. Appl. 9, 64. https://doi.org/10.1038/s41377-020-0298-8 (2020).
22. Fernandez, T. et al. Bespoke photonic devices using ultrafast laser driven ion migration in glasses. Prog. Mater Sci. 94, 68–113.
https://doi.org/10.1038/313465a09 (2018).
23. Beneventi, P., Bersani, D., Lottici, P. P. & Kovács, L. A raman study of Bi4 (Gex Si1−x )3 O12 crystals. Solid State Commun. 93, 143–146.
https://doi.org/10.1016/0038-1098(94)00743-8 (1995).
24. Couzi, M., Vignalou, J. R. & Boulon, G. Infrared and raman study of the optical phonons in Bi4 Ge3 O12 single crystal. Solid State
Commun. 20, 461–465. https://doi.org/10.1016/0038-1098(76)90146-0 (1976).
25. Gretzinger, T., Fernandez, T. T., Gross, S., Arriola, A. & Withford, M. J. Boson band mapping: revealing ultrafast laser induced
structural modifications in chalcogenide glass. Opt. Lett. 45, 3369–3372. https://doi.org/10.1146/annurev-matsci-070616-12424
72 (2020).
26. Dimitrov, V. & Sakka, S. Electronic oxide polarizability and optical basicity of simple oxides. I. J. Appl. Phys. 79, 1736–1740. https
://doi.org/10.1063/1.360962 (1996).
27. Zotov, N., Ebbsjö, I., Timpel, D. & Keppler, H. Calculation of raman spectra and vibrational properties of silicate glasses: compari-
son between Na2 Si4 O9 and SiO2 glasses. Phys. Rev. B 60, 6383–6397. https://doi.org/10.1103/PhysRevB.60.6383 (1999).
28. El-Mallawany, R. The optical properties of tellurite glasses. J. Appl. Phys. 72, 1774–1777. https://doi.org/10.1146/annurev-matsc
i-070616-1242475 (1992).
29. Skuja, L., Hirano, M. & Hosono, H. Oxygen-related intrinsic defects in glassy SiO2: interstitial ozone molecules. Phys. Rev. Lett.
84, 302–305. https://doi.org/10.1103/PhysRevLett.84.302 (2000).
30. Skuja, L. Optically active oxygen-deficiency-related centers in amorphous silicon dioxide. J. Non-Cryst. Solids 239, 16–48. https
://doi.org/10.1146/annurev-matsci-070616-1242477 (1998).
31. Skuja, L. & Naber, A. Site-selective luminescence study of defects in gamma-irradiated glassy germanium dioxide. Nucl. Instrum.
Methods Phys. Res. Sect. B 116, 549–553. https://doi.org/10.1016/0168-583X(96)00106-1 (1996).
32. Sakurai, Y. & Nagasawa, K. Correlation between 1.5 eV photoluminescence-band and 3.8 eV absorption band in silica glass. J.
Non-Cryst. Solids 261, 21–27. https://doi.org/10.1016/S0022-3093(99)00611-0 (2000).
33. Cha, J., Kubo, T., Takebe, H. & Kuwabara, M. Compositional dependence of properties of SnO-P 2 O 5 glasses. J. Ceram. Soc. Jpn.
116, 915–919. https://doi.org/10.2109/jcersj2.116.915 (2008).
34. Lagomarsino, S. et al. Refractive index variation in a free-standing diamond thin film induced by irradiation with fully transmitted
high-energy protons. Sci. Rep. 7, 385. https://doi.org/10.1038/s41598-017-00343-0 (2017).
Acknowledgements
This work was performed in-part at the OptoFab node of the Australian National Fabrication Facility, utilising
NCRIS & NSW state government funding. The project was supported by the Australian Research Council under
its Discovery Project Program (DE160100714, DP170104644). The authors acknowledge the use of facilities
supported by Microscopy Australia at the Electron Microscope Unit within the Mark Wainwright Analytical
Centre at UNSW Sydney.
Author contributions
S.G. conceived the work, T.T.F., K.P. and S.G. conducted the experiments and analysed the results. M.J.W super-
vised the study. All authors reviewed the manuscript.
Competing interests
The authors declare no competing interests.
Additional information
Correspondence and requests for materials should be addressed to T.T.F.
Reprints and permissions information is available at www.nature.com/reprints.
Publisher’s note Springer Nature remains neutral with regard to jurisdictional claims in published maps and
institutional affiliations.
Open Access This article is licensed under a Creative Commons Attribution 4.0 International
License, which permits use, sharing, adaptation, distribution and reproduction in any medium or
format, as long as you give appropriate credit to the original author(s) and the source, provide a link to the
Creative Commons license, and indicate if changes were made. The images or other third party material in this
article are included in the article’s Creative Commons license, unless indicated otherwise in a credit line to the
material. If material is not included in the article’s Creative Commons license and your intended use is not
permitted by statutory regulation or exceeds the permitted use, you will need to obtain permission directly from
the copyright holder. To view a copy of this license, visit http://creativecommons.org/licenses/by/4.0/.
© The Author(s) 2020
Scientific Reports | (2020) 10:15142 | https://doi.org/10.1038/s41598-020-72234-w 8
Vol:.(1234567890)You can also read