Recovered Resources Market Bulletin - March 2021
←
→
Page content transcription
If your browser does not render page correctly, please read the page content below
Recovered Resources Market
Bulletin
March 2021
Victorian Market Intelligence Project (edition #17)
This report was prepared for the Waste Management and
Resource Recovery Association of Australia (WMRR) and
Sustainability Victoria (SV) by Envisage Works,
IndustryEdge and Sustainable Resource Use (SRU).

While reasonable efforts have been made to ensure that
the contents of this publication
are factually correct, WMRR and Sustainability Victoria
gives no warranty regarding its accuracy, completeness,
currency or suitability for any particular purpose and to the
extent permitted by law, does not accept any liability for
loss or damages incurred as a result of reliance
placed upon the content of this publication.

This publication is provided on the basis
that all persons accessing it undertake
responsibility for assessing the relevance and accuracy of
its content.

This report is licensed under a Creative
Commons Attribution 4.0 Australia licence.
In essence, you are free to copy, distribute and adapt the
work, as long as you attribute the
work and abide by the other licence terms.
Go to http://creativecommons.org/licenses/by/4.0/
to view a copy of this licence.

Accessibility
This document is available online in PDF format at
https://www.sustainability.vic.gov.au/Business/Investment-
facilitation/Recovered-resources-market-bulletin

Release date
May 2021

2
CONTENTS
CONTENTS 3
Summary 4
Market overview 4
Kerbside recycling markets: January to March developments 5
Market implications and investment opportunities 8
1. Introduction 10
1.1 About this bulletin 10
Who is this bulletin for? 10
Structure of the bulletin 10
History and context 11
1.2 Overview of kerbside recycling flows 11
1.3 Market risks, opportunities and activities 13
1.4 Export market review 15
1.5 Overview of status of countries with post-consumer import restrictions 16
2. Resource markets 19
2.1 Kerbside recovered paper & paperboard 19
2.2 Kerbside recovered glass packaging 23
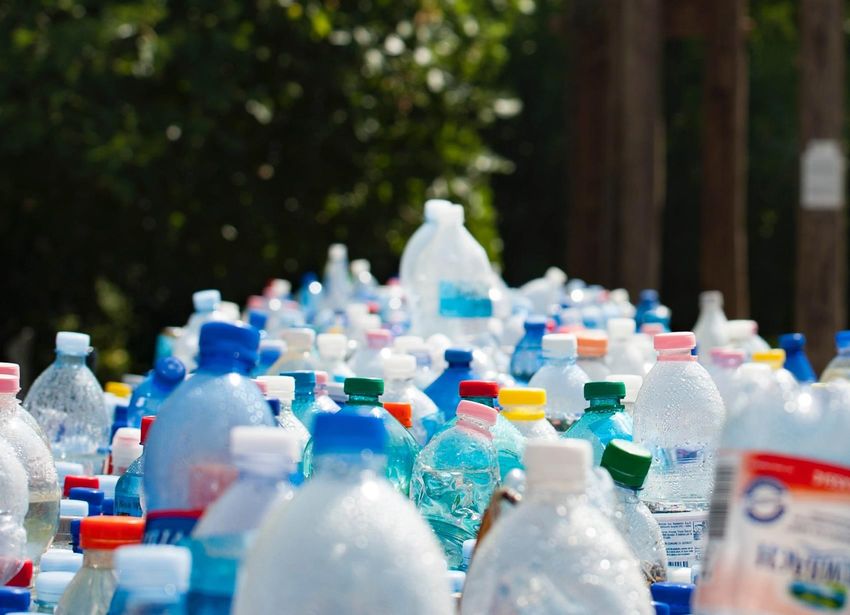
2.3 Kerbside recovered plastic packaging 27
2.4 Kerbside recovered metal packaging 33
3. Special topics 38
3.1 Packaging in context – What is the contribution of packaging to the total flows of end-of-life materials in Victoria?
38
3.2 China’s import bans, rising pulp prices and the implications for recovered kerbside paper 39
4. Supporting material 41
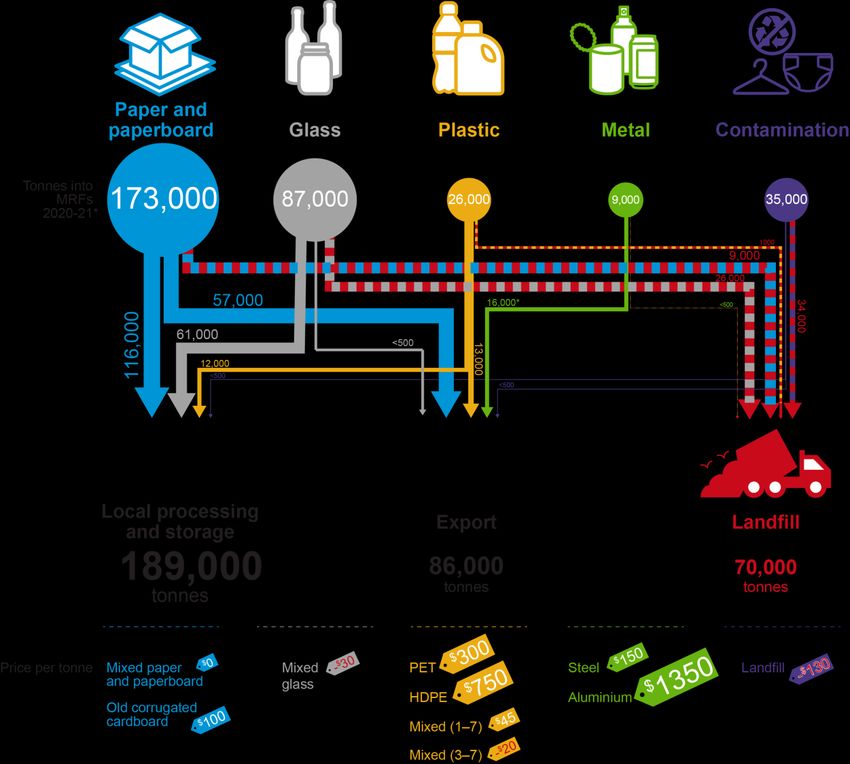
3Summary This is the 17th of a series of monthly to quarterly bulletins that Sustainability Victoria (SV) and the Waste Management and Resource Recovery Association of Australia (WMRR) are distributing to the community, industry and government to provide an overview of the kerbside recycling markets in Victoria. The bulletins provide an up-to-date picture of the health of resource recovery markets, ongoing challenges and opportunities in the sector, and details of the actions taken to improve the resilience and recovery performance of kerbside recycling. This bulletin includes export data to the end of January 2021, and pricing updates to the end of February 2021. Following a successful 12-month pilot program and evaluation, SV and WMRR are producing additional bulletins while considering a future bimonthly or quarterly release. This bulletin is the sixth of these 'interim' bulletins. The bulletin format may also be updated, but the core time- series kerbside market datasets will continue. Market overview Provided in Figure 1 below is an overview of the flows of kerbside collected recyclables over the 7-month period of July 2020 to January 2021. Prices are for end-February 2021. Figure 1 – Flows of kerbside collection materials in Victoria collected during July 2020–January 2021* * Note that flows are for the 7-month period of July 2020 to January 2021 only. Metal exports are higher than collections due to removals from stockpiles.
Kerbside recyclable materials sent to landfill
Of the 330,000 tonnes of kerbside materials collected 260,000 tonnes or 79% were sent to
downstream processing (including export of 86,000 tonnes), and 70,000 tonnes or 21% was
sent to landfill across July 2020 to January 2021.
The disposal rate to landfill represents an increase of 3-4% over longer term average of 17–
18% of materials to landfill. Industry has reported the following reasons for the higher
contamination rate:
   •   increased levels of gross contamination in kerbside bins material during the
       coronavirus (COVID-19) pandemic period (10% contamination), combined with
   •   increased levels of landfilling of very low value sorted kerbside recyclables that do not
       have viable end-markets (11% losses of recyclables, primarily glass fines).
Stockpiling at the metropolitan MRF operator sites is not believed to be significant as of March
2021.
Kerbside materials exported
Victoria has a heavy reliance on the export of recyclable materials. In January 2021 Victoria’s
exports were:
   •   43% of national exported post-consumer paper & paperboard (44,000 tonnes of
       101,000 tonnes). 41% exported in December and 46% in November 2020.
   •   41% per cent of national exported post-consumer plastic (3,800 tonnes of 9,400
       tonnes). 50% exported in December and 46% in November 2020.

The exports outlined above include material sourced through commercial and industrial
collections (in addition to municipal kerbside collected materials), and some interstate material
(e.g. from Tasmania). However, the data illustrates the strong dependency of Victorian post-
consumer markets on export markets, and the continuing need for additional local
remanufacturing capacity and demand in Victoria.
This is particularly the case in the context of the unprocessed scrap export bans which are
being phased in over the next few years. From the 30 June 2021, exports of mixed polymer
and unreprocessed scrap plastics will be banned, likely precipitating a sharp drop in the exports
of post-consumer plastics.

Kerbside recycling markets: January to March developments

Market-wide developments
Development 1 – Recycled commodity prices are generally trending up. However, this
has had minimal impact on the value of mixed paper & cardboard and glass recovered
from kerbside collections. To the end of February 2021 there were significant increases in
the commodity values for clean cardboard (but not mixed paper & cardboard), plastics and
metals.
Development 2 – China has banned the import of all contaminated or unprocessed solid
wastes from January 2021. Under new legislation announced in April 2020 and implemented
in January 2021 China has banned the imports of all solid wastes, but with exemptions for
recovered materials that are defined as resources rather waste. Examples of these exempted
materials include scrap metals, high quality grades of scrap paper and cardboard, and
processed plastics.
Development 3 – MRFs and reprocessors are generally operating as usual. There were
no significant reported disruptions to major Materials Recovery Facility (MRF) operators or
downstream reprocessors as of mid-March.

                                                                                                5
Paper & paperboard Development 4 – Exports of recovered paper to China ended in 2020, disrupting global fibre markets and causing local exporters to find new markets – most recently Indonesia. Development 5 – Global virgin pulp prices exploded in January and February 2021, driving up international fibre prices, including for recovered paper. This is likely to be a temporary development, with market equilibrium still some way off. Development 6 - Newsprint and other mechanical fibre continues to go to secondary (smaller) local markets, especially pet care and moulded fibre. 6
Glass packaging
Development 7 – Visy has announced major expenditure on glass packaging recycling.
As part of its acquisition of the Owens Illinois (O-I) glass business, it is expected that
substantial funding will go into upgrading and increasing the capacity of glass packaging
furnaces including at Spotswood in Melbourne. Recent media statements by Visy Glass
indicates a target to produce bottles from 70% recycled content (up from 30–35% presently),
this should increase national demand for this material from around 400,000 tonnes/yr to over
700,000 tonnes/yr.
Development 8 – The limits on the export of glass. The bans on export of unprocessed
waste glass commenced 1 January 2021. However, glass that has been processed to high
quality level, for example is ‘furnace ready’ as an input into new glass bottle manufacturing
overseas, is still able to be exported with the appropriate license
Development 9 – Major expansions of glass beneficiation capacity by Cleanaway. A
major expansion of glass beneficiation will be constructed by Cleanaway in Melbourne to
process glass packaging from its MRF operations and other sources such as CDS sourced
material. The plant will have a capacity over 100,000 tonnes and be operational at the end of
2022. The Cleanaway plant will receive $3 million in funding support from the Victorian
Government.
Development 10 – Glass sorting and processing facility in Mildura. The Mildura Rural City
Council has received a $228,750 grant from the Victorian Government to go towards the
construction of a regional sorting and glass processing facility in Mildura to process 5,300
tonnes annually of kerbside sourced material.
Development 11 – Glass sorting and processing facility in Warrnambool. Wheelie Waste
has received a $481,800 grant from the Victorian Government to go towards the construction
of a regional sorting and glass processing facility in Warrnambool, that will also bale paper and
plastic for transport.
Development 12 – Plant capacity optimisation by Repurpose It for road material
applications for glass packaging. Funding of $400,000 has also been announced for
Repurpose It to increase its capacity to process glass for road construction applications. The
upgrade of its Epping site will include an additional centrifuge and material storage bunker.
Development 13 – Local Government draft transition plans for separate glass collection.
All Victorian councils have been asked to develop draft transition plans for the Household
Recycling Reform Program. This includes the introduction of a bin for glass recycling. Each
Council has been asked to submit their plans, including implementation dates, expected
collection volumes and cost of establishment and ongoing collection.
Dates for implementation vary from those already underway through to 2027. It is expected
that most urban councils will opt for a monthly kerbside collection utilising a purple lidded 80 L
bin. Some regional/rural councils may adopt a drop-off system for glass. Modelling for these
upgraded systems suggest an estimated 25–30% of container deposit eligible bottles will be
returned by consumers for deposit recovery with the majority coming through the kerbside
collection system.
Plastic packaging
Development 14 – Prices for recovered HDPE bottles have continued recovering since
October 2020 and are now at the highest levels seen in the last four years at least.
Natural HPDE (e.g. milk bottles) packaging scrap prices are very strong as of March 2021,
and the material is highly sought after both locally and overseas.
Development 15 – Prices for recovered PET bottles have improved and are now back
at pre-pandemic levels. PET packaging scrap prices have grown much less strongly than
HPDE, but are still much improved. There are very strong potential end-markets for more
rPET supply.

                                                                                                 7
Development 16 – There is significant new mixed kerbside sorting and reprocessing
capacity coming on-line in Victoria near the end of 2021. There are a number of Victorian
based plastics reprocessors installing new PP and coloured HDPE capacity. There are deep
local end-markets for kerbside recovered PP back into food contact and many other
applications.
Development 17 – There is significant new kerbside plastic packaging sorting and
reprocessing capacity coming on-line in Victoria near the end of 2021. There are a
number of Victorian based plastics reprocessors installing new PET, natural and coloured
HDPE and PP. There are deep local end-markets for all these polymers, including coloured
HDPE and PP when reprocessed to a high quality.
Metal packaging
Development 18 – Prices for recovered tin-plate steel cans and aluminium beverage
cans have recovered strongly from mid-2020 lows. Prices for both tin-plate steel cans
and aluminium beverage cans have both increased by 40–45% from the lowest prices seen
in more than 4 years in mid-2020.
Development 19 – Exports of tin-plate steel cans and aluminium beverage cans are at
the highest levels seen since early 2015. Export markets for scrap metal packaging appear
healthy and moving well, with market recovery from the pandemic dip (mid-2020) now in the
past. The current high prices are probably reducing stockpiles of baled cans built-up by MRF
operators and scrap metal traders during the period of very low prices across the 2020
calendar year.
Market implications and investment opportunities
Here we develop a future looking synthesis of the key implications of recent developments,
and also provide a quick summary of some of the key investment opportunities that are
potentially available. These include minor updates from those reported in bulletin #16.
Market implications
• Recycled commodity prices are generally trending up: To the end of February
2021 there were significant increases in the commodity values for clean cardboard (but
not mixed paper & cardboard), plastics and metals.
• Increasing the flow of glass back into packaging. With the significant drawdown on
glass stockpiles, the priority turns to the expansion of beneficiation capacity to facilitate
an increased flow of recycled glass back into bottle production.
• Sufficient increases in reprocessing capacity and end-markets for kerbside
mixed-paper are not on the horizon. Even with hugely increased reprocessing
capacity the end-markets for recovered fibre from kerbside mixed paper processing do
not currently exist in Australia.
• Increases in reprocessing capacity and end-markets for kerbside mixed-plastics
are in the pipeline. Significant increases in reprocessing capacity for PET, HDPE and
PP are either underway or under advanced consideration. Local end-markets for high
quality processed rPET, rHDPE and rPP appear strong. However low value plastics
impacted by the export ban require designing out or other action, or will be destined for
landfill.
Investment opportunities
Market-wide
• Ongoing education program to reduce kerbside contamination.
• MRF modifications for improved separation and contaminant control, supported by
improved packaging design to reduce incoming low value or problematic packaging.
8• Community recycling drop off points with a focus on cardboard, EPS, and soft plastics.
• Safe undercover bale storage with sprinklers.
Fibre
• Large scale pulping capacity for recovered paper, either separately or integrated with
virgin fibre manufacturing.
• Reprocessing of coated paper and board, especially polymer coated, into non-paper
products.
• Procurement of locally manufactured recycled products to encourage reprocessing
investment.
• Commercial site cardboard compaction equipment.
Glass
• Beneficiation capacity increase. Either new plant or expansion of existing capacity to
accommodate Cleanaway MRF generation and the new kerbside glass bin and CDS
collected glass over the next couple of years.
• Glass kerbside bin purchase. Potential state/local government shared cost of rollout
linked to uniform bins with maximum recycled content, purple lids and hot stamped
education message.
Plastics
• Reprocessing equipment for HDPE and PP from consumer sources. Preferably into
food grade quality resin.
• Wash equipment for new and existing plastics recycling plants.
• Separation equipment for PET/PE/PP at MRF or reprocessing sites.
91. Introduction
1.1 About this bulletin
This is the 17th of a series of monthly bulletins that Sustainability Victoria (SV) and the Waste
Management and Resource Recovery Association of Australia (WMRR) are distributing to the
community, industry and government to provide an overview of the kerbside recycling markets
in Victoria.
This bulletin includes updates related to ABS export data to the end of January 2021, and
pricing updates to the end of February 2021.
The bulletins provide an up-to-date picture of the health of the markets, the ongoing challenges
and opportunities, and action taken to improve the resilience and recovery performance of
kerbside recycling.
The bulletins are a synthesis of monthly updates of ABS export data and published market
reports, and more in-depth quarterly updates informed by extensive consultation with industry,
government and community stakeholders.
Each bulletin includes a monthly update that includes:
• market overview and current developments
• export data and receiving country updates
• commodity price tracking
• kerbside quantity flow approximations
• market developments and activity updates.
A deeper look at two special topics is provided. The special topics explored in Section 3 for
this month are:
• Packaging in context – What is the contribution of packaging to the total flows of
end-of-life materials in Victoria?
• China’s import bans, rising pulp prices and the implications for recovered
kerbside paper.
SV and WMRR are currently evaluating the ongoing frequency and format for the bulletin,
potentially shifting to a modified format and quarterly basis going forward. We will keep all
subscribers updated on the plan for the future of the Recovered Resources Market Bulletins.
Please contact SV if you have any comments or questions on this bulletin, or suggestions for
future issues:
• Cate Turner – Manager Data, Insights & Intelligence (cate.turner@sustainability.vic.gov.au)
• Catherine Ng – Team Leader-Strategic Intelligence (catherine.ng@sustainability.vic.gov.au).
Who is this bulletin for?
This bulletin is for anyone with an interest in kerbside recycling in Victoria. It presents a holistic
overview of material flows and related markets, through generation, sorting, reprocessing, re-
manufacturing and end-product markets.
Structure of the bulletin
This bulletin has seven sections:
• Market summary – An overview of kerbside material flows, $ values, and the key
issues, opportunities and activities.
10• Introductory section (this section) – A more detailed and integrated overview of
kerbside material markets across all material types (paper & paperboard, glass
packaging, plastic packaging and metal packaging).
• Material specific sections – Four sections on each material groups (paper &
paperboard, glass packaging, plastic packaging and metal packaging). Each section
provides: an overview of the material markets; the latest available information on
prices, demand and supply; commentary on the key product end-markets for recovered
materials; export and/or interstate market activity; and a summary of market risks,
opportunities and developments.
• Special topic areas – A deeper look at one or two special topic areas each month.
History and context
Across the past decade there have been downturns in the recycled materials market caused
by the:
• Global Financial Crisis (GFC) in 2009.
• New Chinese regulations in 2011 aimed at reducing the imports of highly contaminated
post-consumer materials.
• Aggressive enforcement in 2013 by the Chinese of the 2011 regulations, through a
campaign known as 'Operation Green Fence'.
• Aggressive enforcement from the beginning of 2018 by the Chinese of the 2011
regulations, through a campaign known as 'National Sword'. Around half the world's
kerbside packaging was received by China until the end of 2017 and the enforcement of
these regulations has reduced these imports massively.
A key aspect of the latest Chinese restrictions is a maximum contamination threshold of
0.5 per cent for imported bales of post-consumer mixed paper & paperboard and mixed
plastics. This threshold is very low and MRFs internationally, including Victorian MRFs,
are not capable of meeting the 0.5 per cent contamination threshold.
• Global coronavirus (COVID-19) pandemic starting in early 2020, and still ongoing,
hampering international freight movements and country level manufacturing activity.
See bulletin #1 for a more detailed outline of the history and context of the issues explored in
these bulletins. All previous bulletins are available here.
1.2 Overview of kerbside recycling flows
Victorian kerbside recyclables collection and sorting systems have been fairly steady over the
past four years at around 550–600,000 tonnes per year. After operating losses of 150,000
tonnes of contaminant material and unrecovered recyclables an estimated 430,000 tonnes are
available for reprocessing (2020 estimates). Paper grades and glass account for 85 per cent
or more of this processed material by weight.
Not all of the sorted recyclables are necessarily then processed further into materials ready for
the manufacture of new products, and across the 3-year period of 2016–17 to 2018–19
significant quantities of sorted and unsorted recyclables were placed into storage due to poor
markets or operational problems.
For reasons explored in detail in previous bulletins the disposal to landfill of stored recyclables
occurred at very high levels across 2019–20. However, this disposal was largely completed by
May 2020.
11Figure 1.2.1 and Table 1.2.1 provides estimates of annual MRF outputs. Note that 2020–21
data is part-year data for the 7 months across July 2020–January 2021 only. Also note that the
reduction in storage during 2019–20 of 274,000 tonnes of stored material, which was mostly
sent to landfill, contributes to the landfill (orange) quantity. Quantities of stored recyclables are
now at the lowest levels since 2017 at least.
Figure 1.2.1 – Victorian MRF outputs by material category (tonnes)
Note: 2020–21 data is partial financial year across the 7 months July 2020–January 2021.
Table 1.2.1 – Victorian MRF outputs by material category, including stockpiled material estimates
Material category 2015–16 2016–17 2017–18 2018–19 2019–20 2020–21
(tonnes) (tonnes) (tonnes) (tonnes) (tonnes)
Paper & paperboard 330 000 280 000 250 000 220 000 250 000 160 000
Glass 100 000 110 000 30 000 50 000 150 000 60 000
Plastic 50 000 40 000 40 000 40 000 40 000 20 000
Metal 20 000 10 000 20 000 10 000 16 000 20 000
Storagea 0 50 000 110 000 90 000 - 274 000 0
Landfillb 100 000 100 000 140 000 150 000 410 000 70 000
Totals 600 000 590 000 590 000 560 000 592 000 330 000
Source: SV (2017; 2018; 2019; 2020) and industry consultation.
a) Note the storage growth across 2015–16 to 2018–19, which reversed sharply in 2019–20.
b) Includes an estimated 30–40,000 tonnes of fire-related losses in July 2017, 20,000 tonnes of licence compliance
related disposal in March 2019, and 220,000 tonnes of operational and safety related disposal in 2019–20.
12Figure 1.2.2 presents indicative monthly data on the destinations of Victorian MRF outputs.
Exports of kerbside materials fell in 2017 and then more sharply in 2018. Movement across
2019 to 2021 has been up and down, but with no distinct longer-term trend.
Figure 1.2.2 – Destination of Victorian MRF outputs from kerbside sources (tonnes/month)
Note 1: Data in the table above have been estimated based on publicly available sources, with totals verified through
consultation.
Note 2: Historical total monthly MRF outputs have been approximated to enable comparison with monthly ABS
customs export data. ‘Local reprocessing’, ‘Landfill’ and ‘Storage change’ estimates are indicative only.
Note 3: The ‘Storage change’ plot is an estimation of the change in material stored or stockpiled in that month.
Note 4: Storage includes estimates of both sorted and baled materials, and unsorted (but baled) materials. It
excludes longer-term stored materials from before January 2015, which is most significantly legacy glass storage.
Note 5: Landfill estimates include MRF licence compliance related disposal to landfill, and fire related losses to
atmosphere. Landfill data presented are an approximation based on annual waste to landfill rates.
Source: ABS (2021) and Envisage Works.
1.3 Market risks, opportunities and activities
Victoria has a heavy reliance on exporting kerbside materials. In January 2021 Victoria made
up an estimated 42% of Australian exports of post-consumer materials that might have a
kerbside source, compared with 40% in December and 43% in November. Averaged across
the 2020 calendar year Victoria made up an estimated 36% of Australian exports.
Recovered paper exports fell sharply across April-August 2020 to the lowest levels since
January 2015 at least. However, there has been strong recovery since September 2020 back
to pre-pandemic levels. Prices for all grades of recovered paper and paperboard have been
fairly steady over the January 2020 to February 2021 period, however, strong growth in prices
is anticipated from April following large increases in virgin fibre pricing.
Since September 2020, sorted PET and HDPE packaging, steel cans, and aluminium cans
have all seen significant price increases, rebounding from the close to record lows seen during
the pandemic period.
13Figure 1.3.1 – Victorian recovered kerbside materials commodity values ($/tonne) Source: Industry consultation and published sources. Prices are approximated at the out-going MRF gate and to end-September 2020. Prices are indicative only. Table 1.3.1 provides pricing on selected virgin material commodities that are (generally) competing with recycled material. It is important to note that the kerbside material commodity values presented in Figure 1.3.1 are estimated prices at the out-going MRF gate, and prior to any secondary processing (and the associated processing costs). It is important to note that the very low or negative prices presented above are indicative only, as little or no spot market trading occurs. 14
Table 1.3.1 – Virgin material commodity values end-February 2021 ($AUD/tonne)

 Material category                            Value            Comments
 Fibre – Bleached softwood kraft (BSK) pulp   $1100–$1200      BSK and BHK pulps are not directly competing with
                                                               recycled fibre in the Australian market. Values provided to
 Fibre – Bleached hardwood kraft (BHK) pulp   $750–$850        give some context on virgin pulp prices.
 Glass – Virgin material inputs               $600–$700        Estimate based on typical flint glass composition.
 Plastic – PET (1) virgin resin               $1,400–$1,500    -
 Plastic – HDPE (2) virgin resin              $1,400–$1,500    -
 Plastic – PVC (3) virgin resin               $1,200–$1,400    Unplasticised PVC.
 Plastic – LDPE (4) virgin resin              $1,400–$1,500    -
 Plastic – PP (5) virgin resin                $1,550–$1,650    -
 Plastic – PS (6) virgin resin                $1,900–$2,000    -
 Steel                                                         London Metal Exchange (LME) post-consumer
                                              $400–$450
                                                               steel scrap price
 Aluminium                                    $1,900–$2,000    LME aluminium alloy

    1.4       Export market review
A summary of Victorian exports since January 2015 is provided in this section. In January
2021, Indonesia, Malaysia, Korea, India and Pakistan were the main export destinations for
Victorian recovered kerbside materials. See Figure 1.4.1 for Victorian exports of kerbside
materials, by country of destination, across the period of January 2015 to January 2021.
Exports across the first 7 months of 2020–21 were an estimated 72,000 tonnes, compared to
83,000 tonnes across the corresponding 7 months in 2019–20.

Figure 1.4.1 – Victorian recovered kerbside materials, to export country (tonnes/month)

Source: ABS (2021) and Envisage Works

                                                                                                                  15
Table 1.4.1 provides annual Victorian exports of kerbside materials, by country of
destination, across the period of 2015–16 to 2020–21. Since 2016 Victoria has dramatically
reduced exposure to China as a destination. Table 1.4.2 provides the monthly change in
Victorian kerbside exports, by destination country, for December 2020 and January 2021.
Table 1.4.1 – Annual Victorian recovered kerbside materials, to export country (tonnes/yr)
2015–16 2016–17 2017–18 2018–19 2019–20 2020–21b
Countrya
(tonnes) (tonnes) (tonnes) (tonnes) (tonnes) (tonnes)
Indonesia 47 000 25 000 42 000 46 000 38 000 24 000
Malaysia 4 000 7 000 32 000 23 000 33 000 8 000
Korea 0 1 000 4 000 6 000 5 000 4 000
India 14 000 13 000 14 000 16 000 21 000 9 000
Pakistan 2 000 2 000 2 000 1 000 2 000 2 000
China 234 000 198 000 74 000 50 000 28 000 11 000
All other 22 000 20 000 25 000 29 000 20 000 15 000
Total 323 000 266 000 193 000 171 000 147 000 72 000
Source: ABS (2021) and Envisage Works
a) Countries ranked by average of last three months of exports.
b) Partial year across July 2020 to January 2021.
Table 1.4.2 – Most recent monthly exports in Victorian recovered kerbside materials, to export country
December 2020 January 2021 % change
Countrya
(tonnes) (tonnes) (%)
Indonesia 4 000 6 200 55%
Malaysia 1 200 1 300 8%
Korea 600 600 0%
India 1 200 1 100 -8%
Pakistan 300 300 0%
China 1 400 400 -71%
All other 2 300 2 500 9%
Total 11 000 12 400 13%
Source: ABS (2021) and Envisage Works
a) Countries ranked by average of last three months of exports.
1.5 Overview of status of countries with post-consumer import
restrictions
Provided here is an overview of the status (as of March 2021) of countries that receive major
kerbside related post-consumer exports from Australia, with a focus on the implications for
Victorian exports.
Bangladesh
No identified changes in import conditions. There have been no specific import restrictions identified for
paper and paperboard, and the identified requirement for post-consumer plastics imports is that they do
not contain any toxic or radioactive substances.
16China
Existing restrictions on post-consumer plastic, paper, metals, and other types of post-consumer
materials. No change to the import restrictions which began in March 2018 and became more extensive
at the end of 2018. The contamination threshold is currently 0.5 per cent. Import licences for scrap are
now issued on a restricted and shorter term national needs basis.
On the 29 April 2020 China's National People's Congress Standing Committee approved legislation to
move China towards "gradually realising zero import of solid waste". Under the new legislation
announced and approved in April 2020 and implemented in January 2021 China has banned the imports
of all solid wastes, but with exemptions for recovered materials that are defined as resources rather
waste. Examples of these exempted materials include scrap metals, high quality grades of scrap paper
and cardboard, and processed plastics.
India
India announced bans in March 2019 prohibiting post-consumer ‘solid plastic’ from being imported into
the country, including in special economic zones. However, this ban was lifted in January 2021.
It was reported in January 2020 that India is planning on tightening its quality standards and imported
mixed paper will be allowed a maximum of 1% contamination. Increased inspections are also reported,
and this is elevated inspection regime is understood to be ongoing.
Indonesia
It was reported in early bulletins that as of 1 April 2019 all (100 per cent) post-consumer paper imports
into Indonesia will be inspected at ports (up from around 10 per cent previously). However, in practice,
it appears so far that inspection rates are somewhat elevated, rather than covering all imports.
The contamination threshold (impurity limit) was set to 2 per cent in May 2020, which is significantly
higher than the 0.5 per cent for China.
In October 2020, Indonesian authorities announced that exporters will need to complete a registration
process to continue exporting to Indonesia, which is understood to have come into force in January
2021, however, this has not been confirmed.
Korea
In January 2021 Korea announced bans or restrictions on scrap plastics and scrap paper imports, with
the bans or restrictions to come into force in 2022.
Malaysia
Restrictions implemented from July 2018, with a significant impact on post-consumer plastics imports.
Many import permits were revoked following these restrictions coming into force. In May 2019, reports
circulated in the media regarding further import restrictions for waste plastics. Malaysia has sent
relatively small quantities of kerbside materials back to Australia in 2019, but nothing in 2020 was
observed.
Taiwan
Restrictions on post-consumer paper and plastics implemented from October 2018, with only OCC and
other higher quality grades accepted. There are also restrictions on post-consumer plastics. Little
material from Victoria has been shipped to Taiwan.
Thailand
Restrictions on post-consumer plastics implemented from August 2018, which escalated over the next
two years, with tighter controls on e-waste imports also foreshadowed but its status is unclear. Low
quality plastic waste imports may be banned from either later in 2021 or in 2022.
Vietnam
Restrictions on post-consumer plastic, paper, metals and other types of post-consumer scrap products
implemented from around August 2018, with further tightening of post-consumer imports from late
February 2019. Low quality plastic waste imports may be banned from 2025.
17In September 2020 Vietnam published new directives on the import of various wastes, which included a ban on unsorted scrap paper imports by the end of 2021. 18
2. Resource markets
   2.1     Kerbside recovered paper & paperboard

Market developments this month
Development 1 – Exports of recovered paper to China ended in 2020, disrupting global fibre
markets and causing local exporters to find new markets – most recently Indonesia.
Development 2 – Global virgin pulp prices exploded in January and February 2021, driving
up international fibre prices, including for recovered paper. This is likely to be a temporary
development, with market equilibrium still some way off. The impact of this on low-quality and
low-value mixed paper and cardboard from kerbside has not been significant to date.
Development 3 - Newsprint and other mechanical fibre continues to go to secondary (smaller)
local markets, especially pet care and moulded fibre.
Material overview and market summary
Like many commodities, fibre (whether virgin or recovered) is integrated to a large and
sophisticated global supply chain. In that context, global conditions impact on local supply,
prices and market dynamics, often as much as local conditions themselves.
In early 2020, China implemented the well-foreshadowed importation ban on recovered fibre.
The disruption to the global markets – to some extent already factored in – was dramatic and
immediate.
Prices for virgin pulp exploded as Chinese producers were forced to replace literally millions
of tonnes of OCC, with a variety of alternatives. The price of the two major virgin pulp grades
provide the example for all pulp products: Bleached Softwood Kraft (BSK) pulp saw prices rise
USD115/t in January (17%) and a further USD85/t (11%) in February.
Inevitably, these massive price rises are impacting other fibre markets, including OCC.
In January, Victoria’s recovered paper export volumes lifted to near year-long highs and
compared with a month earlier, average export price shifted sharply. The price of Victoria’s
exports of OCC in January was almost 50% higher than the prior month, with shipments to
Indonesia and Korea rising.
For the Unsorted (mainly kerbside derived) volume, exports also lifted, with Indonesia the main
recipient and the average export price at the top of the recent range.
Returning to Victoria’s local market, outside of the export situation, kerbside recovered paper
& paperboard, as sorted by Victorian MRFs, is almost entirely produced as mixed paper &
paperboard bales that consist of; OCC (50%), boxboard /cartonboard (12%), liquid paperboard
(
The sole target of MRFs continues to be OCC, for both domestic and – where the quality is
good enough – export outcomes. Market pricing does not provide MRFs with any margin in
most cases, let alone to undertake significant positive sorts for the lower volume components
in the mixed paper stream.
More recovered fibre is destined for landfill, as previously reported. The hope of suitable,
replacement export markets has been realised in January, but the maintenance of those
markets is by no means certain.
There continues to be little or no driver for positive sorting of kerbside mixed paper. A small
number of collectors are doing positive sorts for targeted volumes, but the reality is that C&I
streams provide all the OCC local paper mills require. Positive sorts are being conducted for
newsprint and magazine grades, in some cases, where the main end-product is either moulded
fibre or pet-care products.

Figure 2.1.1 – Destination of Victorian MRF outputs (tonnes/month) – Kerbside paper & paperboard

Note 1: Historical total monthly MRF outputs have been approximated in Figure 2.1.1 to enable comparison with
monthly ABS customs export data. The overall trends are the key aspect of the figure.
Note 2: The combined ‘Local reprocessing or storage’ estimate is indicative only, and these fates will be presented
separately if this level of data becomes available. Landfill excludes disposal from storage and is an approximation
based on annual waste to landfill rates.
Source: ABS (2021) and Envisage Works

Prices, demand and supply
Largely constrained by local contracts for corrugated boxes, reported local sales prices have
been stable most recently, but at levels that provide little encouragement to the recovery supply
chain.
Key end-markets and related specifications
There remain no new end-markets for kerbside recovered paper.

20
Export and interstate market review
Victorian recovered paper export volumes recovered progressively from October through
January. Higher Australian dollar prices have been supported by sharp increases in
international pulp prices.

Figure 2.1.2 – Victorian recovered kerbside paper & paperboard, to export country (tonnes/month)

Source: ABS (2021) and Envisage Works

 Table 2.1.1 – Annual Victorian recovered kerbside paper & paperboard, to export country (tonnes/yr)

                      2015–16          2016–17         2017–18       2018–19      2019–20          2020–21b
     Countrya
                       (tonnes)        (tonnes)         (tonnes)     (tonnes)     (tonnes)         (tonnes)
  Indonesia                45 000          22 000           34 000      32 000        34 000           21 000
  Thailand                  2 000            4 000          14 000      11 000        24 000           14 000
  Vietnam                   2 000            3 000           7 000      12 000         7 000            5 000
  Malaysia                  1 000            2 000          10 000        6 000       16 000            2 000
  India                     8 000          10 000           10 000      14 000        18 000            4 000
  Korea                           0               0          1 000        1 000        1 000                  0
  All other               207 000         176 000           72 000      54 000        29 000           12 000
  Total                   265 000         217 000         148 000      130 000       129 000           58 000
Source: ABS (2021) and Envisage Works
a) Countries ranked by average of last three months of exports.
b) Partial year across July 2020 to January 2021.

                                                                                                         21
Table 2.1.2 – Most recent monthly change in Victorian recovered kerbside paper & paperboard, to export
country (tonnes/month)
December 2020 January 2021 % change
Country
(tonnes) (tonnes) (%)
Indonesia 3 400 5 600 65%
Thailand 2 400 2 200 -8%
Vietnam 800 1 100 38%
Malaysia 300 500 67%
India 500 400 -20%
Korea 100 200 100%
All other 1 500 500 -67%
Total 9 000 10 500 17%
Source: ABS (2021) and Envisage Works
Market risks, opportunities and activities
Anticipated increasing OCC prices are likely to underpin some improvement in prices for the
mixed paper stream from kerbside sorting. However, access to many of these markets remains
dependent to some degree on the level of fibre consistency and contamination in the mixed
paper bales.
In particular, any mixed paper exports to Indonesia may come under increased scrutiny at
Indonesian ports due to the new registration process to continue exporting to Indonesia, which
is understood to have come into force in January 2021.
Key ongoing risks are the lack of local reprocessing capacity and end-markets for kerbside
mixed paper, and the poor business case for sorting the mixed paper into higher quality grades.
222.2 Kerbside recovered glass packaging
Market developments this month
Development 1 – Visy has announced major expenditure on glass packaging recycling.
As part of its acquisition of the Owens Illinois (O-I) glass business, it is expected that
substantial funding will go into upgrading and increasing the capacity of glass packaging
furnaces including at Spotswood in Melbourne. Recent media statements by Visy Glass
indicates a target to produce bottles from 70% recycled content (up from 30–35% presently).
Development 2 – The approaching limits on the export of glass. The bans on export of
waste, which were originally thought to prevent all glass packaging collected for recycling from
being exported, have been moderated to allow export in a more regulated and controlled form.
The export now requires documentation from the receiving recycler and the meeting of
specifications.
Development 3 – Major expansions of glass beneficiation capacity by Cleanaway. A
major expansion of glass beneficiation will be constructed by Cleanaway in Melbourne to
process glass packaging from its MRF operations and other sources such as CDS sourced
material. The plant will have a capacity over 100,000 tonnes and be operational at the end of
2022. The Cleanaway plant will receive $3 million in funding support from the Victorian
Government.
Development 4 – Glass sorting and processing facility in Mildura. The Mildura Rural City
Council has received a $228,750 grant from the Victorian Government to go towards the
construction of a regional sorting and glass processing facility in Mildura to process 5,300
tonnes annually of kerbside sourced material.
Development 5 – Glass sorting and processing facility in Warrnambool. Wheelie Waste
has received a $481,800 grant from the Victorian Government to go towards the construction
of a regional sorting and glass processing facility in Warrnambool, that will also bale paper and
plastic for transport.
Development 6 – Plant capacity optimisation by Repurpose It for road material
applications for glass packaging. Funding of $400,000 has also been announced for
Repurpose It to increase its capacity to process glass for road construction applications. The
upgrade of its Epping site will include an additional centrifuge and material storage bunker.
Development 7 – Local Government draft transition plans for glass separate collection.
All Victorian councils have been asked to develop draft transition plans for the Household
Recycling Reform Program. This includes the introduction of a bin for glass recycling. Each
Council has been asked to submit their plans, including implementation dates and cost of
establishment and ongoing collection.
Dates for implementation vary from those already underway through to 2027. It is expected
that most urban councils will opt for a monthly kerbside collection utilising a purple lidded 80
litre bin. Some regional/rural councils may adopt a drop-off system for glass. Modelling for
these upgraded systems suggest an estimated 25–30% of container deposit eligible bottles
will be returned by consumers for deposit recovery with the majority coming through the
kerbside collection system.
Material overview and market summary
There are currently two glass beneficiation plants operating in Victoria taking glass packaging
from kerbside collections and making this material furnace ready for use in manufacture of new
glass bottles. The combined annual capacity of these plants is just under 100,000 tonnes. This
is insufficient to handle the total volume of glass collected in kerbside recycling bins in Victoria,
which is in the order of 150,000 tonnes. It is also worth noting that around 280,000 tonnes of
end-of-life glass packaging is generated.
23Some of this 150,000 tonnes of glass is going into road base and a range of other applications
through companies such as Alex Fraser and Repurpose-It. Some is crushed into sand and
used in other applications.
With funding support of $3 million provided by the Victorian Government, Cleanaway has
announced they will be building a beneficiation plant with a capacity of 100–120,000 tonnes/yr.
The plant, in north West of Melbourne is expected to be operational at the end of 2022. This
will dramatically address the shortfall in plant capacity in Victoria and will be operational when
an expected increase in glass recovery comes from glass only kerbside collections and the
container deposit scheme for beverage packaging.
Stockpiles of glass have also been significantly reduced at sites controlled by Visy Recycling
and Polytrade. Stockpiled glass at other sites, including Alex Fraser, are also decreasing and
are not considered problematic.
There are a range of sites in Melbourne providing glass material into road construction
products. The recycled glass sand is blended with crushed brick, and then mixed with
quantities of crushed concrete, cement and water, into road base products that meet VicRoads
specifications. These products are being used on major Victorian Government projects such
as freeway upgrades and level crossing removals.
The demand for packaging glass-based sand replacement product is high in Victoria as it
competes well on price and quality with quarried sand.
As reported widely, the Victorian Government announced the statewide introduction of a glass
recycling service from 2021. State government support for local government introduction has
been announced.
There has also been an announcement that a container deposit scheme will be developed and
introduced, and this is also likely to result in significant new quantities of uncontaminated glass
suitable for use in new glass packaging, including increased diversion to recycling of packaging
glass that is currently going into kerbside bins.
A summary of the latest information on new glass bin service configurations is provided in the
following table. This table will be updated as more services commence across the state.
Table 2.2.1 – Glass bin (separate) service configurations
Council Frequency Bin size (L) Glass destination / Comments
Central Goldfields N/A N/A Five glass drop-off locations provided around the
council area.
Hobsons Bay Monthly 120 Currently Alex Fraser Group and construction.
Seeking beneficiation capacity.
Macedon Monthly 140 Currently Alex Fraser Group and construction.
Moyne Monthly 120 Fulton Hogan Warrnambool for local roads.
Surf Coast Monthly 140 Unknown
Warrnambool Fortnightly 120 Fulton Hogan Warrnambool for local roads.
Yarra Fortnightly 80 Alex Fraser Group, but with the intention to switch to
packaging use when possible. Full service to start in
November.
Source: SV.
Figure 2.2.1 provides data on movements in export and local destinations of kerbside collected
glass since the beginning of 2015. Exports of kerbside glass are generally low and sporadic,
and none have been seen from Victoria since May 2020 (to end-January 2021).
24Figure 2.2.1 – Destination of Victorian MRF outputs (tonnes/month) – Kerbside glass
Note 1: Historical total monthly MRF outputs have been approximated in Figure 2.2.1 to enable comparison with
monthly ABS customs export data. The overall trends are the key aspect of the figure.
Note 2: The combined ‘Local reprocessing or storage’ estimate is indicative only, and these fates will be presented
separately if this level of data becomes available. Landfill excludes disposal from storage and is an approximation
based on annual waste to landfill rates.
Source: ABS (2021) and Envisage Works
Prices, demand and supply
Gate fee rates for MRFs sending material for beneficiation can vary, based on quality and
quantities. Gate fees of $0 /tonne at the outgoing gate of the MRF (EXW MRF) to -$30 /tonne
are reported if the glass is going to beneficiation. Prices are even lower if the glass is going
into other applications (such as road construction).
The cost of beneficiation for food grade packaging is estimated at around $150–$200 /tonne
but is dependent on the source and processing requirement of the incoming glass.
Following beneficiation Visy Glass then receives the glass cullet from beneficiation plants in
most major cities nationally, including Melbourne at its Spotswood facility. The price paid at
these facilities has remained largely unchanged in recent years.
The reduced beneficiation capacity has restricted the amount of glass suitable for production.
There is an increased focus on addressing this shortfall in beneficiation capacity.
Delivered MRF sorted mixed glass destined for road base or asphalt production incurs a gate
fee that is greater than the fee into beneficiation, but less than a landfill gate fee. On average
it is expected to be around -$50-80 /tonne (so a significant cost to the MRF operators).
Key end-markets and related specifications
Beyond taking used glass packaging back into packaging production, for which there may only
be a future national demand of 0.5 million tonnes nationally (leaving 0.7 million tonnes requiring
alternative uses), there are a range of other secondary markets that can be used, but these
do not offer a high market price. These include the major market of glass into asphalt, road
base material and sand for construction, and smaller markets for abrasives, and filter media.
25Export and interstate market review Glass cullet is generally not exported in significant volumes due to its low value and significant weight relative to shipping costs. Previous exports of glass cullet from Victoria have been almost entirely to either Malaysia or Bangladesh. From January 2021 all exports of glass packaging will require a license, with unprocessed glass not able to be exported. Market risks, opportunities and activities There are two major risks to glass recycling, the first of which relates to the fact that there is significantly more glass in supply than there is beneficiation capacity. This is being addressed through the announced Cleanaway beneficiation facility. The second major risk relates to national glass demand back into packaging, which cannot absorb all the packaging glass supply even if beneficiated, and so significant non-packaging end-markets for recovered glass will continue to be required, or exports markets for the beneficiated and (high-quality) unbeneficiated glass will be required. Other end-markets for the glass, such as the construction sector, are needed even though this results in the glass being down-cycled into construction materials. 26
2.3     Kerbside recovered plastic packaging

Market developments this month
Development 1 – Prices for recovered HDPE bottles have continued recovering since
October 2020 and are now at the highest levels seen in the last four years at least.
Natural HPDE (e.g. milk bottles) packaging scrap prices are very strong as of March 2021,
and the material is highly sought after both locally and overseas.
Development 2 – Prices for recovered PET bottles have improved and are now back at
pre-pandemic levels. PET packaging scrap prices have grown much less strongly than
HPDE, but are still much improved. There are very strong potential end-markets for more
rPET supply.
Development 3 – There is significant new mixed kerbside sorting and reprocessing
capacity coming on line in Victoria near the end of 2021. There are a number of Victorian
based plastics reprocessors installing new PP and coloured HDPE capacity. There are deep
local end-markets for kerbside recovered PP back into food contact and many other
applications.
Development 4 – There is significant new kerbside plastic packaging sorting and
reprocessing capacity coming on-line in Victoria near the end of 2021. There are a
number of Victorian based plastics reprocessors installing new PET, natural and coloured
HDPE and PP. There are deep local end-markets for all these polymers, including coloured
HDPE and PP when reprocessed to a high quality.
Material overview and market summary
Plastics collected through kerbside collections are generally sent to MRFs and sorted from
commingled recycling into either a single mixed plastics grade (1–7 plastic-polymer mix), or
more commonly three or four grades, which are PET, HDPE and the residual mixed plastics
grade (a 3–7 plastic-polymer mix, but with some residual quantities of PET and HDPE still
present). Two of the three major Victorian MRF operators are also positively sorting a PP
stream, which is a highly sought-after product.
Figure 2.3.1 provides data on the change in exports of kerbside recovered plastic packaging
since the beginning of 2015. The trend in exports across the second half of 2020 and into 2021
has been recovery from the near historical lows seen in mid-2020.

                                                                                            27
Figure 2.3.1 – Destination of Victorian MRF outputs (tonnes/month) – Kerbside plastic packaging Note 1: Historical total monthly MRF outputs have been approximated in the figure above to enable comparison with monthly ABS customs export data. The overall trends are the key aspect of the figure. Note 2: The combined ‘Local reprocessing or storage’ estimate is indicative only, and these fates will be presented separately if this level of data becomes available. Landfill excludes disposal from storage and is an approximation based on annual waste to landfill rates. Source: ABS (2021) and Envisage Works Baled PET and HDPE packaging is processed and remanufactured locally, and also exported to a range of countries. The main overseas destinations in the first 7 months of 2020–21 have been Malaysia (50%) and China (17%). Prices, demand and supply There continues to be strong local and export markets for clean PET bales that are collected and sorted to specification. However, due to competitive pressure from cheap virgin PET resin, internationally reported traded spot prices fell from $400 /tonne (EXW MRF) in June 2019 to around $230 /tonne in October 2020, the lowest price for perhaps a decade. However, prices have now recovered to around the $300 /tonne level. The price of recycled resin is linked to the price for virgin resin. PET resin prices had been experiencing the impact of long-term downward pressure towards the middle of 2020, due to massive new resin manufacturing capacity coming online globally, but this was offset to a degree by the deteriorating AUD/USD exchange rate to March 2020. However, the exchange rate has now increased by 25% increase across the March 2020 to February 2021 period (AUD0.62 to AUD0.78) it is now back to the same level as was last at 3 years ago. This will make virgin PET resin prices much cheaper in AUD, decreasing the competitiveness of recycled PET with virgin PET. However, complicating matters over the last couple of months, the major winter storms in the US (particularly Texas) shutdown a significant proportion of the US based resin manufacturing capacity, which has resulted in a recent price spikes for commodity resins such as PET, PE, PVC and PP globally. This will provide some short-term relief for recycled plastics markets here in Australia, against cheap virgin resin. 28
However, the longer-term picture of a global virgin resin manufacturing glut, and a strong AUD,
remain a significant anticipated problem for the competitiveness scrap markets here in Victoria
and Australia more widely.
The situation is similar to PET, but even more pronounced for HDPE. Prices for washed and
flaked material have recovered from the $400–$450 /tonne in September 2020, to the $700–
$800 /tonne level at end-February 2021.
Just like rPET, so also rHDPE prices have been subject to the countervailing forces of
generally increasing global virgin resin supply, temporarily impacted by reduced production in
the US, driving up prices, but the relatively strong AUD/USD exchange rate reducing local
virgin resin prices over the longer term.
Key end-markets and related specifications
Exported plastics packaging has specifications relating mostly to contamination levels. The
positive sorting of PET, HDPE and PP that is undertaken at MRFs allows the baled material to
generally meet these specifications without major difficulty or manual sorting input.
Previously plastics packaging has been overwhelmingly exported to China, until the latest
round of restrictions. Since September 2019 Malaysia has been the largest destination for
Victoria kerbside plastics. During the 2018–19 financial year Indonesia was the major
destination.
Across the first 7 months of 2020–21 China was still the second largest destination of post-
consumer plastics exported from Victoria, after Malaysia, and followed by Indonesia in third
place. However, this will not be able to continue after 30 June 2021, with the export ban on
mixed plastics commencing.
Export and interstate market review
Post-consumer plastic imports into Malaysia from Victoria have been fairly steady across the
since the beginning of 2019 to January 2021, averaging around 900 tonnes each month, albeit
with a fair degree of month-to-month variability. Imports into China appear to have stabilised
at around the 200–300 tonnes/month level over the same period.
Across the 2020 calendar year it is estimated that China received nearly 4,000 tonnes of scrap
plastics from Victorian kerbside recycling bins, compared with 21,000 tonnes sent to all export
destinations. If the new Chinese laws that ban importation of recovered materials from the
beginning of 2021 cover scrap plastics, which is expected to be the case, then the scrap
plastics currently sent to China will require new markets for sale.
Exports of kerbside recovered mixed plastic packaging have dropped dramatically over the
past few years (see Table 2.3.2), but appear to have stabilised somewhat in 2020–21.
The falls since the 2016–17 year were driven almost entirely by lost sales to China, with exports
to Indonesia and Malaysia taking up some of this material, but Indonesian exports also
collapsed at the end of 2019. The loss of the Chinese markets, and the saturation and
restriction of imports into Indonesia has left Victoria highly exposed to Malaysian import
conditions, albeit at a lower level than the historical level of exposure to China.

                                                                                               29
You can also read