Reducing barriers to electric vehicle uptake - Behavioural insights: Analysis and review - Ministry for the ...
←
→
Page content transcription
If your browser does not render page correctly, please read the page content below
Reducing barriers to
electric vehicle uptake
Behavioural insights: Analysis and review

Acknowledgements
The Energy Efficiency and Conservation Authority, Ministry of Transport and New Zealand
Transport Agency.

A report written by Mahesh Girvan and Edward Hearnshaw on behalf of the Behavioural
Insights Group at the Ministry for the Environment

Cover photo: Photo supplied courtesy of Energy Efficiency and Conservation Authority

This document may be cited as: Ministry for the Environment. 2018. Reducing barriers to
Electric Vehicle uptake: Behavioural insights analysis and review. Wellington: Ministry for the
Environment.

Published in October 2018 by the
Ministry for the Environment
Manatū Mō Te Taiao
PO Box 10362, Wellington 6143, New Zealand

ISBN:   978-1-98-852593-8 (online)

Publication number: ME 1388

© Crown copyright New Zealand 2018

This document is available on the Ministry for the Environment website: www.mfe.govt.nz.
Contents

Executive summary                                                                                                5

Chapter 1: Introduction                                                                                          9
     Reducing transport emissions                                                                                9
      Behavioural insights                                                                                     11

Chapter 2: Driving range                                                                                       13
     Barriers                                                                                                  13
      Biases                                                                                                   15
      Interventions                                                                                            16

Chapter 3: Charging infrastructure                                                                             20
     Barriers                                                                                                  20
      Biases                                                                                                   24
      Interventions                                                                                            26

Chapter 4: Upfront purchase price                                                                              30
     Barriers                                                                                                  30
      Biases                                                                                                   33
      Interventions                                                                                            35

Chapter 5: Conclusions                                                                                         40
     Empirical next steps…                                                                                     40

Appendix 1: Charging Basics                                                                                    42

Glossary                                                                                                       45

References                                                                                                     46

                             Reducing barriers to Electric Vehicle uptake: Behavioural insights analysis and review   3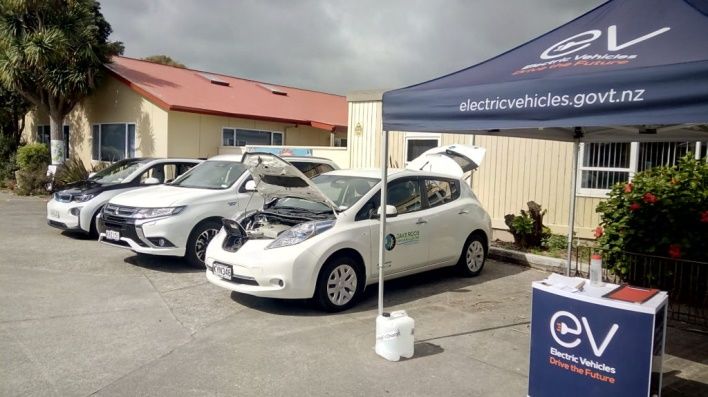
Tables
Table 1:      2011 second-hand vehicle comparison                                              31
Table 2:      2016 second-hand vehicles.                                                       31

Figures
Figure 1:     Number of EV registrations, 2014–2018                                            10
Figure 2:     Analytical structure of this report                                              11
Figure 3:     Ride-and-drive events offer EV driving practice (Source: EECA)                   18
Figure 4:     Public charging stations (NZTA)                                                  20
Figure 5:     “Compared to filling up at a petrol station, charging my EV at home is…”
              (Flip the Fleet, 2017)                                                           21
Figure 6:     Memory – a proposed system and its control processes                             26
Figure 7:     Light fleet year of manufacture for the fleets from 2000 onwards                 33
Figure 8:     Vehicle buying cycle                                                             36
Figure 9:     EAST Framework (Behavioural Insights Team, 2014)                                 37

4     Reducing barriers to Electric Vehicle uptake: Behavioural insights analysis and review
Executive summary
The New Zealand Government recognises the importance of reducing greenhouse gas (GHG)
emissions. To play our part, we need a particular focus on key sectors, including transport
which accounts for nearly a fifth of New Zealand’s gross GHG emissions. There is scope to
reduce the carbon footprint of our light vehicle fleet and improve its energy efficiency more
quickly by taking steps to promote electric vehicles (EVs).

New Zealand conditions are ripe for EV uptake, as over 80 per cent of our electricity is
generated from renewable sources, 1 the voltage of our electricity system allows every house
to charge an EV, and more than 85 per cent of homes can accommodate home charging.
However, there are only around 9,500 EVs in New Zealand as of July 2018 – less than
0.2 per cent of the vehicle fleet.

The purpose of this report is to identify barriers to EV uptake in New Zealand, discuss the
attitudes and behaviour behind them, and propose ways to overcome them.

The findings highlight that there are significant perceptual and behavioural barriers to
increasing light EV uptake by prospective buyers – driving range, publicly available fast
charging infrastructure and the upfront purchase price of new vehicles.

We propose interventions to help overcome biases that are holding back EV uptake. Changing
how New Zealanders think about EVs will take time and effort, but changing our approach to
education, awareness and marketing through behavioural insights may speed this EV
transition, which is vital to our low-emissions future.

Driving range
Early model EVs typically have a shorter driving range than equivalent internal combustion
engine (ICE) vehicles. As battery technology improves and costs decrease, EV range will
increase (without a cost premium). Prospective buyers may fear that they will run out of
battery and require vehicle assistance. This fear stems largely from our psychological fear of
avoiding losses (ie, loss aversion), which is related to the status quo bias (see box below).

Our analysis indicates that this bias is perceptual and can be addressed by reframing the issue
and via direct experience with EVs. Ninety per cent of daily vehicle travel in New Zealand is
90 kilometres or less; the average is only around 30 kilometres. This is well within the single
charge range of all available EVs. Likewise, home EV charging is available to most New
Zealanders. By emphasising actual driving needs and that charging at home overnight is the
simplest, cheapest and most convenient way to charge; we will present EVs as meeting most
people’s daily requirements with simple charging habits.

1   Carbon emissions from EV operations are only associated with the carbon intensity of electricity generation
    systems.

                                 Reducing barriers to Electric Vehicle uptake: Behavioural insights analysis and review   5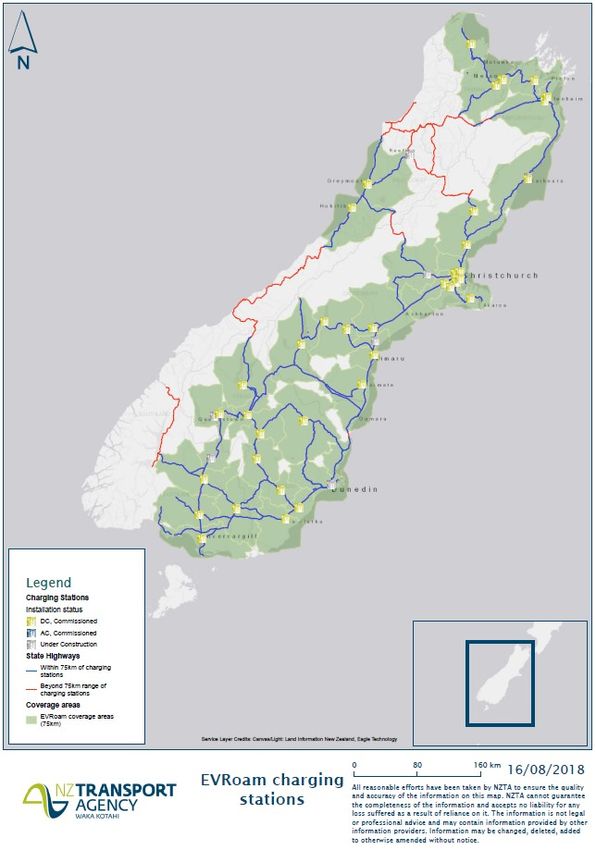
Loss aversion People are averse to losing. They feel the ‘pain’ of a loss at least two times more
         (and often three or more times) than the equivalent ‘pleasure’ of a gain.

         Status quo bias People when evaluating new products, like EVs, compare these products
         with a reference point, which is often the status quo (in this case, ICE vehicles). As a result,
         many buyers are unwilling and uncomfortable buying an EV because its driving range, while
         likely to meet their typical daily driving needs, is still significantly less than that of ICE vehicles.

         DRIVING RANGE: SOME SUGGESTIONS FOR IMPROVING EV UPTAKE

         For dealerships
         •     Use prompting questions to help buyers assess their actual driving habits. This will help
               them realise EVs can meet their daily driving needs.
         •     Emphasise that buyers can use an EV as the main vehicle for daily driving.
         •     If driving range is an issue, recommend purchasing a hybrid-EV or, renting a car for
               occasional long distance travel:
              •      Purchasing an EV over an equivalent ICE vehicle equates to roughly 18 to 36 car
                     rental days a year through reduced fuel costs 2
         •     However, those in the market for new models should be able to satisfy longer trips.
         •     Integrate trial drives into people’s daily routines through ride-and-drive activities and
               establishing partnerships with car rental companies to offer a discount to customers who
               purchase after a four to seven day rental.

         For Government
         •     Continue funding ride and drive experiences:
         •     EECA, through the Better New Zealand Trust, has supported more than 1200 EV test drive
               or ride experiences at community events around New Zealand in the last year.
         •     The Low Emission Vehicles Contestable Fund (LEVCF) has also co-funded projects which
               increase the visibility of EVs and provide opportunities for the public to experience an EV
               – such as car sharing scheme.

Charging infrastructure
New Zealanders are not widely familiar with EV charging infrastructure (including the public
network of charging stations, home charging units and charging time) and are used to having
simple access to petrol stations. For this reason, they think charging stations should be as
prevalent as petrol stations and that charging time should be less than five minutes – this
reflects the status quo bias. However, we suggest it also stems from the selective attention
bias, described below.

2
    18 car rental days assumed for peak periods at $100 a day and 36 days assumed at an off-peak rate of $50

6         Reducing barriers to Electric Vehicle uptake: Behavioural insights analysis and review
Our findings show this barrier is largely perceptual and can be addressed by:
•   highlighting the option of home charging
•   framing new charging habits (especially home charging) as a convenience.

After all, the vast majority of charging occurs at home and EV owners prefer recharging to
refuelling an ICE vehicle at a petrol station. 3

    Selective attention bias: People do not devote equal cognitive processing to all objects in the
    environment at any given moment, and are often oblivious to perceptual cues for objects they
    are not familiar with. Charging stations and signage fall into this category. People are unlikely to
    see or recall them during daily activities or after seeing them on a map. Studies show that
    prospective buyers can overcome this bias by:
    •    actively finding charging stations during daily practices
    •    experience or active engagement with EVs.

    CHARGING INFRASTRUCTURE: SUGGESTIONS FOR IMPROVED EV UPTAKE

    For dealerships and electricity retailers
    •    Train dealerships to simplify messages about charging stations and tools wherever
         possible, to limit complexity in the purchase.
    •    Show buyers maps of the national infrastructure network.
    •    Inform them that most EVs owners charge up at home, overnight using largely renewable
         electricity, often at discounted rates.
    •    Promote and advertise EVs with discounted rates for overnight and ‘smart charging’.

    For Government
    •    Continue to educate buyers about charging, as EVs can be charged from home, and can
         meet most daily driving needs. 4
    •    Improve visibility of charging stations.

High purchase price
New EVs are significantly more expensive than equivalent ICE vehicles at present. Our
findings indicate this is the biggest barrier to EV uptake globally and in New Zealand. However,
a total cost of ownership or five-year running cost approach shows that new EVs are the same
price or cheaper than equivalent ICE vehicles.

Used EVs, such as the 2016 Nissan Leaf, are roughly the same price as equivalent ICE vehicles,
such as the Ford Focus and Mazda 3. The 2016 Nissan Leaf reaches price parity with the

3
    Franke & Krems, 2013b; Bunce et al (2014); Graham-Rowe et al, 2012; Flip the Fleet, 2017.
4
    https://www.energywise.govt.nz/on-the-road/electric-vehicles/ev-charging/

                               Reducing barriers to Electric Vehicle uptake: Behavioural insights analysis and review   7
popular Toyota Corolla in roughly two and a half years through reduced fuel and
maintenance costs.

We highlight that hyperbolic discounting (below) can cause people to discount the total
financial benefits of EV ownership, despite fuel being six to seven times cheaper. Our findings
show that salient and effective product labelling can lessen the influence of this bias and help
prospective buyers make better, more informed long-term purchasing decisions. It will require
dealers and vehicle comparison websites to change how they present costs to buyers, and
emphasise the losses involved when buying an equivalent ICE vehicle.

    Hyperbolic discounting: People tend to focus on the upfront (short-term) costs of a product and
    often discount lower running (medium to long-term) costs. They give disproportionate
    weighting to upfront costs over the lifetime costs of vehicles.

    HIGH PURCHASE PRICE: SOME SUGGESTIONS FOR IMPROVED EV UPTAKE

    For dealerships
    •      Evidence shows effective label design can overcome myopia and hyperbolic discounting.
           Dealership and vehicle comparison websites should display the five-year running costs of a
           vehicle in bold, alongside the upfront price.
    •      Use loss aversion to highlight costs rather than savings. Tell prospective buyers that on
           average they will lose, for example, $1,460 per year and $6,140 over five years (through
           higher running costs), if they delay switching from an ICE vehicle to an EV.

    For Government
    •      Consider label design and the placement of five year total cost of ownership information
           upfront on vehicle comparison websites such as Fuel Saver, RightCar, and EECA’s vehicle
           total cost of ownership tool.

8       Reducing barriers to Electric Vehicle uptake: Behavioural insights analysis and review
Chapter 1: Introduction

Reducing transport emissions
Currently, the transport sector accounts for about 18.5 per cent of New Zealand’s gross
emissions. Projections indicate that by 2020, transport emissions will be 58 per cent above
1990 levels. This is a much higher increase than in any other sector.

Almost 90 per cent of New Zealand’s transport emissions are caused by road transport, with
light passenger vehicles accounting for the majority. Presently, New Zealand has the second
highest private vehicle ownership rate of OECD countries and the average age of the light
vehicle fleet is significantly older than other developed countries.

There is scope to improve the energy efficiency of light passenger transport more quickly by
taking steps to promote EVs. 5 The Ministry of Transport (2017) highlights that New Zealand is
one of the most EV-ready countries in the world for many reasons, including that:
•    over 80 per cent of electricity is generated from renewable sources, with increasing efforts
     to improve this percentage

•    the 230-volt electricity system means every home could easily charge an EV from existing
     outlets
•    more than 85 per cent of homes have off-street parking, allowing for simple home
     charging

•    lower maintenance costs – an EV has a fraction of the moving parts in a typical ICE vehicle.

5   There are two main types of EV. Battery EVs are fuelled only by the battery that is charged by plugging it
    into an electric power point (eg, Nissan Leaf, Tesla S). Plug-in hybrid EVs have two engines – one driven by
    a battery that is charged by plugging it into an electric power point, and the other fuelled from a tank that
    generally uses petrol or diesel (eg, Mitsubishi Outlander PHEV, Audi e-tron). Plug-in hybrid EVs should not
    be confused with hybrid vehicles, which do not charge by plugging in, even though they use many of the
    same technological elements to recapture energy efficiencies in the operation of their conventional ICE
    vehicle (eg, standard Toyota Prius, Honda Civic Hybrid).

                                Reducing barriers to Electric Vehicle uptake: Behavioural insights analysis and review   9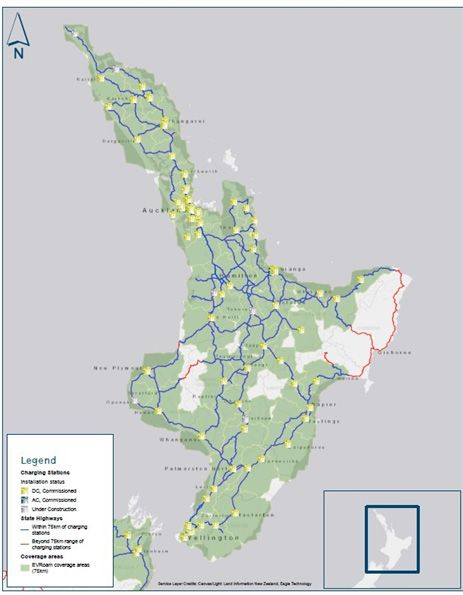
With these advantages, the widespread uptake of EVs offers New Zealand one of the greatest
opportunities to reduce transport emissions. For example, the Royal Society of New Zealand
(2016) indicate emissions from the road transport sector could decline from 2013 levels by at
least 60 per cent by 2050 if there is large-scale uptake of EVs and the introduction of other
measures such as fuel efficiency standards.

Some of these advantages are now being realised, with a greater use of EVs (see figure 1).
However, EVs still form less than one per cent of the light passenger vehicle fleet.

Figure 1:      Number of EV registrations, 2014–2018

Source: Ministry of Transport, 2018

Barriers to EV uptake
In spite of the considerable opportunity that EVs offer for reducing our GHG emissions, a
number of barriers still limit uptake. From the international and New Zealand transport
literature, especially that based on empirical analysis and evidence (ie, Ford et al, 2015; Zhu,
2016; Ipsos, 2017), key barriers have been widely identified including: driving range, charging
time, prevalence of charging stations, purchase price, and the unknown running and
maintenance costs. These issues are investigated further in this report.

Other barriers include low top speed and limited trunk size (Li et al, 2017). Both of these
barriers are not discussed further as they are relatively minor. However, two barriers that
could be considered to be major barriers not analysed further in this report is the length of
battery life and the limited variety of battery EV models available in New Zealand.

The length of battery life, while briefly discussed, is not extensively analysed at length in this
report. This is, in part, because EVs have not been in circulation long enough to gather
comprehensive information and understanding on the lifetime of EV batteries.

The limited variety of fully battery EV models available in New Zealand is not analysed further
because this barrier is out of scope of this report, as it depends largely on the supply-side
decisions of vehicle manufacturers rather than dealers or buyers. Nonetheless, currently there
are approximately 11 battery EV models available, and nearly all of these EV models are small
or mid-size vehicles, so prospective buyers wanting larger utility vehicles have, at best, limited
choice. Importantly, various vehicle manufacturers have announced plans to produce more EV
models. Volvo has announced that its entire fleet of models will be either battery electric or
hybrid electric by 2019.

10     Reducing barriers to Electric Vehicle uptake: Behavioural insights analysis and review
Behavioural insights
In May 2016, the Government introduced the EV programme with the aim of overcoming
barriers and increasing uptake. As part of the EV programme, the Energy Efficiency and
Conservation Authority (EECA) is running a multi-year information campaign using key
messages to convey the benefits of EVs and overcome the identified barriers. It aims first to
raise awareness and familiarise New Zealanders with EVs, and then focus on increasing the
number of buyers.
The need for EECA’s campaign is evident, as many studies (eg, Zhu, 2016; Ipsos, 2017) show
that New Zealanders have limited awareness and misperceptions about EVs. The Royal Society
of New Zealand (2016) indicated that in order to transition, knowledge gaps about transport
need to be filled. One such gap is an analysis of behavioural insights into New Zealanders’
decisions that may be limiting a transition to a low-emissions economy in the transport sector.
The Ministry for the Environment’s Behavioural Insights Group (the Group), motivated by the
opportunity to fill this gap and support EECA’s campaign, has undertaken this extensive
literature review and analysis.
Insights from behavioural sciences –
behavioural insights – can help policy-makers to:
understand why people make
environmentally harmful choices
develop more effective policies to address
environmental problems.
Behavioural insights can be used to make existing
policies more effective, and to devise new ones.
They are another arrow in the policy-maker’s
quiver to prompt more environmentally
sustainable behaviour (OECD, 2017)
Source: Marketing for Change
Analytical structure
Figure 2 shows the analytical structure of this report. First, we outline the key barriers to EV
uptake (eg, driving range, purchase price) identified in the literature, and place them in the
New Zealand context. Second, we identify and infer biases from behavioural insights literature
that reflect the reasons behind the barrier. Finally, we propose interventions to reduce or
overcome the barrier.
Figure 2: Analytical structure of this report
Interventions proposed
Barrier to electric vehicle
Biases behind the barrier from behavioural insight
uptake collated from
are identified and and transport literature
transport literature and
inferred from behavioural to reduce biases and
placed within the New
insights literature potentially overcome
Zealand context
barrier
Reducing barriers to Electric Vehicle uptake: Behavioural insights analysis and review 11After collating relevant interventions, the report makes suggestions and highlights the potential of specific empirical trials and evaluations to further understand the New Zealand context. 12 Reducing barriers to Electric Vehicle uptake: Behavioural insights analysis and review
Chapter 2: Driving range

Barriers
Driving range, or the distance a vehicle can travel on a full tank or full charge, is recognised
overseas as a major barrier to the uptake of EVs. For example, Giffi et al (2010; 2011) found
that limited driving range was a major reason why prospective buyers defer from an EV
purchase in 18 countries.

Driving range is considered a barrier because EVs typically have a smaller range than
equivalent ICE vehicles. This increases fears of reaching a critical range and being left
stranded and needing help (Tannahill et al, 2015). It may also mean that drivers must plan
their trips more carefully, and may not have the option of making last-minute decisions to
take long-distance trips.

One international study found that the shorter driving range is a significant barrier, unless
buyers are offered EVs at a purchase price around US$17,000 (approximately NZ$25,000) less
than their longer-range ICE counterparts (Dimitropoulos et al, 2013). Another study found that
buyers were willing to pay 44 per cent more to extend an EV’s driving range from around
240 kilometres to 320 kilometres (Hidrue et al, 2011). These findings highlight the magnitude
of driving range as a barrier.

New Zealand studies
In New Zealand studies, driving range is also widely considered a major barrier (eg, Lemon &
Miller, 2013; Barton & Schutte, 2015; Metcalfe & Kuschel, 2015; Business NZ Energy Council,
2016). However, they largely extrapolate their findings from overseas findings.

The three New Zealand empirical studies broadly support driving range as a major barrier. For
example, Ipsos (2017) surveyed 1000 New Zealand households and found that only 39 per cent
of respondents considered that EVs could satisfy their day-to-day driving needs. Furthermore,
only 13 per cent of these same respondents considered that EVs could meet their long-
distance driving needs.

While the empirical findings of Zhu (2016) also found driving range to be a major barrier, he
moderated his conclusion, largely because exactly 50 per cent of 122 respondents considered
driving range to be a major barrier. Hence, 50 per cent of respondents did not share this view.
Respondents who considered driving range not to be a concern claimed that they either
already owned an ICE vehicle or knew that they could simply rent one for longer trips. This
reasoning corroborates overseas research where buyers’ intentions for EVs increase with the
number of vehicles the household owns.

Technological developments
A smaller number of respondents in Zhu’s (2016) survey also noted optimism about
technological advances increasing the driving range in the near future. This attitude is well
founded. Since 2013, the estimated driving range for many EVs has increased significantly.
For example, base models of the Nissan Leaf and Tesla Model S grew from a minimum of
120 kilometres and a maximum of 335 kilometres per charge in 2013 to about 172 kilometres

                            Reducing barriers to Electric Vehicle uptake: Behavioural insights analysis and review   13
and up to 400 kilometres in 2017. That increase of about 20-40 per cent is mainly due to larger battery packs. Nissan also claim the new 2018 Leaf has a driving range of, at a minimum, 240 kilometres per charge. More sophisticated range estimation systems may also increase driving range. These systems are giving drivers more accurate information, and therefore greater confidence about how much battery charge remains before they need to recharge (Tannahill et al, 2015). However, prospective buyers are not accounting for these improvements as they are not aware of them. Zhu (2016) found that 81 per cent of respondents concerned about driving range were not aware of the latest technological advances. Ipsos (2017) also found prospective buyers have limited knowledge about the actual driving range of EVs. Respondents in Zhu’s (2016) survey who considered driving range a major barrier, maintained that a vehicle needs to travel at least 350 kilometres before being refuelled or recharged. Research, however, shows that drivers’ preferred range wildly exceeds their actual, practical needs (Franke & Krems, 2013a). Actual driving needs In a US survey Giffi et al (2010) highlighted the disparity between the actual performance of drivers, and what they expected from a vehicle. For example, while 85 per cent of respondents stated that they travelled less than 160 kilometres per day, almost 70 per cent expected a driving range of over 450 kilometres before they would consider buying an EV. Similar gaps between expectations and actual driving needs are found in the UK (Element Energy, 2013). One overseas study found that if drivers were willing to alter their driving behaviour for no more than ten days per year, well over 95 per cent of their driving needs could be met by most EVs (Pearce et al, 2011). In New Zealand, over 90 per cent of daily vehicle travel is 90 kilometres or less – easily within the single-charge range of all available EVs without sipping (ie, opportunistic slow-rate charging when there is a charger available) or a top-up during the day. Further, the average daily commuting distance is around 30 kilometres, and only 22 kilometres for residents in urban centres (Ministry of Transport, 2014). This evidence is corroborated by AA New Zealand (2017), which found that 97 per cent of its 1.6 million members travel over 50 kilometres from home only a few times each year. It appears that EVs meet nearly all travel requirements of New Zealand drivers for a single day of use. There appears to be a gap between perceived and real driving needs in New Zealand, which is consistent with overseas findings (McKinsey & Co., 2017). Some authors claim that buyers are using driving range as a way to avoid considering any change in their purchasing behaviour (Kirsch, 2000). That is, driving range may be a “post-hoc excuse to reject EVs in order to avoid [people] changing their behaviour” (Noel & Sovacool, 2016, p. 382). Overall, available EVs can satisfy most drivers’ daily driving needs, which suggests that these concerns are mostly psychologically driven. They appear to arise largely from misperceptions and misinformation about daily driving practices and the technical capabilities of an EV (Jensen et al, 2013). People who consider driving range a major barrier may misperceive not only how far an EV can travel on a single charge, but how far they typically travel in a single day. 14 Reducing barriers to Electric Vehicle uptake: Behavioural insights analysis and review
Biases
Status quo bias and loss aversion
The fear or anxiety created from the reduced driving range of EVs compared with ICE vehicles
appears to be psychologically driven. One bias that appears strongly linked to driving range
seen as a barrier to EV uptake is the status quo bias. This bias results in people comparing new
products, like EVs, to a reference point (status quo) – in this case, the greater driving range of
an ICE vehicle.

Reflecting a lifetime of driving ICE vehicles, many buyers appear unwilling and uncomfortable
buying an EV, as its range, while likely to meet their typical daily driving needs, is still
significantly less.

This tendency is shaped by a number of complex factors including: regret avoidance, economic
costs of making a change, and an aversion to losing what one presently ‘owns’ (Samuelson,
& Zeckhauser, 1988; Johnson & Goldstein, 2003; De Martino et al, 2009). This is known as
loss aversion.

Psychological studies note that people evaluate equivalent gains and losses very differently.
People are averse to losing because they feel the ‘pain’ of a loss at least two to three times
more than the equivalent ‘pleasure’ of a gain (Kahneman & Tversky, 1992).

Analysis suggests that the anxiety and misperceptions about driving range will remain an issue
for buyers as long as there is a mismatch between the expectation to travel long distances on a
single tank or charge, and the ability of EVs to do so. As the current benchmark for prospective
buyers compares the EV range with that of an ICE vehicle, it may be inevitable that some will
see the shorter EV range as a significant ‘loss’ and, therefore, a major barrier. The perceived
losses are likely to have a far greater psychological impact than the perceived gains (eg, no fuel
costs, exemption from road user charges).

Anchoring effect
A factor related to the status quo bias is the anchoring effect. This reflects the
disproportionate influence, when people are making decisions, of the first piece of
information (the anchor) presented to them (Kahneman & Tversky, 1974; Strack &
Mussweiler, 1997). People can be strongly influenced by first impressions, to the point
that they are unable to adjust these later, despite more accurate, information.

This bias affects everyone, but especially those with a lack of information or knowledge of
a concept or product. Wilson et al (1996) found that knowledgeable people are far less
influenced by anchors. However, experts still show some anchoring effects. For example
vehicle experts, such as mechanics and dealers, with all the necessary information, were
still influenced by the anchors they received when evaluating the value of a vehicle
(Mussweiler et al, 2000).

The anchoring effect helps explain the large number of respondents, surveyed by Zhu (2016)
who continued to use out-of-date information or misinformation about EVs and their driving
range, and who failed to update these with new information including technological advances.

                            Reducing barriers to Electric Vehicle uptake: Behavioural insights analysis and review   15
Choice-supportive bias
The choice-supportive bias is people’s tendency to ascribe and remember positive attributes
about a product they have purchased, and ascribe and remember negative attributes about a
product that they rejected (Mather et al, 2000; 2003; Henkel & Mather, 2007). This accounts
for the position that “I chose this one, therefore it must have been the better option”.
The choice-supportive bias could explain several findings (eg, Noel & Sovacool, 2016) that
driving range may be a post-hoc excuse to reject EVs. Given that many more drivers own ICE
vehicles, the bias would explain why some drivers find negative attributes like driving range
and use them to justify their preference for an ICE vehicle, even when EVs would meet most of
their driving needs.
Driving range may be a “post-hoc
excuse to reject EVs in order to avoid
[people] changing their behaviour”
(Noel & Sovacool, 2016)
Interventions
It has been argued that a range of biases (status quo bias, loss aversion, anchoring effect,
choice supportive bias) explain why prospective buyers cite driving range as a major barrier
(Franke & Krems, 2013b; Pakratz et al, 2017). To ease these anxieties, we must address the
biases that are believed to underpin them.
Think like a trader
Psychological research shows that ‘perspective-taking’, where decisions are placed in a wider
context ‘as if creating a portfolio’ rather than a single decision made in isolation, can reduce
aversion to losses (Thaler et al, 1997; Sokol-Hessner et al, 2009). It appears that ‘thinking like
a trader’ may reduce the subjective impact of losses.
Possible interventions include:
• indicating the perceived gains from EVs outweigh the perceived losses by a factor of two
or three (eg, significant advances in battery technology)
• changing the perceptions and context about the losses from a reduced driving range.
To reduce the driving range barrier, thinking like a trader could mean considering the wider
transport options and types of EVs available. For example, people who own an ICE could be
reminded that they can use this vehicle for longer trips, and use the EV for most daily trips.
16 Reducing barriers to Electric Vehicle uptake: Behavioural insights analysis and reviewReframe reference point
Instead of widening the perspective, another intervention is to change the context of the
reference point. This can be critical because people often treat the status quo as a prima facie
case for ‘correctness’ or ‘goodness’. Various approaches can achieve this, including actively
evaluating the status quo itself and not just comparing with it (Bostrom & Ord, 2006).
Because prospective buyers typically make ICE vehicles their reference point, they will
automatically complete an evaluative assessment for change from the reference point and
therefore EVs, but they inevitably neglect to do an assessment for the status quo itself (ie, ICE
vehicles). Therefore, reframing the reference point could ease concerns about driving range.
One example is to make the reference point, where possible, relate to the actual driving needs
of New Zealanders, to enable a fair assessment of both vehicle types. If the driving needs of
prospective buyers are typical of most New Zealanders, then both vehicle types would be
considered more than sufficient to meet their actual needs.
Dealerships could ask simple prompt questions such as: “How far do you drive on an average
day?” and “How often do you drive out of town?” Alternatively, questions that invoke
descriptive norms could be asked, such as: “Do you know that most New Zealanders only drive
around 30 kilometres per day?” and “Do you know that 90 per cent of New Zealanders make
less than five long distance trips per year?”
Daily driving practice
Daily EV driving practice can help people reassess their actual driving needs. Evidence suggests
that it dramatically reduces concerns about driving range within four to seven days; to the
point where this is no longer a major barrier after three to six weeks of practice (Nilsson, 2011;
Bühler et al, 2014; Ryghaug & Toftaker, 2014). Other studies indicate that driving EVs can
reduce a driver’s preferred range safety buffer after three months (Franke et al, 2012), and
after six months drivers increase travelled distance between charging (Burgess et al, 2013).
Rauh et al (2015) conducted a field experiment with 12 experienced and 12 first-time EV
drivers to study their anxiety levels on a 60-kilometre test drive with a half-charged EV.
Experienced EV drivers had substantially less negative driving range appraisal and a higher
driving range buffer after the test drive than first-time drivers. McKinsey and Co. (2017)
similarly found that EV owners are much more satisfied with the overall range of the EV than
prospective buyers, indicating that driving experience is critical to alleviating these concerns.
The National Research Council (2013) found that buyers often do not want to go to a
dealership to view vehicles. An alternative approach to actively promote EVs and encourage
daily EV driving practice is through ‘ride-and-drives’ at highly visible locations (see figure 3).
These events can also help raise awareness of the latest EV technological advances such as
improved battery capacity and drive range estimation systems. The raising of awareness from
‘ride-and-drive’ events may be grounded in behavioural insights literature, and in particular, by
the ‘mere-repeated-exposure paradigm’ (Zajonc, 2011). This paradigm promotes that as a
person is repeatedly exposed to a specific object (ie, EVs through ride-and-drive’ events) they
develop an emerging preference for that object.
Evidence also shows that practical experience with EVs is likely to be more influential than
information alone (Li et al, 2017). Therefore, finding ways to actively promote daily driving
appears to be an effective way to reduce misperceptions and concerns about driving range.
Reducing barriers to Electric Vehicle uptake: Behavioural insights analysis and review 17Figure 3: Ride-and-drive events offer EV driving practice (Source: EECA) Partnerships between dealerships and rental companies can promote these driving experiences. For example, rental company Blue Cars currently offers a special deal for a four- or seven-day rental of a Nissan Leaf, and a lesson on EV driving and charging. If the buyer decides to buy a Nissan Leaf after the rental, Blue Cars will negotiate a $500 discount off the purchase price. Another interesting partnership is that of Mercury NZ Limited who have partnered with Snap Rentals to launch an EV subscription service offering vehicles from $100 a week as a way of enticing drivers to try out electric transport. The scheme intends to insulate drivers from depreciation shocks and take away the hassle and extra costs of the traditional vehicle ownership model. Play games Electronic games can introduce people to EVs and allows them to drive them in a safe, cheap and risk-free environment. Studies have shown that games can be useful for addressing behavioural barriers and can also reduce anxiety and cognitive ‘self-defences’ (Horne-Meyer et al, 2014). In this way, games could help those with concerns about driving range. In New Zealand, Apperley et al (2015) developed a game-like application to track how drivers would function in an EV environment, including how the level of battery affected behaviour. Although only a pilot study, this work provided important evidence of improving attitudes towards buying EVs. Another example is ‘Electric Car Taxi Simulator 3D’ (Reality Gamified, undated), in which players can overcome the barriers they associate with EV usage, including driving range anxiety. ‘Consider-the-opposite’ Anchoring effects have also been shown to potentially underpin expectations related to driving range. Mussweiler et al (2000) has argued that the ‘consider-the-opposite’ strategy can reduce the anchoring effect, by asking whether there are reasons why a first impression might be incorrect. In the case of EV driving range, dealers could prompt prospective buyers to look for reasons why their initial judgement might be incorrect regarding EV driving range. For example, the dealer could ask the prospective buyer: “Explain why you feel anxious about the driving range of EVs when…?” This strategy may also be useful in addressing the choice-supportive bias that also appears to underpin driving range concerns. 18 Reducing barriers to Electric Vehicle uptake: Behavioural insights analysis and review
Make it attractive by highlighting health benefit
The shorter driving range of EVs can be reframed as an opportunity to reduce driver fatigue
and road accidents by encouraging more frequent rests when recharging.

In 2015, fatigue was a contributing factor in 43 fatal crashes, 119 serious injury crashes and
450 minor injury crashes. These resulted in 36 deaths, 160 serious injuries and 574 minor
injuries. The total social cost of crashes involving driver fatigue was about $291 million. This
is about 7 per cent of the social cost of all injury crashes (Ministry of Transport, 2017).

The New Zealand Transport Agency highlights the importance of regular breaks. Incorporating
breaks into long distance journeys provides opportunities for top-up charging to extend the
driving range of an EV. For example, with rapid DC chargers a break of 20 minutes could charge
a Nissan Leaf from zero to 80 per cent.

         DRIVING RANGE: SUGGESTIONS FOR IMPROVING EV UPTAKE

         For dealerships
         •    Inform buyers of the latest advances, including improved battery technology and greater
              driving range.
         •    Remind buyers to look at all their transport options. Emphasise that buyers can use an EV
              as the main vehicle for daily driving. If driving range is an issue, consider purchasing a
              hybrid-EV or, renting a car for occasional long distance travel:
              •    Purchasing an EV over an equivalent ICE vehicle equates to roughly 18 to 36 car
                   rental days a year through reduced fuel costs 6
         •    Reframe the driving range issue to address the actual distances required.
         •    Use prompting questions to help buyers assess their actual driving habits. This will help
              most buyers realise EVs can meet their daily driving needs.
         •    Provide opportunities for experiencing and driving EVs (eg, ride-and-drive, dealership
              partnerships with rental companies).
         •    Provide opportunities to test EVs through gaming technology as a low-risk strategy.
         •    Reframe smaller driving range as a benefit: reducing fatigue and accidents by taking a
              break when charging.

         For Government
         •    Continue funding ride and drive experiences:
         •    EECA, through the Better New Zealand Trust, has supported more than 1200 EV test drive
              or ride experiences at community events around New Zealand in the last year
         •    The Low Emission Vehicle Contestable Fund (LEVCF) has also co-funded projects which
              provide more opportunities for the public to experience an EV. For example, co-funding
              has been provided to car share and rental car companies to procure EVs, as well as a
              project providing electric courtesy vehicles at mechanics for customers to use while their
              car is being serviced or repaired (Evincible project). Full list of recipients can be found on
              EECA’s website.

6
    18 car rental days assumed for peak periods at $100 a day and 36 days assumed at an off-peak rate of $50

                                  Reducing barriers to Electric Vehicle uptake: Behavioural insights analysis and review   19
Chapter 3: Charging infrastructure Barriers Charging time and limited charging infrastructure or stations are two barriers discussed in the international literature (eg, Giffi et al, 2010). Pierre et al (2011) stated that these issues cannot be ignored, and must be addressed to improve EV uptake. Charging time is closely related to the issue of driving range. With a slow charger, EVs can take up to eight hours to recharge fully. International research indicates that some prospective buyers have a negative perception of how long EVs take to recharge compared to refuelling (eg, Graham-Rowe et al, 2012). Kodjak (2012) inferred that the expectations for charging time of some prospective buyers are only five minutes. This is roughly the time it takes to refuel an ICE vehicle. Drivers are used to refuelling quickly, and only doing so once or twice a week. Also, longer charging time limits the ability to ‘top up and go’ quickly, or make unexpected trips (Element Energy, 2013; Hosseinpour et al, 2015). Importantly, since most New Zealanders do not drive even close to 100 kilometres per day, an overnight home charge every day is completely adequate. Figure 4 highlights the available public charging stations across the country. As of August 2018 there were 152 rapid and 46 slow charger stations across New Zealand. See also appendix 1 for details about charging basics. Figure 4: Public charging stations (NZTA) 20 Reducing barriers to Electric Vehicle uptake: Behavioural insights analysis and review
New Zealand studies
A number of New Zealand studies (Lemon & Miller, 2013; Metcalfe & Kuschel, 2015; Ford et al,
2015; Ipsos, 2018) conclude charging time is a major barrier to the uptake of EVs in
New Zealand. However, Zhu (2016) in his New Zealand survey found 64 per cent of
respondents indicated that charging time was not a barrier because they knew that EVs can be
charged overnight at home. However, international studies have found that some people were
unaware of the ability to charge at home (Hidrue et al, 2011; WWF, 2014).

Barton and Schutte (2015) highlight that 85 per cent of New Zealand households have access
to garages or off-street parking. This makes it relatively easy to undertake overnight charging.
This is a higher rate than in other OECD countries.

It is reasonable to conclude that charging time may not be a major barrier in New Zealand
compared to other countries, especially with greater awareness of the ability of home EV
charging. The option of home charging may be beneficial for EV uptake. Buhler et al (2014)
note that if there is enough opportunity for home charging, current EVs can meet daily driving
demands from home charging alone.

In a UK trial, 40 drivers were interviewed after they had driven an EV for one week. They
reported that home charging was advantageous compared to refuelling ICE vehicles
(Graham-Rowe et al, 2012). Bunce et al (2014) also found in a three-month UK trial that EV
drivers found home charging not only easy and convenient, but gave them independence and
saved time. Studies in other locations corroborate this evidence. For example, in a six-month
trial of 80 MINI E drivers in Berlin, 71 per cent preferred recharging to refuelling an ICE vehicle,
and 87 per cent agreed that charging was easy (Franke & Krems, 2013b).

In New Zealand, a survey of over 270 EV owners found that 92 per cent of the Flip the Fleet
members find home charging either ‘much more convenient’ or at least ‘more convenient’
than having to go to a petrol station to fill up (figure 5).

Figure 5:      “Compared to filling up at a petrol station, charging my EV at home is…”

Source: Flip the Fleet, 2017

                               Reducing barriers to Electric Vehicle uptake: Behavioural insights analysis and review   21
Charging time, however, may become an increasingly important barrier over the lifetime of an
EV, because capacity loss is likely to shorten driving range and increase the frequency of
recharging the battery. To maintain the battery capacity over the lifetime of an EV, charging
habits are likely to be important.
A recent analysis found that battery life is a major barrier to EV uptake in New Zealand (Ipsos,
2018). Despite battery life being a potential major barrier, EV manufacturers provide
significant battery warranties of five to ten years or more, which is likely to limit concerns
regarding battery life.
However, the issue of battery capacity loss could also be more severe in New Zealand
compared to other countries because most EVs purchased in New Zealand are second hand.
Manufacturers may only guarantee EVs and their batteries that are sold as new (EV Talk, 2017;
Myall et al, 2017).
A New Zealand survey of EV owners found that the degradation of battery capacity over time
is an issue (Moller, 2017), depending on whether the reduced range still meets the owners’
driving needs. Hence, fading battery capacity could largely be resolved through reframing
driving range to actual driving needs, unless battery capacity degrades so severely as to
constrain actual driving requirements.
Technological developments
Technological advances in fast charging (using DC rapid chargers) have reduced charging times
significantly. For example, Tesla’s ‘supercharger’ can add an 80 kilometre driving range within
six minutes of charging, and achieves 80 per cent of its full charge within 45 minutes. However,
fast chargers are typically not available at home and there are concerns about the availability
of charging stations when far from home.
The perceived limited number of charging stations can be a significant barrier if not addressed
(eg, Lemon & Miller, 2013; Metcalfe & Kuschel, 2015; Ipsos, 2017; Moller et al, 2018). Moller
et al (2018) found in a choice experiment survey of 108 New Zealand EV owners that the
availability and high visibility of fast charging stations were of critical importance.
In another New Zealand study, Zhu (2016) found that 64 per cent of respondents considered
it a major barrier. Limited awareness of existing stations among prospective buyers
exacerbates this barrier. For example, Zhu (2016) found that many respondents changed
their position once they were made aware of maps showing locations of fast charging
stations. 7 However, despite the evidence of maps, 45 per cent of respondents held to their
original position (Zhu, 2016). They reiterated that the coverage was insufficient, as presumably
they compare it with the wide availability of petrol stations. This comparison was also made in
Ipsos’ (2017) research, with one respondent stating, “I mean I want them to be as
commonplace as petrol stations”.
7
See https://driveelectric.org.nz/chargers-map/
22 Reducing barriers to Electric Vehicle uptake: Behavioural insights analysis and review“I mean I want them [charging stations] to be as
commonplace as petrol stations.”
Although there are some charging stations in New Zealand, until prospective buyers actually
see them as regularly as petrol stations, they may perceive themselves as early adopters and
believe they are taking an undue risk. A wider availability and visibility of charging stations may
be a signal that EVs are a viable economic proposition and a more commonplace choice among
their peers. Furthermore, the perceived limited availability of charging stations is likely to
further exacerbate anxieties around driving range for prospective buyers (Moller et al, 2018).
International trials have found that after EV driving experiences, prospective buyers’ concerns
related to charging stations lessened, as did their concerns about range (eg, Turrentine et al,
2011; Vilimek et al, 2012; Franke & Krems, 2013b; Bunce et al, 2014). This is also observed in
the McKinsey and Co. (2017) study, which found that EV owners were 39 per cent less
concerned about charging infrastructure than prospective buyers.
Home charging
This difference in perception between prospective buyers and EV owners can largely be
attributed to home charging and EV owners changing their refuelling/recharging habits.
EV drivers do not demand charging stations in the public domain, as they mostly charge
their vehicles at home (see Skippon & Garwood, 2011; Plotz et al, 2014). For example, in a six
month MINI E trial in Belgium, 83.7 per cent of charging took place at home and only 4.8 per
cent at public facilities (Franke & Krems, 2013b).
Evidence strongly indicates there is limited actual need for a wide public charging
infrastructure network. This conclusion supports Element Energy’s (2013) position that
widespread availability of publicly accessible charging stations is not a prerequisite for the
emergence and uptake of EVs.
Home charging tools add complexity to purchasing decisions. Buying an ICE vehicle does not
require the consideration of refuelling options, whereas EV buyers must learn about, and
weigh options for, home and public charging options (National Research Council, 2013).
Li et al (2017) recommend putting more effort into educating people about domestic charging
tools. The National Research Council (2015) found that public charging and the variety in
types of public charging units adds a burden to prospective buyers. It notes that streamlining
charging options and decision making, to the point that it is perceived to be as easy as filling up
at a petrol station, will reduce barriers to EV uptake.
This section illustrates that building a lot more charging stations is not a prerequisite for the
emergence of EVs. There is a mismatch between perceived and actual need for public stations.
Reducing barriers to Electric Vehicle uptake: Behavioural insights analysis and review 23As with the issue of driving range, this barrier could be viewed as psychologically-driven (Carroll, 2010; Turrentine et al, 2011; Bunce et al, 2014). Although more charging stations may help promote EVs, there may be less expensive options, such as raising awareness of the existing charging network and the ability to charge EVs at home. Biases It can be argued that charging time is not a major barrier in New Zealand if buyers know they can charge EVs at home. Although the availability of public charging stations and points is a major barrier, it is largely one of perception. Prospective EV buyers typically assume there should be as many charging stations as petrol stations. Status quo bias Biases about charging time are similar to those related to driving range. For example, some buyers expect the charging time to be five minutes – the same as for refuelling. On this issue buyers continue to use ICE vehicles as their reference point (Harris et al, 2016). The status quo bias is also evident in perceptions about the limited number of charging units. The assumption that these should be ‘as commonplace as petrol stations’ shows that the reference point is based in accordance with ICE vehicles rather than the actual requirements for driving an EV. Selective attention bias The selective attention bias refers to the fact that people do not devote equal cognitive (mental) processing to all objects in the environment at any given moment, and often are oblivious to perceptual cues for objects they are not familiar with (Marois & Ivanoff, 2005). Memory formation requires the perception of external stimuli, and internal reflection on them. This is inherently ‘selective’ and dependent on mechanisms of ‘attention’ that modulate, sustain and manipulate information that is most relevant for current or future use (Chun et al, 2011). Perceptual cues for petrol stations and ICE vehicles are nearly universally understood in New Zealand, whereas those for charging stations and EVs are not. People are less likely to see and recall EV charging stations and signage during daily activities, or after seeing them on a map. These instances would fall into the category of things that are ‘seen’ in the immediate sense, but not actively processed, and therefore not remembered (Craik & Lockhart, 1972). The selective attention bias is linked to heuristics – mental strategies or shortcuts to solve problems and make judgements quickly and efficiently (Dale, 2015). Heuristics can speed up our problem-solving and decision-making, but they can introduce errors and biases. For example, the availability heuristic refers to people’s tendency to determine the likelihood of an event according to how easy it is to recall similar examples. People also tend to give more weight to information or perceptual cues they are familiar with (eg, petrol stations) rather than processing all relevant information or perceptual cues they are unfamiliar with (EV charging stations and signage) (Tversky & Kahneman; 1973; Kliger & Kudryavtsev, 2010). 24 Reducing barriers to Electric Vehicle uptake: Behavioural insights analysis and review
The significance of selective attention is
reflected in a recent study (Hyman et al, 2014), in
which dollar bills were noticeably clipped to low-
hanging tree branches so that pedestrians had to
move to avoid them.
Less than 20 per cent of people walking alone and
not using mobile devices noticed the bills, and only
6 per cent of those using mobile devices noticed
them (Hyman et al, 2014).
The results highlight that even with familiar objects
of inherent value and interest, selective attention
is divided: people are oblivious to something that
might be otherwise ‘obvious’ to an observer,
given the context.
Source: Hyman et al, 2014.
People are distracted by sights and sounds, which is certainly the case anywhere they would
physically encounter charging stations or advertising. Cognitive effort is divided among a
variety of tasks. Object recognition focuses on things of immediate relevance such as
obstacles, barriers and threats. The ‘deeper’ perceptual processing that guides behaviour
and helps form memories is frequently focused on specific tasks at hand or engaged in ‘mind-
wandering’ (Hyman et al, 2014).
We cannot expect that people will take notice of, or remember, charging stations or signs they
may come across, except in specific circumstances. These could include instances where: they
were actively seeking out a charging station (Baddeley & Hitch, 1974); they had very recently
been primed to direct their attention to charging stations (Schupp et al, 2016); or they
physically encountered with a station or something signifying it (Treisman & Gelade, 1980).
Cognitive load theory and bounded rationality
Cognitive load is an idea based on a number of widely accepted theories about how our brains
process and store information (Gerjets et al, 2009). These theories include that:
• memory can be divided into working memory and long-term memory
• information is stored in the long-term memory in the form of cognitive frameworks or
concepts that help organise and interpret information (schemas)
• processing new information results in ‘cognitive load’ on working memory, which can
affect learning outcomes (Atkinson & Shiffrin 1968; Anderson, 2003; Baddeley, 1983).
Figure 6 illustrates the aspects of memory relevant to cognitive load theory.
Reducing barriers to Electric Vehicle uptake: Behavioural insights analysis and review 25Figure 6: Memory – a proposed system and its control processes Source: Adapted from Atkinson & Shiffrin, 1968 Cognitive load theory is premised on the fact that people have limited mental processing ability. Too much information or increased complexity of information (ie, heavy cognitive load), can lead to risk-averse behaviour, and poor decision-making, for instance about purchases (Deck & Jahedi, 2015). Electric vehicle charging adds complexity to buying decisions, as it requires buyers to consider not only the vehicle, but also the installation, the use of a charging unit for home charging, and the use of public charging stations. Supporting this, Ipsos (2017) found that buyers have many questions about charging infrastructure. Tversky and Shafir (1992) showed that simply adding further options to a decision (eg, choice of charging unit as well as the vehicle itself) increases the likelihood of delay or of avoidance entirely. They also showed that when the decision was cognitively burdensome, people were biased towards the default option (eg, ICE vehicles). When people are overloaded with information, they tend to settle for ‘good enough’ or ‘satisficing’ solutions rather than optimal solutions (Kahneman, 2003). This is described as being ‘boundedly rational’ (Simon, 1955): the idea that people tend to avoid cognitively burdensome decisions and opt for a course that requires less cognitive effort, even if it is not in their long-term best interests (Kool et al, 2010). This tendency is reflected in everyday buyer decision-making. Some studies show that buyers deciding between many possible goods are less satisfied with their purchase, more frustrated about the decision context, and less likely to purchase the goods compared to settings with fewer options (Scheibehenne et al, 2010). Interventions Reframe reference point The status quo bias is likely an underlying bias behind the barriers of charging time and the perceived scarcity of charging stations. One way to counter this is to encourage an evaluation of the status quo, reframing the reference points of refuelling times and the availability of petrol stations. Reference points can include: • Number of potential EV charging stations (public and private) vs number of gas stations • Reduced number of visits to refuel for users that have access to charging facility at home. 26 Reducing barriers to Electric Vehicle uptake: Behavioural insights analysis and review
You can also read