Reducing pollution and health impacts through fiscal policies - A selection of good practices - Working Paper
←
→
Page content transcription
If your browser does not render page correctly, please read the page content below
Reducing pollution and health impacts through fiscal policies –
                 A selection of good practices

 Working Paper

 December 2019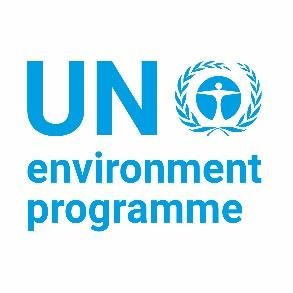
Cover page photo credit: Dominik Dancs as published on Unsplash
________________________________________
Copyright © United Nations Environment Programme, 2019

This publication may be reproduced in whole or in part and in any form for educational or non-profit purposes without
special permission from the copyright holder, provided acknowledgement of the source is made. The United Nations
Environment Programme would appreciate receiving a copy of any publication that uses this publication as a source.

No use of this publication may be made for resale or for any other commercial purpose whatsoever without prior
permission in writing from the United Nations Environment Programme.

Disclaimer
The designations employed and the presentation of the material in this publication do not imply the expression of any
opinion whatsoever on the part of the United Nations Environment Programme concerning the legal status of any country,
territory, city or area or of its authorities, or concerning delimitation of its frontiers or boundaries. Moreover, the views
expressed do not necessarily represent the decision or the stated policy of the United Nations Environment Programme,
nor does citing of trade names or commercial processes constitute endorsement.

                                                              2
Acknowledgments
This study was undertaken in the context of a United Nations Environment Programme (UNEP)
project on Environment, Health and Pollution as well as a project on Enhancing Knowledge and
Capacity for Inclusive Green Economies. This study was prepared by Sirini Withana, Karin Valverde
Pedrique, Steve Macey and Teodora Cakarmis in the Economy Division of UNEP. The study was led
and carried out by Joy Kim, Senior Economic Affairs Officer at the Economy Division of UNEP, under
the overall supervision of Steven Stone, Chief of the Resources and Markets Branch of the Economy
Division of UNEP. Administrative support was provided by Rahila Somra, Fatma Pandey and Desiree
Leon.

The authors gratefully acknowledge the contribution of peer reviewers including Rodrigo Pizarro,
Professor at University of Santiago, Chile and Daniel Slunge, Professor at the University of
Gothenburg. Within UNEP, Maria Cristina Zucca provided valuable inputs to support the
development of the study. The layout and design of the study and the bibliography was prepared by
Teodora Cakarmis.

The study was undertaken in the context of a UNEP-led project on Environment, Health and
Pollution which seeks to provide the needed understanding, capacities and tools to help countries
and stakeholders take effective action to address pollution. As part of this project, a series of studies
have been carried out which explore the effective use of fiscal policies for pollution reduction. These
fiscal studies contribute to the Implementation Plan ‘Towards a pollution-free planet’ adopted at the
Third UN Environment Assembly (UNEA-3) which identifies stimulating good practices through fiscal
policy as an accelerator for implementation.

                                                   3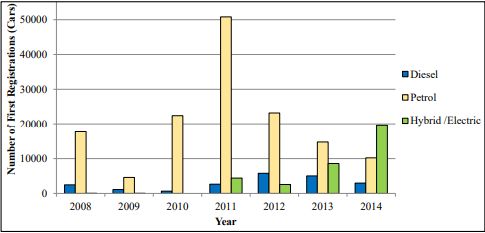
Table of contents
Acknowledgments................................................................................................................................... 3

List of abbreviations ................................................................................................................................ 5

Executive Summary................................................................................................................................. 6

1.      Introduction .................................................................................................................................... 9

     1.1       Pollution and the Sustainable Development Goals ................................................................ 9
     1.2       The environmental, health and economic costs of pollution ............................................... 11
     1.3       Study objective...................................................................................................................... 15
2.      Fiscal policy as a response to pollution......................................................................................... 16

     2.1 Taxes and charges on pollution .................................................................................................. 18
     2.2       Subsidising alternatives to pollutants ................................................................................... 27
     2.3       Reforming harmful subsidies and perverse incentives for pollution .................................... 33
3.      Insights on good practices in using fiscal policies to address pollution........................................ 37

     3.1 Design considerations ................................................................................................................. 37
     3.2       Political economy considerations of pollution taxes and subsidies ..................................... 40
     3.3       Conclusions ........................................................................................................................... 42
4.      References .................................................................................................................................... 45

List of boxes
Box 1: Pollution, Environment and Health in the SDGs ........................................................................ 10
Box 2: Improving air quality and health in Thailand ............................................................................. 18
Box 3: Taxing local and global pollution in Chile................................................................................... 20
Box 4: Danish tax on pesticides............................................................................................................. 21
Box 5: Congestion charging in Stockholm and London ......................................................................... 22
Box 6: Environmental Protection Taxes in China........................................................................... ......24
Box 7: NOX charge in Sweden...............................................................................................................25
Box 8: India Clean Energy Cess.............................................................................................................26
Box 9: Plastic bag charge in Ireland......................................................................................................27
Box 10: Fiscal incentives for clean vehicles in Sri Lanka and Mauritius................................................30
Box 11: Subsidising more environmentally friendly transport ............................................................. 30
Box 12: Subsidising environmentally-friendly production zones in China............................................ 32
Box 13: Waste management in South Korea ........................................................................................ 33
Box 14: Agriculture subsidy reform in Switzerland............................................................................... 34
Box 15: Fossil fuel subsidy reform supporting social welfare and healthcare in Indonesia ................. 36

                                                                            4
List of abbreviations
BPA Bisphenol A
BRICS Brazil, Russia, India, China, South Africa
CO2 Carbon dioxide
CPZ Congestion pricing zone
CTIP Circular Transformation of Industrial Parks
DALYs Disability-adjusted life-years
DDT Dichlorodiphenyltrichloroethane
DEHP Diethylhexyl phthalate
EIP Eco-Industrial Parks
EU European Union
EV Electric vehicle
GDP Gross Domestic Product
GHG Greenhouse gas
IEA International Energy Agency
IMF International Monetary Fund
IPCC International Panel on Climate Change
LPG Liquefied petroleum gas
MoF Ministry of Finance
MRTS Medium-term revenue strategy
NCEEF National Clean Energy and Environment Fund
NCEF National Clean Energy Fund
NDRC National Development and Reform Commission
NOx Nitrogen Oxides
OECD The Organisation for Economic Co-operation and Development
PM Particulate Matter
RFID Radio Frequency Identification
SDG Sustainable Development Goals
SO2 Sulphur dioxide
TCO2 Total Carbon dioxide
UNEA United Nations Environment Assembly
UNEP United Nations Environment Programme
UNIDO United Nations Industrial Development Organisation
UPD Unified Poverty Database
United Nations Collaborative Programme on Reducing Emissions from
UN-REDD+
Deforestation and Forest Degradation in Developing Countries
VAT Value-added tax
WHO World Health Organisation
5Executive Summary
There is a growing body of evidence linking environment, pollution and health problems. The World
Health Organization (WHO) estimates that 12.6 million deaths each year are attributable to an
unhealthy environment, of which 8.2 million deaths are due to noncommunicable diseases, mostly
ascribable to air pollution (WHO 2016a). Air pollution-related premature death, illness and health
expenditures negatively affect a country’s GDP and overall development with a disproportionate
effect on the poor and vulnerable. Air pollution is especially severe in some of the world’s fastest-
growing urban regions, where economic activity contributes to higher levels of pollution and greater
exposure. Burgeoning economic growth and a growing population is expected to lead to further
pollution and subsequent environmental and health problems and related socio-economic costs.
Preventing and addressing pollution and associated health impacts is a key sustainable development
priority and is strongly related to achieving the 2030 Agenda for Sustainable Development. Several
Sustainable Development Goals (SDGs) are concerned with these issues including SDG 3.9 which
strives to substantially reduce the number of deaths and illnesses from hazardous chemicals, air,
water and soil pollution and SDG 12.4 which seeks to achieve environmentally sound management
of chemicals and wastes throughout their lifecycle.
A comprehensive mix of policies and measures will be needed to address and reduce pollution. Fiscal
policies including taxes and subsidies can play an important role in reducing different forms of
pollution and can help accelerate efforts towards a pollution-free planet (UNEP 2018). Taxes and
charges on polluting activities and substances as well as targeted subsidies can create incentives to
discourage polluting activities or the use of polluting products and encourage the uptake of less
polluting alternatives in a cost-effective way. At the same time, reforming perverse fiscal incentives
that drive the use of certain pollutants, such as chemical fertilizers and pesticides, can trigger a shift
in behaviour and help reduce pollution.
There are several examples of such fiscal policies targeting different pollutants across countries. This
study explores experiences in both developed and developing countries with different types of fiscal
instruments to reduce various forms of pollution. Each type of instrument has both strengths and
weaknesses, and their impact/effectiveness depends on various factors including the elasticity of
demand, substitution effect, availability of alternatives and political economy considerations. The
experiences explored in this study provide practical insights and good practices on the effective use
of such instruments to address pollution.
Since fiscal policies put a clear government-set price on pollution that is visible to economic actors,
particularly producers of pollution, they create an economic incentive to reduce pollution, making
them one of the most efficient and cost-effective approaches to preventing and reducing pollution.
When carefully designed, fiscal policy instruments can stimulate behavioural change and accelerate
action to reduce pollution and associated health impacts, as seen with the introduction of
congestion charges for vehicles entering certain zones in European cities. For example, in Stockholm,
Sweden, the introduction of a congestion tax reduced ambient air pollution in the city by 5-15
percent, which has resulted in a significant decrease in acute asthma attacks among young children
and a reduction in premature deaths in the metropolitan area. As the reductions were concentrated
to the most densely populated areas, the policy effects were approximately three times larger than
what could be achieved from a more general policy measure to reduce emissions. In comparison, the
costs of regulation can vary and can be hard to estimate in advance, leading to additional costs on
producers but in a less transparent way.
6Fiscal policies are often part of a toolbox of complementary policies, which working together can
effectively stimulate the systemic and behavioural changes needed to prevent and reduce pollution
and associated health impacts. For example, in Thailand, in response to concerns about the health
and environmental impacts of lead pollution, the Government adopted a package of measures
including fiscal incentives, regulatory policies, information tools, strengthened traffic management
measures, vehicle maintenance and inspections which led to the eventual phase out of leaded
petrol, an improvement in air quality and a decline in levels of lead in blood among the public.
Another benefit of using fiscal instruments to reduce pollution is their revenue raising potential
which can be significant. According to IMF estimates, removing fossil fuel subsidies and adopting
efficient fossil fuel pricing would increase government revenue by US$2.8 trillion while reducing
global carbon emissions by 28 percent and fossil fuel air pollution deaths by 46 per cent (Coady,
Parry, Le, Shang 2019). These revenues can be used in different ways. For example, earmarking
revenues to support environmental activities could help build support among a sceptical public and
boost the green credentials of the tax,/charge as in London where revenues from the congestion
charge is earmarked to support improvements in public transit, road safety and initiatives to support
biking. Other options include allocating revenues to the general budget, using revenues to offset
cuts in other taxes, or returning revenues to the affected sector (as in Sweden and Denmark). How
resources are used and how this is communicated to the public can determine the political and
public acceptability of a fiscal policy measure.
Country experiences with using fiscal policies to address pollution provide insights on key design
principles. This includes the need to ensure the pollution tax base1 is clearly set and correctly
targeted to increase the cost of the polluting input or activity, while considering administration
costs. Tax rate2 ‘escalators’ should be preannounced, to enable a high pollution tax to be gradually
established whilst allowing stakeholders time to progressively adjust their activities, thus minimising
economic impacts and reducing potential opposition. There are several interesting country examples
of innovative design of pollution taxes. For example, in Chile, the air pollution tax rate varies
according to local air quality factors, the social costs of each pollutant and population density in the
municipality in which the facility is located. The tax has had an important signalling effect in the
economy: stimulating efficiency and technological innovation and encouraging a shift in business
behaviour.
When designing pollution taxes and charges, it is important to both understand the socio-economic
profile of consumers of the targeted pollutant or related products and the impacts of the policy on
specific industries and particular social groups. Where necessary, targeted mitigation mechanisms
and/or complementary policies should be considered to compensate affected groups, possibly
through the recycling of revenues raised by the tax. Mitigation measures should be carefully
designed, targeted and time-limited, reflecting negative impacts (e.g. increasing complexity of the
tax system) and unintended consequences (e.g. creating perverse incentives)
Some countries use direct subsidies or tax expenditures (i.e. targeted tax cuts) to incentivize the use
of less harmful alternatives. Although subsidies entail fiscal costs to the government, they can be
helpful in cases where pollution taxes are politically difficult to introduce. Properly estimating the
budgetary costs of such subsidies is important, especially for tax expenditures given that they entail
foregone revenue. Such subsidies should be carefully monitored, and their effectiveness regularly
reviewed to ensure they are fit for purpose. They should also be time limited and phased out once
1. Tax Base: The thing or amount on which the tax rate is applied, e.g. corporate income, personal income, real property (OECD, Glossary
of Tax Terms, 2019).
2. Tax rate: the percentage at which an individual or corporation is taxed (Investopedia, 2019). Escalator: set rate of gradual tax increase.
7alternatives are established, to avoid distorting the market. For example, in Norway, generous
incentives for electric vehicles—including various fiscal exemptions—resulted in sales of electric and
plug-in electric cars surpassing those of conventional cars and led the government to subsequently
revise support measures downward.
Traditionally, subsidies have been used to incentivise activities that generate pollution. This is still
the case today, with many countries subsidising the use of certain fuels and harmful chemical
pollutants such as subsidies for chemical fertilizers and for the production and use of fossil fuels. By
artificially lowering prices such subsidies drive wasteful energy consumption and stimulate further
fossil fuel extraction/production, which increases local air pollution and crowds out investment in
renewables and energy efficiency. Estimates suggest that, in 2014, G20 governments spent US$444
billion subsidising fossil fuel companies; meanwhile, the use of fossil fuels resulted in estimated
health costs of at least US$2.76 trillion, highlighting the inherent contradictions in this policy choice
(HEAL 2017). Removing such harmful subsidies would be a major step towards ensuring fiscal policy
supports pollution reduction while freeing up substantial public resources, which could be used to
benefit public health. For example, in Indonesia, savings from fossil fuel subsidy reforms have
supported investments in infrastructure (including improved drinking water) and social welfare
programmes (including improved health care).
Pollution is one of the major challenges of our time, affecting human health and the environment.
Pollution also has economic costs linked to effects on labour productivity, health expenditure, crop
yield losses and ecosystem damage, among others. These issues are central to the 2030 Agenda for
Sustainable Development and are reflected in several SDGs. There is no one-size-fits-all type of
solution as prevalent pollutants and sources vary both between and within countries. A toolkit of
complementary policies is needed to address this complex challenge. Fiscal instruments are among
the most cost-effective and efficient tools available to reduce pollution. When carefully designed,
fiscal instruments can play an important role in the policy toolbox needed to prevent and reduce
pollution helping to accelerate progress towards a pollution free planet and support the 2030
Agenda for Sustainable Development.
81. Introduction
1.1 Pollution and the Sustainable Development Goals
Pollution refers to the introduction of contaminants into the environment through natural causes or
as a by-product of economic and social activity. A predominant form is air pollution where pollutants
emitted into the atmosphere alter the quality of air. Similarly, pollution can affect water, soil and
other natural environments, and can arise from noise, light or heat sources. While the impacts of
pollution are distinct from those of climate change, there is a strong overlap in terms of causes, for
example, the transport sector is a major source of both pollution and greenhouse gas (GHG)
emissions.
Burgeoning economic growth and a growing population is expected to lead to further pollution and
subsequent environmental and health problems. For example, between 2008 and 2013, air pollution
levels increased by an average of 8 per cent in urban areas around the world (UNEP 2017a). Air
pollution is especially severe in some of the world’s fastest-growing urban regions, where economic
activity contributes to higher levels of pollution and greater exposure. Consequently, the health risk
posed by air pollution is the greatest in developing countries, such as in South Asia, East Asia and the
Pacific. In 2013, about 93 per cent of deaths and nonfatal illnesses attributed to air pollution
worldwide occurred in these countries, where 90 per cent of the population was exposed to
dangerous levels of air pollution (WBG and IHME 2016). It is estimated that more than half of the
world’s population will live in urban areas of Asian countries by 2020 as increased economic
development in the region leads to rapid urbanization. There is a clear connection between soaring
population growth, rapid industrialization, increased vehicle use, and poor urban air quality in major
Asian cities (Haq, Han and Kim 2002). By improving air quality, cities and countries can improve the
wellbeing of their populations, reduce the health costs from air pollution-related diseases and
support sustainable growth. These issues are reflected in several Sustainable Development Goals
(SDGs) including SDG11.6 which aims to reduce the adverse environmental impact of cities by paying
special attention to, among others, air quality, municipal and other waste management (see Box 1).
SDG7—which seeks to ensure access to affordable, reliable, sustainable and modern energy for all--
would also have substantial health benefits since, for example, a shift to clean cooking stoves would
decrease indoor air pollution while a reduction in fossil fuel energy use would abate air pollution and
related ill-health and premature deaths worldwide.
Chemicals pollution is another area of concern, particularly chemicals used in electronics, textiles
and agriculture sectors. The global chemicals industry has grown steadily over the past decades with
the production (excluding pharmaceuticals) estimated to increase by 85 per cent by 2020 , compared
to 1995 production levels(Doble and Kruthiventi 2007). While many manufactured chemicals have
benefits in terms of human health innovations, food security, and productivity, the mismanagement
of certain hazardous chemicals (such as plastic waste and pharmaceutical pollutants) causes
significant adverse impacts on human health and the environment (UNEP 2013). According to OECD
estimates, global chemical sales are expected to grow about 3 per cent per year until 2050, with
growth rates among BRICS countries (Brazil, Russia, India, China, South Africa) more than double
those of OECD countries. In addition, chemical production in the rest of the world is expected to
grow even faster in the 2010-2050 period (BASF 2018). According to the Global Chemicals Outlook,
the consumption of chemicals in developing countries is growing at a rate such that one third of all
chemical consumption may be in developing countries by 2020. Developing countries suffer from
chemical pollution and waste from mining activities, pharmaceuticals, electrical and electronic
equipment. These problems persist partly due to differences in implementation of international
conventions and regulations, along with limited enforcement capacities in some countries (Weiss,
Leuzinger, Zurbrugg and Eggen 2016). Uncertainties abound regarding the environmental and health
9impacts of different chemicals since many chemicals have not been thoroughly evaluated. Limited
monitoring and reporting of such impacts in certain low- and middle-income countries also reduces
the ability to assess actual implications. The growth of the chemical industry and its increasing
importance in developing countries will bring benefits on the one hand and “an increase in chemical
pollution, exposure, and impact on human and environmental health” on the other, especially if this
growth is not accompanied by appropriate policies to manage and mitigate negative impacts (Weiss,
Leuzinger, Zurbrugg and Eggen 2016). These concerns are reflected in several SDGs including SDG3.9
which aims to substantially reduce the number of deaths and illnesses from hazardous chemicals,
air, water and soil pollution and contamination; and SDG 12.4 which seeks to achieve
environmentally sound management of chemicals and wastes throughout their lifecycle.
Box 1: Pollution, Environment and Health in the SDGs
Given the multiple impacts of pollution on environment and health outcomes, reducing pollution is strongly related to
achieving several SDGs and related targets. In 2017, the United Nations Environment Assembly (UNEA-3) requested the
UN Environment Programme (UNEP) and the WHO to act on integrated environmental and health risks in relation to
several SDGs.
Action on pollution
Growing food with careful
substantially reduces the
Cleaner environments pesticide use on non-
number of deaths and
improve worker health and contaminated soils helps to
illnesses from hazardous
productivity and increase fight hunger and ensure the
chemicals and air, water
the number of days worked provision of safe food year-
and soil pollution and
round
contamination
A clean environment
Better managed
enables high-quality Pollution reduction can
freshwater ecosystems
education, and education promote gender equality, for
from cleaner water and
enables acquisition of the example through reduced
fewer chemical pollutants
knowledge and skills burden of fetching clean
significantly reduce the
needed to promote water, cleaner indoor air
number of deaths from
sustainable development quality and better health
diarrheal diseases
and lifestyles
Pollution prevention
through the adoption of
Access to affordable,
Improved worker health and green technologies and
reliable and sustainable
well-being in toxin-free ecosystem-based
modern energy can abate
workspaces lead to increased solutions fosters
indoor air pollution, which
productivity and economic innovation and
particularly benefits
growth sustainability in the
women and children
industry and infra-
structure sectors
Resource efficiency and
Pollution governance and
circularity in material and
actions can ensure that no Sustainable transport, waste
chemical inputs reduce
group or community bears management, buildings and
both pollution and waste
a disproportionate share of industry lead to cleaner air in
and contribute to
the harmful effects of cities
sustainable consumption
pollution
and production
Integrating ecosystem
Action on marine pollution
and biodiversity values
Clean energy and low- reduces bioaccumulation of
into development plans
carbon policies reduce air toxic substances and habitat
and poverty reduction
pollution and mitigate the destruction, which helps
strategies supports better
impact of climate change maintain healthy fisheries and
land management and
ecosystems
prevents pollution
Good pollution-related
governance reduces Global partnerships to
environmental burdens and address pollution can have
injustices and can enhance positive impacts on health,
the availability of “saved” jobs, worker productivity the
resources for the environment and well-being
underserved
Source: UNEP 2018d
10Individuals living in poverty, the elderly, foetuses, infants, children and pregnant women are among
those most vulnerable and susceptible to the toxic effects of chemicals. In general, the source of
exposure to hazardous chemicals differs for men and women: for the former it might be
occupational exposures while for the latter exposure is through cosmetics (UNEP 2019a).
Furthermore, those living in poverty are more likely to be exposed to higher levels of chemical
pollutants partly because of where they live (i.e. they are more likely to dwell on marginal land, near
chemical intensive industries; near sites where waste is burned and close to heavy traffic), the
increasing proportion of chemicals production shifting to developing countries, poor waste
management practices, and little awareness and information on exposures and health risks. Lower-
income people are also more likely to live in substandard housing with aging and deteriorating lead-
based paint, to work in highly hazardous informal-sector jobs and activities including scavenging of
waste dumps (Goldman and Tran 2002). According to the World Bank, developing and least-
developed countries use the bulk of high toxicity pesticides (organochlorines, organophosphates,
and dithiocarbonates) as they are often the cheapest. In addition, 99 per cent of severe pesticide
poisoning incidences occurs in developing countries (Goldman and Tran 2002). Furthermore, poverty
is strongly linked with low nutrition and those who are poorly nourished and have concurrent
disease are more susceptible to the harmful effects of toxic chemicals. For example, deficiency in
specific nutritional factors can increase the risk of toxicity associated with exposure to metals such
as arsenic and lead. Similarly, individuals with impaired respiratory or cardiovascular systems are
more susceptible to life-threatening diseases associated with low-level exposure to particulate
matter in air.
1.2 The environmental, health and economic costs of pollution
The costs of pollution vary depending on the type of pollution and its location (WHO 2018a). Air
pollution is among the deadliest sources of pollution. According to the WHO, the combined effects
of outdoor and indoor air pollution cause around seven million premature deaths every year (WHO
2019). According to a report by the European Heart Journal (Lelieveld, et al. 2019 as cited in
Schlanger 2019), the average person living in Europe loses two years of their life to the health effects
of breathing polluted air. Health impacts of air pollution are largely linked to invisible airborne
particles known as particulate matter (PM). The smallest particles are the deadliest (PM2.5, PM10) –
see Table 1. The three biggest killers related to air pollution are strokes (2.2 million deaths), heart
disease (2.0 million), lung disease and cancer (1.7 million deaths). Air pollution also contributes to
other illnesses such as diabetes, hampers development, for example damaging brain tissue and
undermining cognitive development in young children (Bowe et al. 2018; UNICEF 2017). Moreover,
air pollution can interfere with the normal functioning of the nervous system by, for example,
increasing the risks of dementia and damaging cognitive performance of an aging brain (Devlin 2017;
Zhang and Zhang 2018). An abundance of epidemiological, biological and pathological studies
provide scientific evidence of the negative effect of PM pollution on human health (Brunekreef
and Forsberg, 2005; Kim, Kabir and Kabir 2015; Marcelli, Hampai, Cibin and Maggi 2012; Pieters,
Plusquin, Cox, Kicinski, Vangronsveld, and Nawrot 2012; Calderón-Garcidueñas et al. 2010).
Air pollution also has economic costs linked to effects on labour productivity, health expenditures,
crop yield losses and ecosystem damage among others. In 2013, the global welfare costs associated
with air pollution were estimated at about US$5.11 trillion (WBG 2016a). Air pollution from road
transport, specifically emissions from diesel, are estimated to cause at least EUR70 billion in health
damages every year in the European Union, with most of these costs borne by taxpayers through
government-funded health services (Massay-Kosubek 2018). According to WHO estimates, the
economic cost of premature deaths from air pollution in European countries in both 2005 and 2010
amounted to as much as 29.5 per cent of GDP in Bulgaria and 33.5 per cent in Serbia which bore the
highest costs among the 54 countries examined in the report. Wealthier western European countries
11had lower, but still significant, economic costs amounting to 3.7 per cent of GDP in the UK, 2.3 per
cent of GDP in France and 4.5 per cent of GDP in Germany (WHO 2015). In Barcelona, Spain,
reducing PM10 exposure from 50 mg/m3 to 20 mg/m3 was estimated to lead to 3,500 fewer deaths,
1,800 fewer hospitalizations for cardio-respiratory diseases, 5,100 fewer cases of chronic bronchitis
among adults, 31,100 fewer cases of acute bronchitis among children, and 54,000 fewer asthma
attacks among children and adults, with related savings of EUR 6,400 million per year. In Indonesia,
in 2017, air pollution caused an estimated 56,800 deaths and 95 per cent of the population was
exposed to harmful levels of air pollution above the WHO guideline value (OECD 2018a). In 2015,
peat fires in Indonesia led to economic and health costs estimated at US$16 billion; an estimated
91,000 premature deaths were linked to the extreme haze (WBG 2016b; Koplitz et al. 2016).
The production and use of energy are the primary sources of air pollution with almost half of
ambient air pollution resulting from coal-fired power generation (Watts et al. 2017). Pollution from
coal combustion and vehicle exhaust pipes cause the most significant harm to human health (HEAL
2017). Other major contributors are the residential sector, industry, transport and agriculture
(International Institute for Applied Systems Analysis 2018). Exposure to air pollution is particularly
severe in rapidly developing countries in the Asia Pacific region where the impact of air pollution on
human health constitutes a serious public health crisis in both urban and rural areas. Around 92 per
cent of the region’s population is exposed to levels of air pollution that pose a significant risk to their
health (UNEP 2019b). The total mortality burden from indoor and ambient air pollution in the region
is fourth behind dietary, tobacco and high blood pressure risks (Institute for Health Metrics and
Evaluation 2017). Associated welfare losses are also significant, amounting to as much as 7.5 percent
and 7.4 percent of GDP) equivalent in East Asia and the Pacific and South Asia respectively (WBG
2016a).
Growing recognition of these harmful health and environmental effects are driving efforts to
diversify energy sources and phase out coal fired power generation. For example, India introduced a
cess on domestically produced and imported coal in 2010 to promote clean environment initiatives
and fund research (see Box 8). Between 2010 and 2018, the coal cess raised US$12 billion with a
share of these revenues used to support clean energy and environment projects through the
National Clean Energy Fund (NCEF) (Geramsichuk 2018). As part of its efforts to improve air quality,
China is investing heavily in renewable energy projects accounting for almost half of solar PV
expansion in 2016, for almost 60 per cent of global solar cell production in 2018 and a growing
presence in wind power according to the International Energy Agency (IEA) (IEA, 2017 as cited in
Timperley, 2018). Efforts to reduce air pollutants such as methane and black carbon will also support
country commitments under the Paris Agreement as recognized by the IPCC (Institute for Advanced
Sustainability Studies 2019; IPCC 2018).
Table 1: Air pollution from sources to impacts
Ecosystem services
Human impact Ecological effect
impacted
Breathing disorders
Fine particulate matter Loss of visibility
Cardiovascular disease Changes in productivity
(PM2.5, 10) Impaired photosynthesis
Cancer
Black carbon – a type of Breathing disorders Albedo reduction and
fine particulate from Cardiovascular disease thus further contribution Cooling
energy production and Cancer to climate change Changes in productivity
incomplete combustion Impaired photosynthesis
Nitrogen oxide emissions Altered nutrient cycling
Acidification
from transport & energy Lung irritation Increased system
Eutrophication
production losses
Ammonium emissions Reduced food
Lung irritation Eutrophication
from agriculture provisioning
12Increased net primary
productivity
Premature deaths Acidification
Sulphur dioxide Loss of biodiversity
Damage to buildings
Impaired immune Reduced plant biomass
system and net primary
Reduced plant growth
Breathing disorders productivity
Ground level ozone Increased plant
Cardiovascular effects, Altered climate
susceptibility to stress
Some reproductive and regulation through
development effects carbon sequestration
Heavy metals from Neurological
transport, energy development
Reduction of available
production, industrial Harmful effects on the Toxicity build-up in food
food due to
sources, contaminated nervous, digestive and chains
contamination
sites, extractives, waste immune systems, lungs
burning and kidneys
Potential reduction of
Benzene – used in Range of acute and
High acute toxic effect onplant biomass, long
petroleum products long-term adverse
terrestrial plants and term reduction of
including motor fuels and health effects and
some aquatic life marine population in
other chemical solvents diseases
polluted areas
Source: United Nations Environment Program (2017), Towards a Pollution-Free Planet Background Report
The health impacts of chemical pollutants vary depending on the chemical composition (WHO
2016b). According to WHO (2016c) estimates, 1.3 million lives and 43 million disability-adjusted life
years (DALYs) were lost in 2012 due to exposure to selected chemicals. Due to data limitations, this
may underestimate the magnitude of death and disability caused by exposure to hazardous
chemicals. There are multiple ‘exposure pathways’ that lead to public health risks from chemicals,
including ingestion of contaminated water and food, inhalation of contaminated air or dusts, dermal
exposure, exposure to the foetus during pregnancy and the transfer of toxics through breast milk,
among others. Even low levels of exposure can influence the risk of disease. For example, multiple
toxicological studies demonstrate that exposure to low doses of Bisphenol A (BPA) in-utero can
increase the risk of diseases such as diabetes, prostate cancer and breast cancer later in life
(Seachrist, Bonk, Ho, Prins, Soto, and Keri 2016). The timing of exposure is another important factor
influencing disease risk. In their epidemiologic study, Cohn, Cirillo, and Terry (2019) observed that a
group of girls exposed to Dichlorodiphenyltrichloroethane (DDT) during puberty were five times
more likely than the control group to develop breast cancer when they reached middle age(.
Chemical pollution can also have serious economic consequences (WHO 2016c). For example, the
estimated annual illness costs of acute poisonings in Nepalese farmers due to pesticide use was
nearly one third of total annual health-care costs. In Paraná, Brazil, for each dollar spent on
pesticides, approximately US$1.28 may be spent on health care and sick leave due to occupational
poisoning.
The agriculture industry is a major source of harmful chemical pollutants as “pesticides are among
the leading causes of death by self-poisoning, in particular in low- and middle-income countries”
(WHO 2018b). Exposure of children and pregnant women using or otherwise exposed to pesticides
and other toxic substances at work is one of the major concerns of the UN Special Rapporteur on
Human Rights and Toxics. For example, in a 2018 communication regarding tobacco production in
Zimbabwe, the Rapporteur listed at least 10 foreign companies that sourced tobacco from farms
where children are reportedly using or mixing pesticides (UN Special Rapporteur on Human Rights
and Toxics, 2018).
13The mining sector also has a history of health problems linked to the use of certain chemicals,
especially mercury. The health of individuals exposed to mercury is threatened with often
irreversible toxic effects. Mercury emitted into the air through human activities such as mining and
fossil fuel combustion eventually settles in water or land, thus harming wildlife, ecosystems and
humans. Certain microorganisms can change mercury into methylmercury, which is a very toxic form
that bioaccumulates in fish, shellfish and animals that eat them, including humans (EPA n.d.)1.
Mercury pollution is a problem in the artisanal mining sector, which is often informal and weakly
regulated. For example, in the Nigerian State of Zamfara, over 400 people died following the release
of a mixture of lead and mercury into the environment from artisanal gold mining activities (Human
Rights Watch 2011). Such informal, artisanal and small-scale gold mining activities account for 38
per cent of anthropogenic mercury emissions, followed by 21 per cent arising from coal combustion
(UNEP 2018a).
Moreover, mining activities can lead to soil pollution. A study by Li, Ma, Kuijp, Yuan, and Huang
(2014) examines 72 mining sites in 22 different provinces and finds that indicators for heavy metal
soil pollution are particularly high in tungsten, manganese, and lead–zinc mining areas. Such
pollution poses high carcinogenic and non-carcinogenic risks to the public, for both of which dermal
absorption and ingestion are the most common exposure pathways. The risk of exposure is
especially high for children and those living in the most severely polluted regions. Heavy metals can
also end up in the soil through the use of “sewage irrigation” in agriculture (Lu et al. 2015). Ingestion
of food grown on polluted soil can increase morbidity and mortality from cancers, especially
digestive cancers through ingestion of contaminated food.
Marine and coastal pollution has attracted increasing attention in recent years with high profile
campaigns around the issue of marine litter, particularly from plastic pollution. Inadequate waste
management systems have led to an estimated 4.8-12.7 million tons of plastic waste entering the
ocean every year and almost 500 "dead zones" with too little oxygen to support marine organisms.
As plastics spread through the ocean, they break into smaller parts and release toxins and chemicals,
which can be ingested by animals that are then consumed by humans (Barry 2009). Ingestion of
these pollutants can lead to negative health impacts in humans through either direct toxicity of
chemicals (cadmium and mercury) or indirect effects of, for example, carcinogen chemicals
(Diethylhexyl phthalate: DEHP) (Andrews 2012). Several reports have focused on the environmental,
social and economic impacts of marine litter (UNEP 2018b). Marine ecosystems globally suffer an
estimated US$ 13 billion a year in damages caused by plastic waste (UNEP 2014a). With an
estimated 3.5 billion people dependent on oceans as a source of food and for their livelihoods,
marine pollution also has serious health, environmental and economic implications. Accumulated
litter entails clean-up operations that can require considerable financial resources and cause damage
to the health and safety of the people around the coast (UNEP and IMO 2013). In the medical field,
the health effects of exposure to microplastics through food and air remains largely unknown,
however cross-disciplinary research has identified several potential particles, chemical and
microbial hazards (Wright and Kelly 2017). Reflecting the gravity of this issue, Parties to the Basel
Convention on the Control of Transboundary Movements of Hazardous Wastes and their Disposal
adopted an amendment to the text of the Convention which aims to protect human health and the
environment by making global trade in plastic waste more transparent and better regulated through
a legally-binding framework (2019).
Other types of pollution can also have significant health, economic and environmental costs (UNEP
2017a). For example, freshwater pollution has significant consequences for human health. Over 80
per cent of the world's wastewater is released into the environment without treatment and is linked
to various health problems (UN World Water Assessment Programme 2017). For example, 58 per
cent of diarrheal disease, which is a major cause of child mortality, is due to a lack of access to clean
14water and sanitation and it is estimated that 57 million years of lives lost or lived with disability are
due to poor water, sanitation, hygiene and agricultural practices (IUCN 2017; UNEP 2016a). Waste
pollution is another significant issue given growing waste from consumption and industrial activities.
Two billion people do not have access to solid waste management and 3 billion people lack access to
controlled waste disposal facilities (UN Habitat 2019). The 50 biggest active dumpsites affect the
lives of 64 million people, including their health and can lead to a loss of lives and property, for
example when waste dumps collapse (UNEP 2019c).
While these costs are significant, there are also substantial benefits from taking action to address
pollution. For example, as noted in the sixth Global Environmental Outlook, although climate
mitigation actions to achieve the targets of the Paris Agreement would cost about US$22 trillion, the
combined health benefits from reduced air pollution could amount to savings in health care costs of
US$54 trillion (UNEP 2019d).
1.3 Study objective
Preventing and addressing pollution and associated health impacts is a key sustainable development
priority. A comprehensive mix of policies and measures will be needed to address this challenge. The
Background Report “Towards a Pollution-Free Planet” prepared for UNEA 3 outlined a framework for
action, including both targeted interventions and system-wide transformations to prevent and
control pollution (UNEP 2017a). On this basis, the Implementation Plan “Towards a Pollution-Free
Planet” has identified core areas of action and specific high impact solutions to address pollution,
including fiscal policies which are considered an ‘accelerator’ for implementation (UNEP 2018).
Through revenue-generating measures such as taxes and charges as well as through government
expenditures on targeted subsidies, fiscal policies could provide incentives to discourage polluting
activities or the use of polluting products and encourage uptake of less polluting alternatives in a
cost-effective way. At the same time, by removing existing price distortions that generate perverse
incentives such as environmentally harmful subsidies, fiscal policy reforms could reduce pollution
and improve associated health impacts (UNEP 2018) while generating public revenues which can be
used for different purposes.
Despite the potential for fiscal instruments to reduce pollution and associated health impacts, there
remains a knowledge gap on how to optimize the use of such instruments based on country
experiences and available data. In this context, the objective of this study is to explore the use of
fiscal instruments, such as taxes and subsidies, to reduce pollution and associated health impacts,
highlighting instances of good practice in the use of such instruments and setting out some of the
challenges in their application. The study considers different types of pollution and draws on insights
from experiences in both developed and developing countries to provide practical guidelines for the
use of fiscal instruments to reduce pollution and associated health impacts in support of the delivery
of the SDGs.
152. Fiscal policy as a response to pollution
There are several approaches to tackle different forms of pollution at the national and global level.
Regulatory options range from outright banning the use of certain pollutants, standard-setting,
information provision, producer responsibility schemes, and the use of permits, quotas and liability
laws. At a global level, most countries have signed international conventions, such as the Basel
Convention on the Control of Transboundary Movements of Hazardous Wastes and Their Disposal,
restricting and regulating the use and cross-national transfer of certain chemical pollutants. As a
complement or an alternative to regulation, there are several market-based approaches to reducing
pollution such as the use of tradable permit schemes, deposit refund schemes, and fiscal policy
instruments.
Fiscal policies such as taxes, charges and subsidies alter market prices and can influence the
behaviour of producers and consumers. As discussed in the introduction, pollution imposes various
environmental, social and economic costs on society. These costs are not typically reflected in
market prices; thus, producers and consumers have little incentive to consider the costs
(externalities) of pollution in their decisions. These misaligned prices have multiple effects, such as:
fuelling wasteful consumption and production patterns, generating widespread environmental and
health risks, and driving ecological and resource scarcities.
Governments can use fiscal instruments such as subsidizing and/or taxing the consumption or
production of a certain product or activity to alter its price. The explicit aim in this case is to modify
behaviour, an objective that differs from normal tax policy practice where the general objective is to
ensure the tax system is as neutral as possible in its impact on economic decisions, such as
investment. Such fiscal instruments can have quite a dramatic impact on behaviour as seen with the
introduction of congestion charges for vehicles entering certain zones in European cities, such as
London, Brussels and Milan (Minder 2019). In the first year of implementing the congestion charge
in London, the number of passengers entering the central zone by bus increased, NOX emissions
decreased by 18 per cent and PM10 decreased by 22 per cent within the zone, while hybrid car sales
increased (see Box 5).
By explicitly putting a price on a polluting activity, fiscal policies create an economic incentive to
reduce pollution and shift consumption towards more sustainable alternatives and are among the
most efficient and cost-effective approaches to reducing pollution. For example, in Stockholm,
Sweden, the introduction of a congestion tax has reduced ambient air pollution in the city by 5-15
percent, which has resulted in a significant decrease in acute asthma attacks among children 0 to 5
years of age in the years after the program. As the reductions were concentrated to the most
densely populated areas, the policy effects were approximately three times larger than what could
be achieved from a more general policy measure to reduce emissions of a similar magnitude—
demonstrating the efficiency and cost-effectiveness of such fiscal instruments (Eliasson and Beser
Hugosson 2006) (see Box 5). Furthermore, fiscal policies provide a clear, government-set price on
pollution that is visible to economic actors, particularly producers of pollution. In comparison, costs
of regulation can vary and can be hard to estimate in advance, leading to additional and more
obscure costs on producers. Although the complexity of pollution taxes varies depending on the type
of targeted pollution and the design of the tax, pollution taxes can be easier to implement and
enforce than some alternatives such as detailed regulations, which can require the setting up of
complicated (new) monitoring mechanisms and regulatory agencies.
A further benefit of pollution taxes is the government revenue raised, which can be significant.
According to IMF estimates, removing fossil fuel subsidies and adopting efficient fossil fuel pricing in
162015 would have lowered global carbon emissions by 28 percent, reduced fossil fuel air pollution
deaths by 46 percent, and increased government revenue by US$2.8 trillion (3.8 percent of global
GDP) (Coady, Parry, Le, Shang 2019). These revenues can be used in different ways. For example,
revenues can be allocated to the general budget or used to offset cuts in other taxes, such as taxes
on labour and income, as part of a broader tax reform, which in turn can promote employment,
economic growth and social fairness (European Environment Agency 2014). Empirical evidence
suggests that such a tax shift can increase economic efficiency and lead to positive employment
effects as, for example, in Germany, where green taxes were used to cut pension contributions and
lower labour costs and in Denmark, where a green tax shift is predicted to have a positive
employment effect (UNEP 2017a; Green Budget Europe 2014a). It is worth noting, however, that the
extent and prevalence of this “double dividend” is intensely debated, see for example: Fullerton and
Metcalf, 1997 and Schob, 2003. Other options are to earmark revenues for environmental purposes,
use revenues to compensate affected groups as in Indonesia (see Box 10) or recycle revenues back
to the affected sector as in Sweden (see Box 7).
It is also important to recognise possible disadvantages of using fiscal policies to address pollution.
Given that pollution arises from numerous sources, introducing multiple pollution taxes could make
the tax system more complex, while imposing pollution taxes on quite narrow bases may entail high
administration costs. There is also a risk of governments becoming dependent on the revenue
generated from pollution taxes if they represent a major source of revenue. In such cases,
governments may be reluctant to lose this revenue as behaviours start to shift away from the
sources of pollution and alternatives develop.
Fiscal policies are often implemented alongside other measures including regulation(emission
standards) and information tools(labels and communication campaigns). Working together, this
complementary mix of policies and incentives can effectively stimulate the systemic and
behavioural changes needed to prevent and reduce pollution and associated health impacts. For
example, in Thailand, in response to concerns about the health and environmental impacts of lead
pollution, the Government adopted a package of measures including fiscal incentives, regulatory
policies, information tools, strengthened traffic management measures, and vehicle maintenance
and inspections. This package led to the eventual phase out of leaded petrol, an improvement in air
quality and a decline in levels of lead in blood among the public (see Box 2).
17Box 2: Improving air quality and health in Thailand
In Thailand, concerns about the harmful effects of lead pollution on public health and the environment led the
Government to launch a programme to phase out the use of leaded petrol in 1991. A package of measures,
including fiscal incentives, was adopted to encourage a switch to less harmful substitutes, whereby differential
tax rates were applied to unleaded and leaded petrol. This was supported by regulatory policies, including
more stringent ambient air quality standards, new emission standards for motor vehicles and a requirement
that new vehicles be fitted with a catalytic converter. Traffic management measures were strengthened, and
vehicle maintenance and inspection improved. Information tools included a media campaign to educate the
public about the dangers of air-borne lead pollution (Thailand, Ministry of Natural Resources and Environment
2012; WBG 1996).
This package of measures led to a 50 per cent increase in the market share of unleaded petrol and the
eventual phase out of leaded petrol in January 1996. The reform led to an improvement in air quality in the
country (Figure 1) and a decline in levels of lead in blood among the public (Figure 2), thus contributing
significantly to the improved health of the population.
Figure 1: Lead air concentration of lead in Thailand Figure 2: Blood lead levels in school children in
Bangkok (1993 vs. 2000)
Source: Ministry of Natural Resources and Environment Thailand, (2012), Successful Air Quality Control Programs in Thailand,
Presentation by Dr. Wijarn Simachaya (Director-General Pollution Control Department)
2.1 Taxes and charges on pollution
Pollution taxes or charges can be applied on the production or consumption of a polluting activity.
The most common example of this approach are fuel duties in the transport sector3. These are
generally excise taxes or duties applied on the sale of fuel, often with different rates for different
types of fuels. Other examples include taxes, charges or fees to reduce the use of industrial and
chemical pollutants such as taxes on fertilizers and pesticides.
Pollution taxes and charges have been implemented in many different forms across the world,
motivated by a desire to tackle the negative consequences of pollution, including health impacts.
Although studies do not directly measure the impact of pollution taxes on health, it can be assumed
that the resulting reductions in pollution and increased government spending on health (with
revenues from pollution taxes) will feed through to improvements in health outcomes. Drawing on
country experiences from around the world, this section provides some insights on key issues to
consider when designing and implementing such pollution taxes or charges.
3The main difference between taxes and charges relates to their ease of implementation. Taxes must go through a relatively complex legal
process involving the passing and modifying of tax laws which can make taxes difficult to implement. Additionally, tax revenues go to the
central treasury, which is often perceived as a distant institution. In contrast, charges can be levied by the administration and revenues
can be earmarked for local or sectoral use. Charges are typically more readily accepted
18You can also read