Regional Development Plan South West Peninsula Technical Report - National Grid
←
→
Page content transcription
If your browser does not render page correctly, please read the page content below
Regional Development Plan
                    South West Peninsula
                      Technical Report

                                                                                       27th April 2018

                                                                          Alan Minton - National Grid
                                                         Ben Godfrey - Western Power Distribution

This technical report is to summarise the findings from the SW Peninsula Regional Development plan.

(Contains OS data © Crown copyright and database right 2018)

                                                   1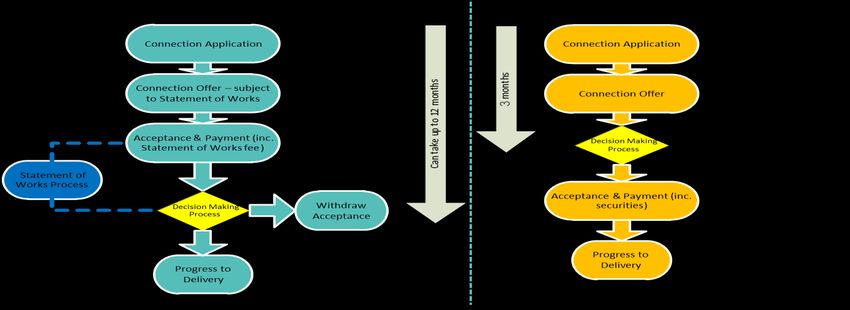
Contents

1 Introduction ......................................................................................................................................... 4
   1.1 What is a Regional Development Program? ................................................................................. 4
   1.2 Why choose the SW-Peninsula Network? .................................................................................... 4
   1.3 Executive Summary ....................................................................................................................... 5
   1.4 Key Recommendations for Industry Follow Up ............................................................................ 8
2 Assumptions on the evolution of the network .................................................................................... 9
   2.1 The chosen region ......................................................................................................................... 9
   2.2 History of DER connections on the South West Peninsula network to date .............................. 10
   2.3 Defining Future Network Needs ................................................................................................. 12
   2.4 Overview of the Principle Transmission Issues ........................................................................... 13
   2.5 Overview of the Distribution System Issues ............................................................................... 14
   2.6 Key areas of RDP Focus ............................................................................................................... 15
3 Regional Planning ............................................................................................................................... 16
   3.1 Our approach to joint T/D modelling & planning ....................................................................... 16
   3.2 Outputs of Study Process – Identification of Capacity Limitations ............................................. 17
   3.3 Identification of transmission connections capacity and agreed approach to capacity
   allocation to distribution customers. ............................................................................................... 18
       3.3.1 Compatibility with SQSS and Connect and Manage (C+M) ................................................. 18
       3.3.2 Capacity Available ................................................................................................................ 19
       3.3.3 Fair Capacity Allocation / Securities..................................................................................... 19
       3.3.4 Revised T /D Appendix G process – Meeting Connections Goal .......................................... 19
       3.3.5 Changes to DER / DNO Connections Process and Contracts ............................................... 20
   3.4 LoM Protection ........................................................................................................................... 21
       3.4.1 Summary of Loss of Mains issue .......................................................................................... 21
       3.4.2 Action Taken ........................................................................................................................ 22
       3.4.3 Control of Residual Risk ....................................................................................................... 22
       3.4.4 Further Work........................................................................................................................ 22
   3.5 Whole System Study ................................................................................................................... 23
   3.6 Extension of Whole System Study to a Transmission Regional Solution .................................... 27
   3.7 Fault levels .................................................................................................................................. 28
4 Operability Scheme Design .............................................................................................................. 29
   4.1 Identification of local areas for schemes and timeline for implementation ......................... 29

                                                                            2
4.2 Definition of local operability schemes ................................................................................... 29
4.2.1 Overview of proposed WPD DER control system ............................................................ 29
4.2.2 Principles of dispatch ......................................................................................................... 29
4.2.3 D-principles of Access following NGESO instructed DER services ....................................... 30
4.2.4 Dispatch of Intertripping ................................................................................................... 31
4.3 Commercial frameworks, curtailment funding and settlement approach ........................... 31
4.3.1 Effect on DER Project Developer....................................................................................... 31
4.3.2 Commercial Interactions between transmission & distribution (setting out DER route
to market for transmission constraints) ................................................................................... 31
4.3.3 Approach to Distribution constraints ............................................................................... 32
4.3.4 Participant charging, access rights and obligations under schemes .............................. 33
4.4 Conflicts of Service Study ......................................................................................................... 33
4.4.1 Service dispatch conflicts in the area ............................................................................... 33
4.4.2 Service conflicts - Overview .............................................................................................. 33
4.4.3 Service Conflict – Planning timescales.............................................................................. 35
4.4.4 Real Time Service Conflict Identification (In a SO Led Procurement and Dispatch
Model)........................................................................................................................................... 36
4.5 Integration of Schemes into the Control Environment and provision of Visibility & Control
across the TSO / DSO boundary ..................................................................................................... 37
5 Future Developments ........................................................................................................................ 40
6 Proposed RDP SW Implementation Program .................................................................................... 41
Appendix A: Paper on Application of “Deep” Connect and Manage .................................................... 42
Appendix B: Draft Proposals for the RDP Coordinated Procurement Principles .................................. 51
Appendix C: Glossary of Abbreviations ................................................................................................. 52
31 Introduction
1.1 What is a Regional Development Program?
The Regional Development Programs (RDPs) were set up to provide detailed analysis of areas of the
network which have large amounts of Distributed Energy Resource (DER) and known transmission /
distribution network issues in accommodating that DER. The idea is to use this analysis to innovate
and push the boundaries of current thinking with a “design by doing” approach to resolving the
issues pushing towards Distribution System Operator (DSO) type solutions and informing thinking for
the DSO debate.
By solving a specific case study that has a pressing need to improve outcomes for customers in
innovative ways, it is possible to make progress faster than the more conventional method of
agreeing changes in approach at industry forums before making changes to the way the industry
works. While there are risks that working in this way leads to a lack of standardisation across the
Great Britain (GB) network, this has been successfully managed by close cooperation and using the
regional development programs as case studies for the Energy Networks Association (ENA) Open
Networks Project. Techniques and processes used within the RDPs will be replicated across other
network areas as appropriate, resulting in innovative approaches being deployed much more
rapidly.
Initially the RDPs have been set up on a project basis, but as the techniques and findings of the RDPs
move into regular practice, it is envisaged that the RDP approach will continue to develop into a
series of Business as Usual (BAU) developments.
1.2 Why choose the SW-Peninsula Network?
The South West (SW) Peninsula network has been chosen, because Western Power Distribution
(WPD) and National Grid (NG) identified that conventional transmission and distribution capacity
issues could potentially limit the perceived volume of potential DER in the SW particularly, as
renewable solar and wind resources are favourable in the region and so the region is expected to
play a major part in meeting the future governmental green energy targets. Analysis was required to
fully understand the requirements and capability of the network in the region, to manage the future
capacity requirements and meet developers’ needs in the most efficient way for both developers
and consumers. In doing so it is expected to push the boundaries on conventional thinking in the
area of connection of generation and system operation, moving towards a network with significantly
more management of DER in operational timescales. The interaction between the transmission
system and the higher voltages in the distribution system have been shown to significantly increase
as the volume of DER grows into the future and therefore highlights the need to manage the
network more collectively into the future. Western Power Distribution (WPD) and National Grid
have been and continue to be willing partners to innovate and overcome whole system challenges.
41.3 Executive Summary
The following lists summarises the achievements of the SW Peninsula RDP to date and the aims of
the implementation plan in the coming months:
Findings of Study Analysis
Headline
Conducting a detailed joint transmission and distribution network analysis showed benefits in
understanding network security issues under conditions not previously experienced and enabled the
investigation of a range of build and operational solutions to show under what conditions “Whole
System” solutions benefit the consumer and DER project developers.
In more detail:
1. Detailed Analysis of the Transmission (T) and Distribution (D) networks in a coordinated way
identified the importance of the work as a number of problems were identified, where
considering of each network’s issues alone would give different and possibly conflicting
solutions. One example: in addition to the historic issues of potential overloading, fault
levels and steady state voltage control, once generation growth goes beyond 1.7GW
despatch (2.6GW connected) across the WPD-SW licensed area, the SW Peninsula area
becomes at increased risk to fast voltage collapse for the worst transmission circuit fault /
outage combinations. The configuration of the 132kV distribution network will play a big
part in defining where the fast voltage collapse limit sits.
2. Once diversity of generation is taken into account the existing network and planned
measures to manage the network are largely adequate for the maximum amount of
generation that would be credible to connect out to at least 2020.
3. The SW peninsula network is and will remain characterised by high demands in winter and
large volumes of solar generation on sunny days in spring and summer. For winter: falling
MVAr demands and increasing volumes of thermal generation mean high winter demands
do not present any new transmission network challenges, however greater levels of winter
demand due to electrification of heat and transport will increase the level of distribution
network reinforcement required.
4. Sunny days in spring and summer do present a significant challenge to both transmission
and distribution, particularly when windy and / or coincident with low consumer demand.
Analysis shows that the loadings in the peak solar condition are for a relatively short time
period in the year and therefore there is an economic balance to be obtained in managing
the generation to the network capability rather than building new network to meet the peak
requirement. In the short term investment in systems to better control generation on the
distribution network, sometimes to resolve transmission issues and developing the
functionality of the existing networks to actively work together will therefore be important.
Whole System Regional Network Options Assessments and Investment Recommendations
Headline
A Network Options Assessment (NOA) Cost Benefit Analysis (CBA) process has been used to
demonstrate the most efficient way to manage the Whole System interactions on the network and
find the correct balance between operational solutions and investment in network infrastructure on
both the D and T side of the boundary.
5In more detail
5. The original brief for the Whole System NOA study was to cut the geographical area down to
a more manageable area, namely North Cornwall and Devon which is rich in renewable
potential but is known to be near capacity by conventional means. The results of the studies
showed T / D interactions which made it necessary to extend the area considered for Whole
System interactions to cover South Cornwall and Devon in order to get the correct economic
solution for the original area. This has been combined with the wider RDP results to obtain
the optimum transmission solution for the complete SW Peninsula area. Note that the
analysis of the distribution system has been more limited outside the original Whole System
area.
6. The most constrained area relates to the capacity around Alverdiscott Grid Supply Point
(GSP) and particularly the Supergrid Transformers (SGT’s). The study shows the industry
wide most economical solution based on the WPD 2015 Future Energy Scenarios (FES) is to
add further SGT capacity at this site. This would be difficult to progress under the present
industry funding / securities arrangement, hence a need to review incentives and charging
arrangements as the industry moves into the next regulatory period.
7. Once the Alverdiscott capacity is optimised there is a wider constraining boundary which sits
across 4 transmission circuits and 2 interconnecting distributions circuits in Devon (Figure
3.5 in main text). The distribution overloads seen for transmission faults in this group are
beyond the standard (N-1) that the Distribution Network Operator (DNO) would normally
operate the network to and so the recommended Whole System solution would be to install
overload protection to trip the interconnection in the event of overload, but ensure that
protection does not operate until 1 second after the fault to allow transient voltage
instability to settle down on the transmission system before segregation of the distribution
network. 1 second is a typical operating time for such a scheme. The scheme would not trip
customer sites, and just break the parallel between GSPs. Any further or resultant overload
on the remaining transmission circuit needs to be removed by N-3 intertripping.
8. For the time being on the rest of the wider SW Peninsula network the combination of
facilities to enable pre-fault constraints on DER on a commercial basis and N-3 intertripping
will be the most economical solution to ensure continued operability of the network.
9. Fault levels will be potentially overstressed at Indian Queens and Exeter 132kV substations
from as early as 2020. An operational solution has already been adopted at Exeter, this
solution together with an operational solution for Indian Queens can be enhanced by low
value light current schemes Automatic Voltage Control (AVC) modifications at Exeter and
installing an auto-close scheme at Indian Queens, which are adequate to cover all scenarios
up to 2025 and all 2030 scenarios, except the most onerous Gone Green. To meet the 2030
Gone Green scenario potentially significant upgrades to substation infrastructure may be
required.
10. The whole system study has shown that by changing the way the networks are managed,
with close cooperation between the DNO’s developing Distribution System Operator (DSO)
function and National Grid Electricity System Operator (NGESO) it is possible to connect
fairly ambitious levels of DER with significantly lower need for expensive reconductoring /
uprating works on the 400kV and 132kV systems that may have been traditionally
considered.
6Changes to the way the SW Peninsula Network will be managed
Headline
The technical implementation of WPD’s Active Network Management (ANM) system including ability
to dispatch DER for transmission constraints, together with development of ways of procuring
flexibility from DER participants and the harmonisation of connection agreement terms between
transmission customers and distribution customers will enable a simplified connection process to be
achieved with more efficient outcomes for consumers and more consistency for developers.
In more detail
11. Although the analysis indicates capacity is likely to be adequate to at least 2020 and possibly
beyond, a large quality of the transmission capacity available is already allocated to
contracted parties, an increase in interest could potentially lead to viable developers getting
delayed connection offers as a result of the allocation process. Early adoption of revisions to
the DER connection package towards a “deep Connect and Manage” approach should
alleviate this issue, particularly when combined with the measures below which together
enable increased operational solutions.
12. A new single stage connection offer process for applicants in this zone would remove the
requirement to make offers subject to statement of works and enables generators to have
all the distribution and transmission contractual terms in their initial offer. This results in
quicker, more efficient connections for all customers.
13. The use of deep Connect and Manage with visibility and control of DER as Enabling Works,
socialised transmission securities and the use of NOA processes to decide transmission
reinforcements on a wider basis, provides more consistent outcomes to customers and a
more manageable position for network companies. The DER are no longer tied into specific
transmission works which means their risk profile is no longer effected by their place in the
queue and will not affect their connection date. The reinforcements can be planned on a
consistent industry best view thereby removing risks around speculative applications.
14. Commercial arrangements for DER flexibility will be developed to allow the appropriate level
of participation, through multiple routes, without undue burden on infrequent participants.
15. The RDP has recommended the development of a Control System and processes for
Transmission/Distribution operational interactions that will allow more efficient outcomes
for customers and consumers.
16. A very low volume of DER means that service conflicts between transmission and
distribution network needs are not currently a problem, but analysis shows that an
increased number of actively managed distribution networks will mean it will be in the
future. A process for assessing and managing service conflicts is to be trialled in the
implementation phase of the RDP. At the procurement stage there may be a need for
coordination of services required to secure the network against peak demands, but less so
for services required to secure the network around generation export where distribution
services are uncompensated connection conditions. In the dispatch phase the DSO will
provide system limits and the transmission services will be dispatched by the TSO within
those limits. It will also potentially provide compliance for the input of distribution
constraints into Project TERRE (Trans-European Replacement Reserves Exchanges). Project
TERRE is a cross-border balancing project which is designed to fulfil one of the requirements
of the European Union Electricity Balancing Guidelines.
7Further Development
17. The region would benefit from significant further work that has not been possible in this RDP
particularly: to develop better use of DER MVAr capability in managing limiting voltage
conditions and in how the industry can incentivise the use of commercial energy storage
devices to economically assist the management of the network, particularly the solar lead
peak network flows in the South West.
1.4 Key Recommendations for Industry Follow Up
The following list summarises where learning from the RDP needs further industry consideration and
/ or should be considered for adoption more widely and therefore requires action by the relevant
industry body to do so:
1. The RDP has demonstrated the value in NGESO modelling the effect of the distribution
system on the transmission system and how well managed interaction also adds value. To
enable this consistent modelling of the combined transmission system and distribution
system is essential, as is the ability to model this interaction under changing conditions, E.g.
changing solar output. Therefore the Week 24 data should be reviewed to align with RDP
modelling techniques, which will also align with the data for the trial reassessment process
under RDP Appendix G. Action for Open Networks, Work Stream 1, Product 12 to consider.
2. The RDP demonstrates the benefits of a deep application of connect and manage to avoid
tying the connection of small DER to significant transmission reinforcement works. Where
volumes of DER are involved the consistent application of the Wider System Cancellation Fee
across DER and transmission connections is required. The rules for the inclusion of DER in
the wider application fee calculation and for application of that fee to DER should be
reviewed to obtain a more consistent approach. Action for NGESO Market Change
Electricity.
3. Incentive setting for RIIO T2 and ED2 should take note of whole system findings to ensure
future incentives encourage the most efficient “Whole System” investments to be built. In
this example the study demonstrates that further SGT capacity at Alverdiscott is the most
efficient solution, but to build that capacity under current regulation the costs would be split
between all the new users involved with each user having to take the risk of increased costs
if their competitors pull out, which they are generally not able to take; it is therefore unlikely
that the SGT capacity would be built. Action for Charges Futures Forum - Network Access
Taskforce
4. Consistency of demand and generation data has caused rework, delays and uncertainty
throughout the RDP process. Adjustments were required to the 2015 WPD Future Energy
Scenarios (FES) scenarios to account for shortfalls in the original data and there was
significant misalignment between the 2015 WPD FES and the 2017 NG FES in the area.
Further work is required to better align the DNO FES, regional FES and NG national FES
which will ensure improved outcomes for both distribution and transmission systems and
particularly for “Whole System” interactions. Action for Open Networks, Work Stream 1,
Product 5 to consider.
5. The whole system analysis in this RDP has been a learning activity and taken much time and
resources. A process is now required to be able to update the recommendations of the
whole system study as backgrounds change. This will need to be faster and less resource
intensive and will need a suitable trigger to indicate the need to re-start the analysis. Action
for Open Networks, Work Stream 1, Product 1 to consider.
82 Assumptions on the evolution of the network
2.1 The chosen region
The RDP studies concentrate on the WPD-South West Licenced area. The transmission system has
differing limitations in differing regions. The WPD South West licensed area sits inside 2 different
transmission system constraints, the majority of the substations sit on the part of the network
known as the SW Peninsula, this part of the transmission network historically has been limited by a
peak winter demand, but as DER has connected in this area, the winter demand has reduced and
now is generally limited in the spring and summer seasons with large volumes of solar generation
exporting from the distribution system onto the transmission system. With the distribution network
having seen a greater variability in seasonal loadings due to intermittent generation, Low Carbon
Technology (LCT) demand and storage, both peak winter demand and peak spring/summer export
conditions are causing capacity limits to be reached. On a short term basis, capacity issues here have
the potential to be eased by better operational management of the network. The length of time this
would remain the most economical decision would vary depending upon the trajectory and mix of
LCT and DER uptake and the counterfactual conventional reinforcement costs. The CBA for using
operational management solutions will persist longer for transmission issues than distribution
issues, due to the larger individual scheme costs and greater amount of diversity.
2 GSP substations; Iron Acton and Seabank, sit in a different limiting area of the network. This part of
the network is characterised by large volumes of controllable generation exporting from a mixture of
transmission and distribution connected power stations in South Wales. The limitation here known
as SWALEX, is at winter peak and is concerned with days where prevailing weather conditions cause
only very low volumes of less controllable renewable generation to run and so there is a reliance on
thermal generation or storage. The transmission capacity on the circuits through Seabank and Iron
Acton are at thermal limits for credible faults in this area. Any generation constraints under these
conditions undermines the ability to meet the total system demand and therefore system security. It
is not appropriate to operationally constrain off generation at the very time it is relied on and so a
different solution to the transmission capacity issues in these 2 GSPs is required to that of the rest of
the WPD-SW licenced area. (Note – this does not affect renewable generation at the GSPs, because
the criteria to connect renewable generation is based on economics rather than the need to ensure
security of supply at time of limited renewable resources.)
Bath is WPD’s only Bulk Supply Point (BSP) off Melksham GSP, with little to no DER activity and
therefore does not have a need to progress any more advanced solutions for the connection of DER
in this location in the foreseeable future.
The solutions in this RDP therefore apply to the substations in the SW Peninsula group, namely
Abham, Alverdiscott, Axminster, Bridgwater, Exeter, Indian Queens, Landulph and Taunton GSP’s
and not Iron Acton and Seabank. It should be noted that for convenience, the total WPD connected
DER figures in this document are quoted for the complete licensed area.
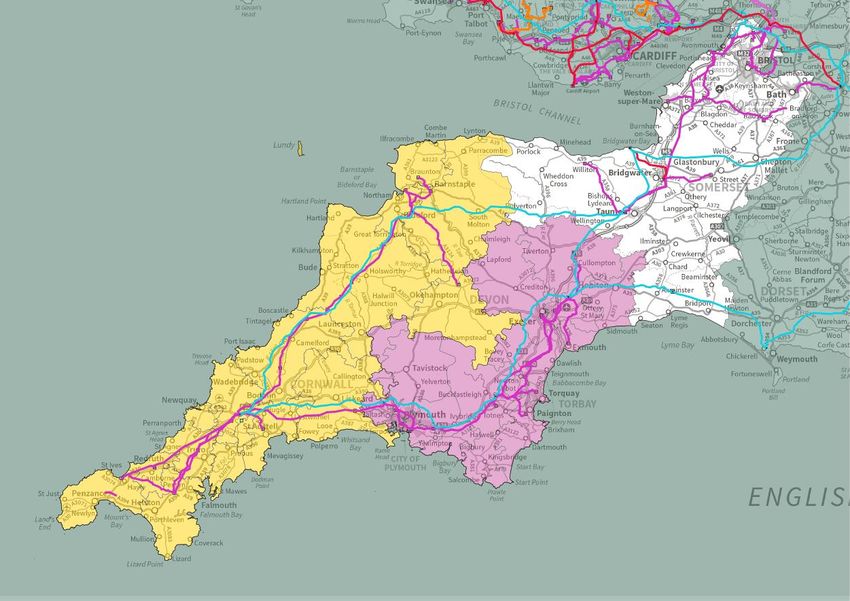
9Figure 2.1 showing 400/275kV transmission system, 132kV distribution system and the WPD-SW
Licensed area.
Key: 400kV lines blue, 275kV lines red, 132kV lines pink, Indian Queens / Alverdiscott GSP’s yellow,
Exeter, Abham Landuplh GSP’s pink and the rest of the WPD-SW licensed area white.
2.2 History of DER connections on the South West Peninsula network to
date
Traditionally requests for additional DER would be assessed on the distribution network by two
“edge case studies”: one considers the maximum demand with minimum credible generation and
the other the minimum demand at the point of maximum generation. This ensures the network
remains compliant at all times between, but the second criteria will often limit the capacity available
for generation unless network reinforcements are delivered. Note at distribution level there is not a
standard to detail what the network requirements for generation connections are. At transmission
level Security and Quality of Supply Standard (SQSS) does both generation and demand, at
distribution level Engineering Recommendation P2 just covers demand.
For transmission network capacity, the DNO would make an application on behalf of the DER via the
Statement of Works process usually once a DER has signed the DNO connection offer. For
convenience in data handling these were often bulked together in batches. These would be assessed
against the criteria in the SQSS, which allowed some flexibility with transmission generation to be set
to that which might reasonably be expected to operate at the period of the study, but with no
visibility and control of DER available to the NGESO, the DER would be set as per the distribution
study in the worst case scenario. If the DER connection did not cause the transmission system to go
10outside limits, a response in 28-days would allow the generation to connect. Where the transmission
network does go outside limits a response in 90-days would indicate the reinforcements required
and a formal offer made to the DNO, who in turn pass it onto the developer including their
contribution to the costs. DER developers were rarely able to secure these costs causing difficultly
for the progression of the project.
In this region, DNO restrictions on the F-route (132kV route paralleling Bridgwater to Seabank) and
the K route (132kV route paralleling Indian Queens and Alverdiscott) and transmission restrictions
on the Alverdiscott SGTs are of particular concern, with the potential to effect DER connections to
the network.
Pre RDP developments have improved this situation with WPD reconfiguration of the F-route,
increasing the operating temperature of the K-route and the introduction of intertripping for
outages on the Alverdiscott SGTs.
A bulk statement of works assessment over winter 2015/16 using the above approach indicated a
number of 400kV transmission circuit overloads and steady state voltage issues across the SW
Peninsula region. To address these issues and provide an improvement in customer outcomes for
the connection of DER a number of new initiatives were considered and this region was the first to
trial them in spring 2016. This involved a number of improvements:
Requirements for emergency operation of the network have been clarified and improved
upon. This allowed a move away from considering all DER operating at full load at once.
Instead an estimate was made of the maximum output at which each technology will
operate under the worst case planned transmission system condition. The difference
between 100% dispatch and maximum planned condition dispatch freed up capacity for use
by future users. In the very unlikely event that system conditions and / or generation levels
went beyond those the industry reasonably required to plan against, a process to emergency
disconnect DER could be enacted to take care of this scenario.
Where the GSP assets are connection assets, for all except Axminster on the SW Peninsula
group (+ Iron Acton and Melksham in the licensed area), the DNO has been provided with
details on the technical capabilities of the assets. Where the distribution connected
customers decide not to invest in additional connection assets and prefer to curtail their
generation instead, the DNO can manage the generation against the demand and capacity
from planning of capacity through to real time operation without further need to consult the
NGESO (Transmission infrastructure assets and the risks, management of power flows and
investment decisions for these assets remain a transmission responsibility). This is an
extension of the DNO’s traditional role and is part of the transition towards becoming a DSO.
There is an ongoing requirement that DER must have a 0.95 lead / lag MVAr capability,
dispatched by fixed Power Factor(PF) control, to compensate for the steady state voltage
issues they cause. This part, as have most parts, of the network now have steady state
voltage issues and this measure allows for early connection against those issues on an
uncompensated basis.
The Appendix G process was introduced allowing the DNO to add limited volume of new
connections without going through the formal statement of works process, as well as the
ability to swap new technically equivalent projects for cancelled projects, even between
GSPs.
DER N-3 intertripping via distribution visibility and control platforms for transmission outage
/ fault combinations to be added, as soon as possible at a later date to ensure economic
operation under outage conditions. In effect this is a partial move towards the
11implementation of connect and manage without the need for commercial control of the
generation.
The above measures allowed the majority of connection requests in the area to go ahead and these
improvements have managed the connection of new generation in the SW Peninsula area since April
2015. RDP analysis shows these measures will be adequate in the near future up to the maximum
expected volumes of generation expected to connect by 2020* and possibly beyond. It is recognised
there will be a need to go further for higher levels of DER beyond this and hence the need for this
RDP.
*As identified in the WPD 2015 FES document (See below).
2.3 Defining Future Network Needs
Each year National Grid produces Future Energy Scenarios (FES) documents which detail 4 different
projections of the UK energy requirements and how these are to be met well into the future. While
these include national estimates on volumes of future DER, the allocation to different nodes on the
network is approximate. In 2015, WPD employed Regen to add local intelligence to the national
position and produce a regional FES for the SW licenced area, with generation allocated at BSP level.
This follows the format of the national FES and indicates the generation and demand requirements
on a local level for 4 different scenarios. This data has been used to analyse the potential future
network needs of the area.
The WPD-South West FES provided detailed figures for 4 scenarios in 2015, 2020, 2025 and 2030 i.e.
16 sets of data. This volume of detailed network studies was not practical so it was decided to study
the worst case of 2020, 2025 and 2030. In each case the Gone Green scenarios are the worst case.
The increase in generation is approximately 1GW in each case, giving a fairly even range for detailed
study. The transmission generation in the area does not significantly change between now and the
2025 study, but for 2030 the potential commissioning of Hinkley C (replacing Hinkley B) and the FAB
interconnector to France via Alderney requires some sensitivity work as the potential change in
transmission generation and network configuration will have a significant effect.
Figure 2.3 Summary of WPD 2015 FES showing potential growth in renewable generation across the
south west area.
12It should be noted where as these are often referred to as the 2020, 2025 and 2030 studies, these
represent the worst credible case for those years and there is every possibility that a less onerous
scenario will occur in reality and so these studies alone do not represent what the industry should
plan for. Economic analysis has been added to the transmission system study results on the basis of
“least worst regrets” to determine the most appropriate way forward with the network and insure
connections can go ahead but the risk of stranded investment is managed.
WPD have recently asked Regen to review and update their FES analysis and extend further into the
future, first indications from this process are of a slower take up in the early years with the peak
take up on the worse scenarios in 2025 and 2030 having increased in this area. On this basis the
results of the system studies remain broadly valid, but will require a regular review over time.
2.4 Overview of the Principle Transmission Issues
Technical:
N-1 pre-fault thermal capacity i.e. potential circuit overloads caused by the switch out of
Hinkley - Melksham circuits and possibly Hinkley – Taunton circuits for maintenance / repair
in the higher generation scenarios.
N-3 thermal capacities, i.e. circuit overloads during the planned maintenance activity of one
circuit and the unplanned failure of 2 circuits on a common transmission tower. The GBESO
is required to ensure power supplies to customers across the wider region are maintained in
that situation although it is not a requirement to ensure all generation stays connected or
that supplies are maintained in a particular locality under this very onerous condition.
The use of generation inter-trips as a solution for N-3 capacity issues and the potential
restriction on that inter-trip use owing to known performance issues of Loss of Mains (LoM)
protection being incompatible with frequency containment policy.
Interactions with wider south coast boundary capacity issues (SC1), including SEPD and
UKPN DER DG for loadings on Bramley – Fleet – Lovedean route. See Figure 2.4.
Pre-fault High voltages
Fast voltage collapse particularly under N-3 conditions where the I2 X losses from the long
heavily loaded remaining transmission circuit cause a drop in voltage. This leads to either or
both of total voltage collapse in a few 100mS or G59 under voltage tripping of DER, because
of the slow recovery time on the voltage. The G59 under voltage tripping can also effect
generation slightly outside the boundary of the group.
BRAMLEY
MELKSHAM 1 2 B
South Coast 1 2 1 A 1 2
WEST
Overload Typical SC1
1
HINKLEY POINT
1
Fault 2 1
WEYBRIDGE
Outage
ALVERDISCOTT
A 1 1 2
B 2 FLEET
B 2 TAUNTON 1 2
2 1
1 BRIDGWATER BEDDINGTON
2 ROWDOWN 2 1
3 1 1
AXMINSTER A
LANGAGE 2 2
2 2 2 2 NURSLING LOVEDEAN 1
B A 1 B 2 2
CHESSINGTON 2
1 1 1 A 1
INDIAN EXETER 1 SELLINDGE B
LANDULPH CHICKERELL
QUEENS MANNINGTON CLEVE HILL
ABHAM 2 1
DUNGENESS 2
BOLNEY
MARCHWOOD NINFIELD
2 2
WPD SEPD 1 2 CANTERBURY
1 NORTH
1 1
FAWLEY SELLINDGE A
UKPN EdF
Figure 2.4 Diagram to show typical wider South Coast (SC1) Constraint.
13Commercial:
Resolve T/D connection process issues – ensure capacity allocated on same basis on both
networks in a timely manner.
Resolve capacity blocking issues, ensuring capacity is effectively used and new generators
are not unnecessarily held in queues. Ensure T / D generation secure capacity on an equal
basis.
Ensure the market opportunity for both T+D generation.
System Operability Issues:
Not directly connected to SW Peninsula and a blocker of connections, but RDP solutions potentially
help to resolve by introducing the ability to pay DER to change their output at times of system stress.
Insufficient controllable generation to balance and regulate the wider network.
Inadequate generation with inertia (rotating generation) to manage system frequency.
2.5 Overview of the Distribution System Issues
Technical:
SGT and some 132kV circuit overloads at Alverdiscott due to generation, following credible
distribution and or transmission Summer outages in the 2020 Gone Green scenario
Alverdiscott SGT, 5 x 132kV circuits and 3 GT overloads due to generation, following credible
Summer outages in the 2025 Gone Green scenario
132kV circuits between Hayle-Rame and Indian Queens-Cambourne due to peak demand,
following credible Winter outages in the 2025 Gone Green scenario
Multiple Winter demand and Summer generation circuit capacity exceedances in the 2030
Gone Green scenario
Significant multiple 132kV circuit overloads upon N-3 transmission outages
Commercial (similar to transmission issues):
Resolve T/D queuing issues – ensure capacity allocated on same basis on both networks.
Resolve capacity blocking / ensure T / D generation secure on an equal basis.
Ensure the market opportunity for both T+D generation.
Operability:
Limitations on the ability for distribution assets to provide sufficiently increased post fault
short term ratings, which would reduce the volume of required pre-fault curtailment.
Limitations on the balance of actions carried out pre-fault as opposed to post-fault due to
the speed of actions carried out by ANM systems.
An increased volume of distribution connection generation being permitted to access the
network through ANM systems increases the reliance on ANM systems and their operational
availability.
142.6 Key areas of RDP Focus
The table below indicates the RDP goals and the current status of the work.
Initiative Main Objective Status
1. Network To review, enhance and jointly agree the Revised modelling at transmission level to
Modelling assumptions on generation and load in both model complete 132kV network to first
the distribution and transmission and busbar below 132kV, with 1MW and above
identification of the key limiting factors generation connected below 132 being
including the voltage stability limits and represented by equivalent PV, Wind,
particularly the interaction across the T+D thermal and battery generators at that bar.
boundary. Fault levels modelled by equivalent in feeds
at the first bar below 132 (with sync gen
equivalent at that bar removed). Key limiting
factors identified, which required some
dynamic voltage modelling for worst
conditions to understand the post fault
voltage instability risks. Key interactions
across the T / D boundary identified, which if
correctly managed can improve the outcome
for customers and consumers.
2. Move towards To look at the provision of visibility and The low frequency of high solar output
DSO control of DER to manage the distribution events at the same time as the limiting
network and in particular its ability as an system outages, means the ability to control
economic alternative to asset investment on DER output at these times is an economic
the transmission network. This will include a solution to manage the transmission
further review of the T/D connections process network. A process is in train to modify the
and the purchase of flexibility from DER to connections process in this area to make the
manage the network. provision of visibility and control of output a
key requirement of connection and to
facilitate the required backstop pricing and
flexibility markets to ensure operability and
cost effective outcome.
3. T/D Services To inform the procurement process for future Principles for assessing service conflict in
Coordination and ANM equipment and operational control planning timescales are available, as are the
DER dispatch. protocols such that there is a system in place signal requirements to manage service
to control the dispatch of DER resources and conflict in real time. A program to
subsequently manage transmission issues and determine how those signals feed into
potential conflicting actions between the NGESO IT systems have been devised and an
transmission and the distribution networks. implementation program for trialling signals
agreed.
4. Whole system Seeks to prove the principles of whole system T and D options identified and power system
network network planning by performing a cost-benefit studies performed to identify limits. After
planning analysis to determine the most cost effective some teething problems aligning boundary
measures including transmission build, limits describing different T and D network
distribution build and operational measures to capabilities and also generation data
achieve the minimum cost and risk to the compatibility issues resolved a CBA using
consumer in enabling the volume of “Least Worst Regrets” has identified the
renewable connections in the North Cornwall optimum solution for the transmission
/ Devon areas required by developers in system using whole system operational and
response to the Government’s green energy build options. Two reports have been
15policy. To form recommendations regarding produced, one detailing the options and
processes to enable whole system network solutions for the SW Peninsula group and
planning to be used going forward. the other the processes used in the work.
5. Protection To determine the impact of current loss of Interim ban on new vector shift across SW
system stability mains (LoM) protection settings on system Peninsula in place. Final solution relies on
stability after a fault. Determine how these DC0079 retrospectively removing Vector
undermine capacity and seek to address Shift and adjusting all rate of change of
capacity restrictions. frequency (RoCoF) setting to new policy.
Analyses of VS incidents ongoing to inform
priorities for DC0079 roll out. Interim risk
reduction devised to target immediate
settings changes on 700MW of vector shift
protected DER across southern England to
RoCoF. G59 under voltage protection
identified as an additional limiting factor
under onerous circumstances.
3 Regional Planning
3.1 Our approach to joint T/D modelling & planning
There are a number of modelling, operational and planning initiatives which have been considered
to improve outcomes in this zone. Many of these are consistent with other industry initiatives under
consideration outside of the RDP zone. The RDP explores how the consistent application of these
initiatives can be used to improve the ability to connect the required volume of renewables within
the zone in an economic way:
1. Improvements in the offline transmission system load flow and stability model:
a. DER above 1MW to be modelled separately from demand at first 33kV busbar.
Generation split into type / fuel, e.g. solar, wind, storage etc. and further split into
generation actually at the 33kV and generation below 33kV. The type / fuel allows
for easy scaling of the model to look at different scenarios. The generation at 33kV
can be accurately modeled to give the correct voltage performance, and that below
will always be an approximation on voltage performance.
b. Operability review to ensure the options on the WPD 132kV network and the
transmission network are properly coordinated to achieve the best benefits.
2. Improvements in the distribution planning load flow model:
a. Moving from a two edge-case based analysis to a time series based analysis using
representative days covering the range of operation credible for the worst-case
conditions on the network
b. Significant uplift in the level of automated analysis for confirming security of supply
compliance
c. Improved accuracy of the transmission equivalent model used during distribution
system analysis
d. Automated analysis techniques developed for optimising the actions to be taken
when operating ANM systems using technical best principles of access.
e. Methodology developed to estimate the energy curtailment required to abate
network exceedances under ANM
163. Studies undertaken to identify the network limitations against the most onerous DER
connection scenarios considered credible for 2020, 2025 and 2030.
4. A Whole System study to look at the most efficient across industry solution to connect the
required level of DER in the North Cornwall / Devon area (Indian Queens and Alverdiscott
GSPs), where the potential for renewables is greatest, but the network is most limited. Note:
the nature of the technical problems on the network necessitated spreading the area to
include south Cornwall / Devon (Landulph, Abham and Exeter GSPs). The whole system
study looked at a mix of operational (control and curtailment), conventional build,
transmission and distribution solutions to find the most economical solution for the end
consumer of connecting generation as per the FES scenarios on a least regret basis.
5. Expansion of the CBA techniques being used by the Whole system study to cover the
complete region to determine the correct balance between operational and asset build
solutions at transmission level.
6. Developing the control systems and commercial terms and conditions required to
implement new connections based on managing DER output rather than building a network
to accommodate the worst case condition.
7. Adopting a “Deep Connect and Manage” approach to new connections, with the aim of
providing similar conditions for transmission and distribution customers, ensuring all
network capacity can be used and is not tied up in the connection queue process and that
the most economic connection arrangements from the whole system study and economic
analysis can be implemented.
3.2 Outputs of Study Process – Identification of Capacity Limitations
Based on the above approach a detailed power system analysis was carried out as part of this RDP.
Initial steady state load flow studies indicated the following Transmission and Distribution network
issues:
There are significant interaction between transmission fault /outage combinations and the
configuration of 132kV network, particularly in the Alverdiscott area with overloads on the
Alverdiscott SGTs and the 132kV K-route between Alverdiscott and Indian Queens GSP.
Furthermore the 132kV circuits that parallel the Landulph – Abham – Exeter GSPs tend to
overload for faults that trip the parallel 400kV route. The load flow studies demonstrated that
the voltage and thermal limitations on this part of the network is significantly dependent on
132kV network configuration.
On a wider system boundary known as B131, the main 2 issues were numerous overloads in the
N-3 condition and pre-fault overloads in during planned outages on Hinkley Point – Melksham
and Hinkley Point – Taunton 400kV circuits.
The worst fault / outage combination is Indian Queens – Alverdiscott – Taunton 400kV planned
outage and Exeter – Abham – Langage 400kV double circuit fault outage. For this combination,
once the DER output level reaches 1.7GW (as measured across the WPD-SW licensed area),
there is a risk of fast voltage collapse and uncontrolled generation trip triggered by G59
protection setting on small embedded generators. This issue is more probable to persist under a
credible but less likely scenario of Langage machine running when DER output is high.
Fault level studies identified potential switchgear overstress at Indian Queens and Exeter 132kV
substations as the DER level increases. Studies indicate that changes to the running arrangement
of these substations and DNO network configuration can help to manage fault level.
1
B13 Boundary is defined by 400kV circuits between Hinkley point –Melksham and Chickerell – Mannington substations.
Depending on the level of generation within the boundary there is thermal limitation of export or import of power on this
boundary
173.3 Identification of transmission connections capacity and agreed
approach to capacity allocation to distribution customers.
3.3.1 Compatibility with SQSS and Connect and Manage (C+M)
The SQSS security standard should be applied to the network ahead of the SQSS economic standard.
The purpose of the security standard is to ensure that under peak demand conditions if the
availability of “uncontrollable” renewables is limited, there is sufficient network capacity to meet the
demand from controllable generation sources. The SQSS could be considered slightly out of date in
this area; because it specifies which generation sources can be used. The Capacity Mechanism,
which is the means by which the industry now procures generation to secure the winter peak
demand under these conditions, takes a broader approach to generation type. In practice with a
high demand in the SW Peninsula group and zero contribution from the large quantity of wind and
solar in the group, the security standard does not restrict the next tranche of generation and so the
security standard does not currently limit this part of the network. This is not the case for Seabank
and Iron Acton GSP’s which sit in the SWALEX group as this group has a large account of low merit
thermal generation and the security standard is likely to be an issue.
Having satisfied the SQSS security standard, the SQSS economic standard would be applied to
generation connections and generation connections allowed under the rules of Connect and Manage
(C+M). C+M requires 7- deterministic rules as detailed in CUSC to be applied. Any SQSS works
beyond those rules would then be considered wider works, which are not required to be completed
before connection provided the network also passes an economic test. The economic test will be in
the form of a local NOA CBA – see section 3.6.
Detailed analyses for the application of connect and manage and assessment of compliance with the
7 deterministic C+M rules can be found in appendix A. The key requirement from this analysis is that
the ability to operate the network under all conditions is achieved by having visibility and a means of
operational control on the new connecting DER.
C+M also requires actions to make the network compliant with SQSS as soon as possible. Generally if
there are any such actions they are managed by the transmission companies and do not affect the
generators terms and conditions. In this case there is one action that requires action from the
developer and DNO and that is the provision of N-3 intertripping to manage post fault overloads in
the industry most economical way.
It is necessary to include the terms and conditions for the N-3 intertrip in the NGESO-DNO Bilateral
Connection Agreement (BCA) and the DNO – DER connection agreement. Also a suitable operability
scheme is required to trip the generation. It is proposed to interface the South West Operational
Tripping Scheme (SWOTS) to the ANM scheme controlling the DER to provide this functionality.
183.3.2 Capacity Available
Each application would be considered under the principles of Connect and Manage, which requires
the generation background to be set to that which ought reasonably to be foreseen to arise in the
course of a year of operation. A summary of the application of FES scenarios to this zone is shown in
appendix A and indicates the range of outcomes in this area. Lead times on the build options
recommended via economic analysis are relatively low as is the volume of constraints in the chosen
options. On that basis there is no reason to put an immediate cap on the volume of DER that can be
offered a connection under this regime, although good management of new connections to the
network is required to ensure accurate knowledge and provision of the data to allow effective
management of the network under the connect and manage principles and a regular review of the
Whole System CBA to allow the correct build solutions to trigger at the optimum time.
3.3.3 Fair Capacity Allocation / Securities
To ensure the allocation of capacity can be consistently and fairly handled between T and D on an
equal basis and that there is due process in place to apply connect and manage principles fully, the
transmission wider network cancellation fee will be consistently applied to all applicants. Under the
connect and manage regime the trigger is each DER providing visibility and control and therefore is
the individual DER applicants connection date. The wider cancellation fee is a socialised cost per MW
that represents the cost of cancelling wider transmission (which are themselves socialised in the
connect and manage model) in the event that applicants reserve capacity and do not proceed. Note:
If there were no reinforcement to connect generation in the area there would be no works and
wider cancellation fees would be zero. The wider cancellation fee ensures there is cost recovery for
potential abortive works and an incentive on developers to ensure their connection applications are
realistic and up to date.
To apply the C+M principles a process is required to decide, if generators are meeting their original
intended contractual obligations or not. This is because a principle of C+M is that once a connection
offer under the regime is given it cannot be withdrawn even if system conditions adversely change.
However conversely, if the generators intent changes it is fair that the new intent is assessed on the
latest background and any terms and conditions amended accordingly. In its simplest form this
could be building a power station to the specification and time in the connection contract. However,
even the best planned projects get delayed often for reasons outside the developers reasonable
control, under these circumstances it is not reasonable to change the C+M terms in the contract (if
they have changed) or apply a cancellation fee. Neither is it fair that a project that has no intention
of proceeding to plan should hold capacity and not be responsible for the costs of proving capacity
at their requested date. This is resolved by the application of QMEC,2 which is the new agreed
industry standard on fairly administering queuing processes for DER.
3.3.4 Revised T /D Appendix G process – Meeting Connections Goal
The way that transmission capacity allocation works with DER has been an area of industry debate
and concern for some time. The introduction of the trial Appendix G process improved this area.
2
For more information on the Fair and Effective Management of DNO Connection Queus please go to:
http://www.energynetworks.org/assets/files/news/publications/Reports/ENA%20Milestones%20best%20Practice
%20Guide.pdf
19You can also read