Regional Estuary Monitoring Programme (REMP) intertidal sedimentation measurements, results and review of methodologies - Waikato Regional Council ...
←
→
Page content transcription
If your browser does not render page correctly, please read the page content below
Waikato Regional Council Technical Report 2019/04

Regional Estuary Monitoring
Programme (REMP) intertidal
sedimentation measurements,
results and review of
methodologies

www.waikatoregion.govt.nz
ISSN 2230-4355 (Print)
ISSN 2230-4363 (Online)
Prepared by:
Stephen Hunt

For:
Waikato Regional Council
Private Bag 3038
Waikato Mail Centre
HAMILTON 3240

June 2019

Document #: 4099567
Peer reviewed by:
 Malcolm Green (Streamlined)
 Karin Bryan (University of Waikato)           Date       April 2019

 Approved for release by:
 Mike Scarsbrook
                                                 Date     April 2019

Disclaimer
This technical report has been prepared for the use of Waikato Regional Council as a reference document
and as such does not constitute Council’s policy.

Council requests that if excerpts or inferences are drawn from this document for further use by individuals
or organisations, due care should be taken to ensure that the appropriate context has been preserved,
and is accurately reflected and referenced in any subsequent spoken or written communication.

While Waikato Regional Council has exercised all reasonable skill and care in controlling the contents of
this report, Council accepts no liability in contract, tort or otherwise, for any loss, damage, injury or
expense (whether direct, indirect or consequential) arising out of the provision of this information or its
use by you or any other party.

Doc # 4099567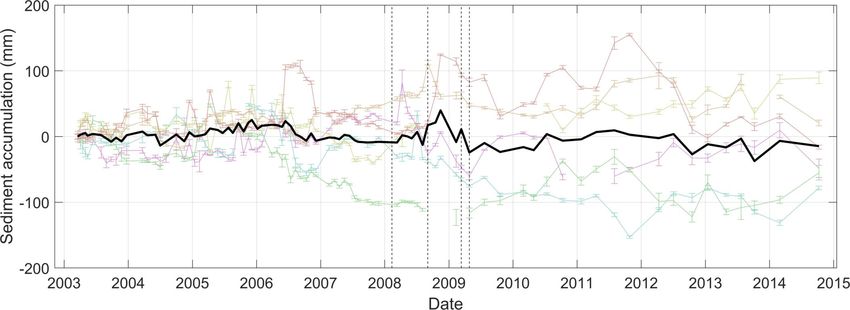
Doc # 4099567
Acknowledgement
Thanks to Dr Hilke Giles and Dr Hannah Jones for initiating this research and for providing
invaluable guidance that kept the work focused. Thanks also to Dr Pete Wilson for providing
sound advice and to Dr Mike Townsend for reviews, discussions and being instrumental in
bringing the project to a conclusion. Members of the Coastal Special Interest Group (C-SIG)
provided advice, encouragement and most importantly a national perspective which helped
inform the purpose of the work.

The original monitoring programme was setup and sustained by a large group of WRC technical
staff including my predecessors Bronwen Gibberd, Dr Stephanie Turner, Dr Vernon Pickett and
Dr Malene Felsing and field staff including Nathan Singleton, Julia Simpson and Dayna Calkin.
Without the efforts of these WRC staff members there would be no data so this report owes a
great deal to your efforts over the years.

Finally thanks to Prof Karin Bryan (University of Waikato) and Dr Mal Green (Streamlined
Environmental Ltd) for external peer review which improved the report considerably.

Doc # 4099567                                                                           Page i
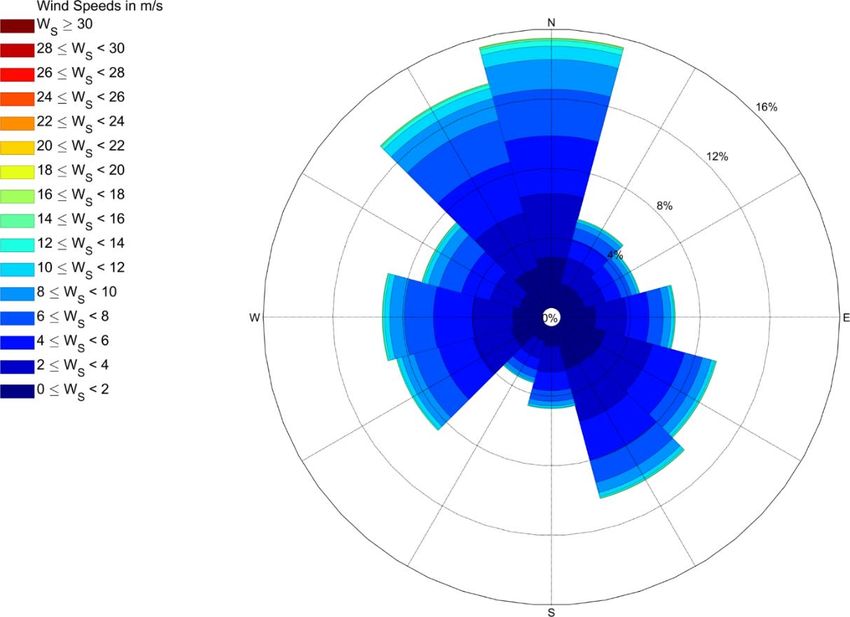
Table of Contents
1         Introduction                                                    1
    1.1      Estuarine and sedimentation processes                         1
2         Methodology                                                     4
    2.1      Sediment plate methodology                                    4
    2.1.1 Firth of Thames                                                  4
    2.1.2 Whaingaroa (Raglan) Harbour                                      5
    2.2   Calculation of sediment accumulation rate                        8
    2.3      Plate elevation and water depths                              8
    2.4      Plate material and condition                                  8
3         Results                                                         9
    3.1      Firth of Thames                                               9
    3.2      Whaingaroa (Raglan) Harbour                                 17
4         Discussion                                                     27
    4.1      Sedimentation trends                                        27
    4.1.1 Firth of Thames                                                27
    4.1.2 Whaingaroa (Raglan) Harbour                                    36
    4.2   Effectiveness of methodology for measuring sedimentation.      37
    4.2.1    Plate subsidence                                            37
    4.2.2    Plate material                                              37
    4.2.3    Measurement technique                                       37
    4.2.4    Temporal scale of measurements                              38
    4.2.5    Spatial configuration and coverage                          44
5         Conclusions and recommendations.                               46
    5.1      Plate setup.                                                46
    5.2      Plate positioning                                           46
    5.3      Temporal frequency of measurements                          47
    5.4      Measurement method                                          47
6         References                                                     48
Appendix A. Heights of plates from LiDAR and tide gauge data             52
Appendix B. Wave model                                                   55

Page ii                                                               Doc # 4099567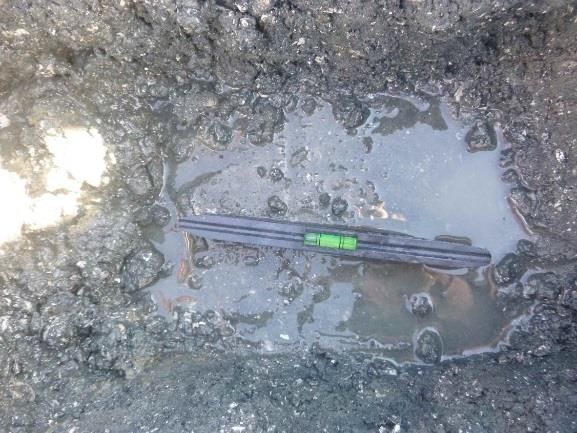
Figures
Figure 1: Locations of the REMP sites, Tararu tide gauge and wave hindcast model in the Firth of
             Thames.                                                                                6
Figure 2: Locations of the REMP sites in Whaingaroa (Raglan) Harbour.                               7
Figure 3: Sedimentation recorded in the Firth of Thames over the Kaiaua Plates.                    11
Figure 4: Sedimentation recorded in the Firth of Thames over the Miranda Plates.                   12
Figure 5: Sedimentation recorded in the Firth of Thames over the Gun Club Plates.                  13
Figure 6: Sedimentation recorded in the Firth of Thames over the Kuranui Bay Plates.               14
Figure 7: Seabed level relative to mean sea level and SAR.                                         15
Figure 8: Sedimentation recorded over the Haroto Bay Plates.                                       18
Figure 9: Sedimentation recorded over the Whatitirinui Island Plates.                              19
Figure 10: Sedimentation recorded over the Te Puna Point Plates.                                   20
Figure 11: Sedimentation recorded over the Okete Bay Plates.                                       21
Figure 12: Sedimentation recorded over the Ponganui Creek Plates.                                  22
Figure 13: Seabed depth relative to mean sea level and associated SAR.                             23
Figure 14: Distribution of wave events from the MetOcean View hindcast model plotted as the
             percentage occurrence of Tp and Hs (see Figure 1 for hindcast model location).        30
Figure 15. Wave rose showing distribution of wave events from the MetOcean View hindcast model
             plotted as the percentage occurrence of Hs and the associated wave direction          30
Figure 16: Wave rose showing distribution of wave events from the MetOcean View hindcast
             model plotted as the percentage occurrence of Tp and the associated wave
             direction.                                                                            31
Figure 17: Wind rose summarising the wind record at Tararu tide gauge between 1st January 2003
             and 1st January 2015 (see Figure 1 for tide gauge location.                           31
Figure 18: Modelled τw for a 100 km fetch (solid coloured lines) and a 25 km fetch (dashed coloured
             lines) for water depths ranging between 0 and 4 m and wind speeds ranging between
             0 and 6 m/s.                                                                          35
Figure 19: Frequency of occurrence of bed level change between monthly samples expressed as a
             percentage occurrence for Kaiaua (blue line), Miranda (red line), Gun Club (yellow line)
             and Kuranui Bay (purple line).                                                        39
Figure 20: SAR determined from analysis of the full record and a sub-sampled annual record for
             the Firth of Thames.                                                                  41
Figure 21. SAR determined from analysis of the full record and a sub-sampled annual record for
             Whaingaroa (Raglan) Harbour.                                                          42
Figure 22. Summary of values of R2 from data comparison in Figures 20 and 21.                      43

Tables
Table 1: Summary of SAR (mm/yr) at each plate in the Firth of Thames.                     10
Table 2: Summary of plate condition in the Firth of Thames on the 14/06/2018.             16
Table 3: Summary of SAR (mm/yr) at each plate in Whaingaroa (Raglan) Harbour.             17
Table 4: Summary of plate condition in Whaingaroa (Raglan) Harbour on the 31/08/2016 (Haroto
            Bay and Te Puna Point) and 10/04/2017 (Whatitirinui Island, Ponganui Creek and
            Okete Bay).                                                                   24

Doc # 4099567                                                                                           Page iii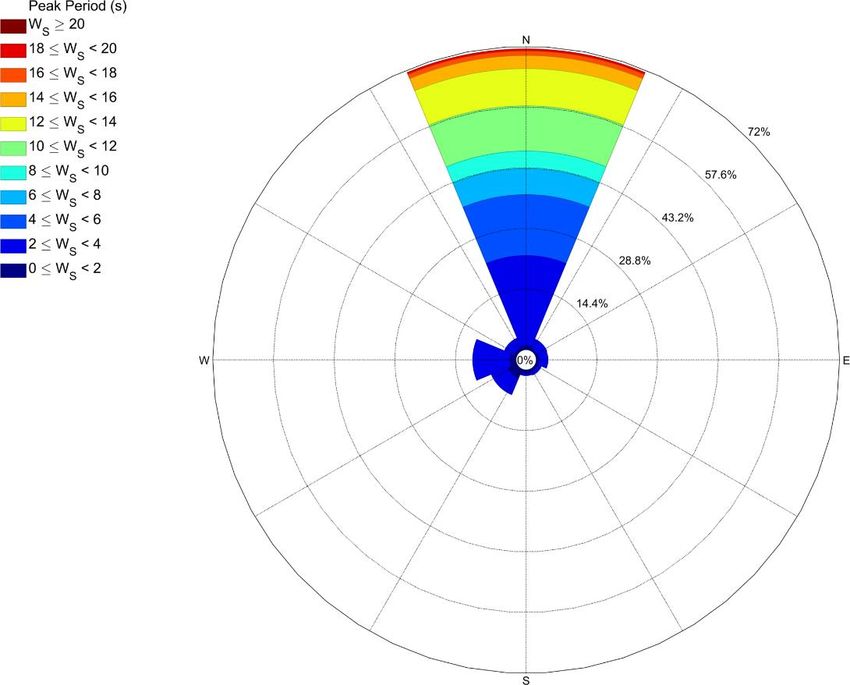
Abstract
Sedimentation within estuaries is a natural process but excessive sedimentation can lead to poor
ecological health, with current guidance suggesting that sediment accumulation rates (SAR)
should not exceed 2 mm/yr above pre-catchment disturbance SAR. To track patterns of
contemporary intertidal sedimentation WRC has been monitoring SAR in the Firth of Thames
and Whaingaroa (Raglan) Harbour since 2003 as part of an estuarine State of the Environment
(SoE) monitoring programme. The programme measures sediment depth above plates
(concrete pavers) buried in the intertidal flats. The purpose of these measurements is to track
SAR in each estuary and to pair the measured SAR with monitoring of ecological health. This
report analyses the WRC SAR monitoring to assess the suitability of the methodology including
spatial distribution of plates, temporal distribution of measurements and longevity of the plates.
Sedimentation rates at each monitoring site have also been derived from the measurements.
This purpose of this analysis is to determine if the sedimentation monitoring programme has
been effective and to establish principles around which a standardised sedimentation
monitoring programme can be designed in the future, for the purposes of both SoE monitoring
and for implementation of monitoring set out in Sea Change 2016 (a spatial plan for the Hauraki
Gulf). The analysis found that sedimentation rates are highly variable, with areas of both erosion
and accretion ranging between -11.52 (erosion) and 5.59 (accretion) mm/yr in the Firth of
Thames and -3.98 (erosion) and 7.04 (accretion) mm/yr in Whaingaroa (Raglan) Harbour. This
spatial variation in SAR can be tentatively related to the spatial distribution of hydrodynamics in
each estuary including the presence or absence of wind waves, the patterns of residual
circulation and magnitude of sediment supply. Sedimentation plates are effective at measuring
annual rates of SAR providing the plates are set out with an appropriate spatial array that take
into account the spatial distribution of hydrodynamics and are measured annually at regular
intervals for at least ten years. Simple guidelines for installing the plates and a standardised
methodology are also outlined in this report.

Page iv                                                                               Doc # 4099567
1     Introduction
      Waikato Regional Council’s Regional Estuary Monitoring Programme (REMP) was initiated in April
      2001 to determine the state of selected estuaries in the region and monitor changes over time (Turner,
      2000). REMP has recorded macrofauna and sediment characteristics in Whaingaroa (Raglan) Harbour,
      Firth of Thames and Tairua Estuary, with the aim of relating changes in benthic community structure
      and ecological health to changes in the physical environment. Measurement of intertidal sediment
      accumulation rates (SAR) began in Whaingaroa (Raglan) Harbour and Firth of Thames in 2003 using a
      series of buried sediment plates, measurements have not been made at Tairua. The purpose of this
      report is as follows:

          1. Analyse the trends of intertidal sedimentation measured in the programme.
          2. Review the effectiveness of the sediment plate methodology as a monitoring technique in the
             context of REMP and WRC monitoring requirements.
          3. Propose an updated, scientifically robust and effective intertidal sedimentation monitoring
             plan for future use.

      This report discusses intertidal sedimentation only, as the measurement of subtidal sedimentation
      requires a different approach and methodology and therefore will be addressed in forthcoming work.

1.1   Estuarine and sedimentation processes
      WRC measures sedimentation because of the potential negative impacts on the marine environment
      (Thrush et al. 2004). Although sedimentation is a natural process, there are many human activities
      that can accelerate sedimentation in the coastal environment. Elevated SAR, suspended sediment and
      changes in seabed sediment composition have a range of effects on the marine ecology including
      changes in species composition, loss of sensitive species, decline in diversity, and modification of
      animal behaviours (Lohrer et al. 2004, Norkko et al. 2002, see review in: Townsend and Lohrer, 2015).
      ANZECC Guidelines now recommend a maximum SAR threshold of 2 mm/yr above background levels,
      as the available evidence indicates that environmental degradation can occur at rates above this
      threshold (Townsend and Lohrer, 2015).

      Sea Change has produced a Marine Spatial Plan that aims to direct future management across the
      Hauraki Gulf Marine Park area (an area encompassing the Hauraki Gulf and the Coastal Marine Area
      (CMA) of the eastern Coromandel) and outlines a series of objectives which require supporting
      evidence from monitoring. The ANZECC guidelines have been adopted by Sea Change and objective
      WQ1 states (Sea Change, 2017): “Sedimentation rate across the Gulf to be no more than 2 mm per
      year above the baseline rate by 2050.” Although this guidance is based on our best understanding,
      SAR and resultant ecological impacts are known to be poorly characterised, with most evidence of
      ecological harm based on short-term deposition ‘events’ (Townsend and Lohrer, 2015). This may differ
      to the characteristics of sediment accumulation occurring within an estuarine system, which could
      occur over a range of temporal scales, either as: (i) gradual incremental sedimentation, (ii) a discrete
      depositional event sediment following land clearance or a storm event, (iii) as a result of successive
      accretional and erosional episodes or due to a combination of the above.

      Doc # 4099567                                                                               Page 1
The reality is that patterns of estuarine sedimentation are complex and do not follow straight-forward
or predictable relationships e.g., between the magnitude of sediment supply (rivers and/or open
ocean), the amount of suspended sediment in an estuary and the resultant sedimentation patterns
and SAR within the estuary basin. In general terms the deposition of sediment is controlled by
complex interactions of freshwater flow (e.g. McKergow et al., 2010) and oceanographic processes
such as tidal flow (e.g. Brown and Davies, 2010), waves (e.g. Green et al., 1997), residual circulation
(e.g. Bolle at al., 2010) and intertidal drainage (e.g. Fagherazzi et al., 2008). These processes all
contribute to an uneven distribution of sediment across the estuarine basin and therefore modify the
basin morphology. This further changes the hydrodynamics through mechanisms such as distortion
of tidal patterns and tidal asymmetry and flow (Friedrichs and Aubrey, 1988) or wave dissipation and
fetch length (Fagherazzi et al., 2006, Hunt et al., 2015) and these hydrodynamic processes in turn
affect the subsequent patterns of sediment deposition. Therefore the hydrodynamics, sediment
supply and morphology are all interlinked in a complex non-linear fashion, meaning that
sedimentation is difficult to predict and that, even under a scenario of consistent sediment supply,
the rate and patterns of sedimentation would not be consistent over time.

Furthermore, the sediment type and particle sizes can change over time (e.g. Hume and Dahm, 1992)
due to changes in land use, catchment management and natural variability from erosion. Different
sediment types will have different properties that affect their transport and subsequent deposition
(Soulsby, 1997; Whitehouse et al. 2000). Sediment particles mobilise when the bed shear stress due
to currents or waves exceeds a critical value, with this critical value varying depending on the sediment
properties. Finer sediments in general require less hydrodynamic energy to mobilise and disperse
compared to coarser sands and gravels, but are more prone to processes of flocculation and cohesion
which can also increase the bed shear stress required to remobilise the sediment. Fine sediments
tend to travel as suspended load throughout the water column whereas coarser sands and gravels
tend to travel as bedload. All of these factors that influence sediment transport will further complicate
patterns of sedimentation as the sediment type changes over time.

Finally the re-suspension and deposition of sediment is episodic and therefore a measurement of the
long-term SAR only captures a fraction of the total volume of sediment deposited (Bentley et al.,
2014). During a hydrodynamically calm period sediment is deposited on the seabed and then a
proportion of the sediment is resuspended during a following hydrodynamically active period. The
timescale of this period could be over an ebb/flood cycle, a spring/neap cycle or between wave events
of a given return period. A thorough understanding of the timescales are required to monitor
sedimentation at an appropriate scale.

In general intertidal areas exposed to tidal processes tend to accrete (Friedrichs, 2011; Hunt et al.,
2015); this is due to:

    1. Settling of fine sediment onto the intertidal during slack water at high tide
    2. Transport of coarse sediment in a landward direction due to flood-dominant currents over
       intertidal areas. This can be enhanced in an estuary with a progressive tidal wave.
    3. A spatial gradient of suspended sediment from the channel to the intertidal, which means that
       flood currents bring sediment laden water shoreward. This gradient occurs because the tidal
       currents (and therefore higher bed shear stresses) are stronger in the channel relative to the
       intertidal.

Page 2                                                                                Doc # 4099567
In contrast intertidal areas exposed to wave processes tend to erode (Friedrichs, 2011; Hunt et al.,
2015); this is due to:
1. The inhibition of fine sediment settling onto the intertidal during slack water at high tide due
to wave stirring (wave energy tends to be larger at high tide because of the larger fetch).
2. A spatial gradient of suspended sediment from the intertidal to the channel, which means the
ebbing currents bring sediment-laden water seaward. This gradient occurs due to greater
orbital velocities from waves over the shallower intertidal and therefore higher bed shear
stresses in the intertidal relative to the channel. Although there is a net spatial gradient
between the intertidal and the subtidal the relationship between depth and orbital velocities
from waves is non-monotonic (Fagherazzi et al., 2006) as follows:
a. In water that is very shallow, shorter period waves are dissipated by bottom friction
and orbital velocities from the waves are minimal leading to conditions favouring
deposition.
b. In deep water, orbital velocities are attenuated also leading to conditions favouring
deposition of sediments. Shorter period waves are attenuated more rapidly than
longer period waves meaning that orbital velocities from longer period waves can
influence bed sediments in deeper water than those from shorter period waves.
c. In intermediate water depths, the waves are not dissipated and the orbital velocities
are not attenuated leading to conditions favouring erosion.
The spatial variations in hydrodynamic processes means that some intertidal areas will accrete and
some will erode even in estuaries that are subject to high levels of sediment supply. Therefore the
positioning of plates will influence the SAR recorded.
Doc # 4099567 Page 32 Methodology
2.1 Sediment plate methodology
WRC has been monitoring estuarine intertidal sedimentation using a series of buried sediment plates.
Plates are buried beneath the sediment surface and depth measurements are periodically taken
between the sediment surface and the top of the plate. Changes over time in the thickness of this
measured layer determine the rate at which sediment is accumulating or eroding. The sediment plates
used at all locations are square concrete tiles, measuring 30 x 30 cm with a thickness of 4 cm. The
sediment thickness above each plate is measured by inserted a metal rod (a knitting needle 3.75 mm
by 330mm in length) through the mud until the plate is reached. If the rod encounters hard material
between the sediment surface and the plate (such as shells) the true depth of the sediment may not
be measured correctly. To minimise incorrect measurements, ten rods are used simultaneously to
give replicate measurements. Any large deviations, in the order of cms, can be rapidly identified and
repeated within the same location to check if the measurement is correct. This process also ensures
that the measurements are distributed across the plate to allow for any variations in sediment level
e.g., due to bedforms or bioturbation. The distribution of the replicate measurements over the
surface of the plate is not prescribed but effort is made to distribute the measurements across the
surface of the plate as widely as possible by first finding the edges of the plate and working inwards
towards the centre with the needles. All needles are left in place until all of the replicates are
positioned and this allows a final visual check on the distribution of the measurements.
2.1.1 Firth of Thames
The plate methodology was first developed as part of a WRC student project (Collins, 2003) and
permanent monitoring locations have been established at four REMP sites in the Firth of Thames
(Figure 1). Plates were buried in February 2003 to a depth of ~20 cm and levelled horizontally with a
spirit level along the widths and diagonals of the plate. The plates were buried along a shore-
perpendicular transect (shallow to deep water, Figure 1f) with the REMP site situated at the centre.
A total of six plates were used at each site: three seaward and three landward of the monitored area
(Figures 1b – 1e). The plates are numbered sequentially with plate 1 closest to the land (shallowest
water depth) and plate 6 located at the seaward end of the transect (deepest water depth). Plates
were not buried in the centre of the biological monitoring plot as localised sediment disturbance,
during the collection of sediment and macrobenthic samples, could have potentially influenced
measurements of sediment thickness. The plates extend a total of ~100 m seaward and ~100 m
landward of the biological monitoring plot with a ~50 m gap between each plate (Figures 1b – 1f).
Four location marker pegs were placed around each plate. Sediment depth measurements above
each plate were taken initially at 1-month intervals and the sampling frequency was then dropped to
quarterly in 2009 although there are some inconsistencies around these sampling frequencies. The
inconsistent sample frequency was due to a combination of factors including: changes in staff
availability; the requirement for low spring tides to access the plates; and occasional poor weather
that prevented sampling at scheduled times.
Page 4 Doc # 40995672.1.2 Whaingaroa (Raglan) Harbour
Intertidal sedimentation monitoring was established at five REMP sites in Whaingaroa (Raglan)
Harbour in 2003 (Figure 2). Here sediment plates were installed in a different configuration to that
used in the Firth of Thames (the rationale for change in approach is unclear). Four plates were used
at each sampling site: two plates clustered on the seaward side of the biological monitoring plot and
two plates on the landward side with the exception of Okete Bay which only has a seaward cluster of
plates (Figures 2b – 2g). There is a distance of ~4 m between each plate within a cluster and a distance
of ~100-200 m between each cluster. The two plates in the seaward cluster are named plates A and
B, the two plates in the landward cluster are named plates C and D. Sediment depth measurements
have generally been biannual or quarterly but the sampling frequency has been inconsistent. The
inconsistent sample frequency was due to a combination of factors including: changes in the personnel
used for carrying out the sampling, the requirement for low spring tides to access the plates, and
occasional poor weather that prevented boat access and sampling at scheduled times.
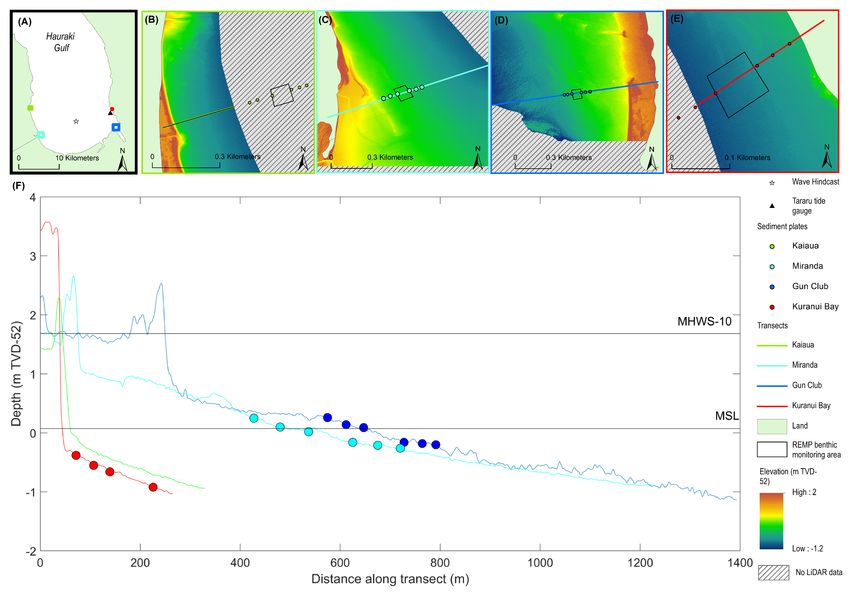
Doc # 4099567 Page 5Figure 1: Locations of the REMP sites, Tararu tide gauge and wave hindcast model in the Firth of Thames.
(A). Detailed locations of the plates, the biological monitoring plot, elevations and transects are shown at Kaiaua (B), Miranda (C), Gun Club (D) and Kuranui Bay (E). Elevations along each cross shore transect are shown for each monitoring plot (F). All
elevation data is from WRC LiDAR collected in 2007/2008.
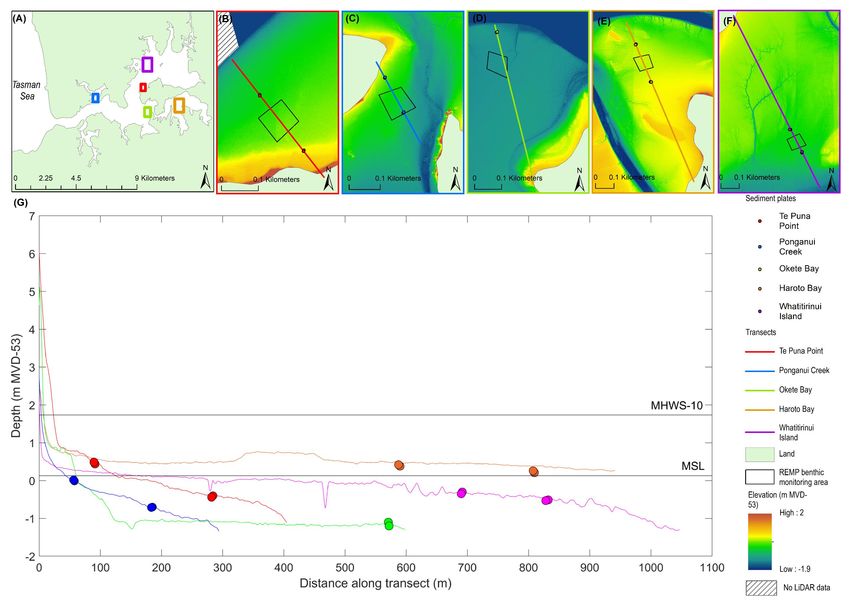
Page 6 Doc # 4099567Figure 2: Locations of the REMP sites in Whaingaroa (Raglan) Harbour. (A). Detailed locations of the plates, the biological monitoring plot, elevations and transects are shown at Te Puna Point (B), Ponganui Creek (C), Okete Bay (D), Haroto Bay (E) and Whatitirinui Island (F). Elevations along each cross shore transect are shown for each monitoring plot (F). All elevation data is from WRC LiDAR collected in 2010. Doc # 4099567 Page 7
2.2   Calculation of sediment accumulation rate
      To calculate sediment accumulation over the entire monitoring period (2003 to 2015) the ten
      replicates were averaged for each plate, for each sampling occasion, and a linear trend was fitted to
      the data. The overall rate of sediment accumulation was calculated in mm/yr from the slope of the
      linear trend line.

2.3   Plate elevation and water depths
      The plates are situated at a range of different intertidal elevations and consequently experience
      differing inundation durations, water depths and hydrodynamic conditions. To assess the variability
      in water depths over the plate sites, the elevation of the intertidal flat above each plate was
      determined from LiDAR and the depth of water was calculated using water level records from the
      Tararu tide gauge for the Firth of Thames (see Figure 1 for location of tide gauge) and the Kawhia tide
      gauge for Whaingaroa (Raglan) Harbour (see Appendix A for details). LiDAR data was not available for
      Kaiaua (Figure 1b) and for plates 5 and 6 at Kuranui Bay (Figure 1e).

2.4   Plate material and condition
      For the plate methodology to be viable, the long-term integrity of the plates is paramount. Plates were
      assessed for degradation and orientation in Whaingaroa (Raglan) Harbour in 2016-17 and the Firth of
      Thames in 2018: in each case the sediment depth above the plate was recorded and then carefully
      uncovered, visually checked for any deterioration of the concrete and a spirit level used to check the
      level. The plate was reburied and the sediment depth measured again. In the Firth of Thames, two
      plates from the Gun Club site and two plates from Miranda site were assessed. At Gun Club, plate 3
      landward and plate 4 seaward of the REMP site were uncovered. Plate 3 had been previously exposed
      due to sediment erosion. At Miranda plate 2 landward and plate 5 seaward of the REMP site were
      assessed. In Whaingaroa (Raglan) Harbour, one plate from each cluster was uncovered at each of the
      5 REMP sites.

      Page 8                                                                              Doc # 4099567
3 Results
3.1 Firth of Thames
Bed levels are summarised for each monitoring site in Figures 3-6 and the SAR, calculated from linear
fit, shown in Table 1. Miranda to the west (Figure 4) and Gun Club to the east (Figure 5) showed similar
behaviour in sedimentation, with erosion occurring at plates landward of the REMP site (shallower,
plates 1-3) and accreting seaward of the REMP site (deeper, plates 4-6, with the exception of Miranda
plate 4). At Kaiaua (Figure 3), which is more seaward than Miranda to the west, a similar rate of
sediment deposition was recorded for all plates (Figure 3 and Table 1). At Kuranui Bay (Figure 6)
accretion was recorded at the most landward plates (plates 1 and 2) and erosion at the seaward plates
(plates 3-6). The relationship between water depth and SAR for Miranda, Gun Club and Kuranui Bay
is shown in Figure 7. This Figure shows that plates at bed levels higher than -0.24 mMSL are eroding
and plates at bed levels lower than -0.24 mMSL and above -0.62 mMSL are accreting. Below – 0.62
mMSL the plates at Kuranui Bay are eroding. Because the Miranda and Gun Club transects span similar
bed elevations it is possible to plot lines of best fit demonstrating that the SAR over the plates at both
Gun Club and Miranda behave similarly at equivalent elevations. Plates at Kuranui Bay are deeper
than those at Miranda and Gun club and show increasing SAR over the shallower plates (plates 1 and
2), increasing erosion rates over the intermediate plates (plates 3 and 4)and then a reduction in
erosion over the two deepest plates (plates 5 and 6). Plates 5 and 6 are not plotted on Figure 7 as the
water was covering these plates during the LIDAR collection. The variation in SAR between the plates
and the overall magnitude of bed change at Kuranui Bay is less than those recorded at Gun Club and
Miranda. If all plate data at each site is aggregated to calculate a single SAR for each transect,
accretion is recorded at Kaiaua and erosion is recorded at Miranda, Gun Club and Kuranui Bay (Table
1).
Inspection found Plate 4 at Gun club and Plate 2 at Miranda to be level and in good condition (Table
2). Plate 5 at Miranda could not be visually inspected due to groundwater but felt level and in good
condition. Plate 3 at Gun Club had been previously exposed due to bed erosion and the plate felt
unevenly orientated. Records show that this plate was uncovered once in 2008 and once in 2009
(vertical dashed lines in Figure 5) which would likely have led to scour and differential settlement of
the plate.
The magnitude of variation in sediment thickness between the replicate sediment depths taken before
uncovering and after burial, a proxy for plate unevenness/tilting, also indicated that Plate 3 at Gun
Club was not level (Table 2). Prior to uncovering, sediment thicknesses varied by 35 mm across the 10
replicates whereas Plate 4 at Gun Club and Plate 2 and Plate 5 at Miranda varied by only 12, 11 and
21 mm. Post burial, after the bedforms had been smoothed the differences in sediment thickness
were even more marked between Plate 3 at Gun Club and the other plates. Sediment thicknesses at
Plate 3 at Gun Club varied by 38 mm whereas Plate 4 at Gun Club and Plates 2 and 5 at Miranda varied
by only 4, 5 and 7 mm respectively.
Doc # 4099567 Page 9Table 1: Summary of SAR (mm/yr) at each plate in the Firth of Thames.
Kaiaua Miranda Gun Club Kuranui Bay
Plate 1 2.34 -11.23 -0.33 1.89
Plate 2 3.50 -10.21 -11.52 0.03
Plate 3 3.38 -6.95 -9.94 -3.04
Plate 4 1.58 -0.92 3.83 -4.67
Plate 5 2.63 1.96 5.59 -2.37
Plate 6 3.19 4.29 4.63 -0.66
All plates 2.75 -3.86 -1.51 -1.70
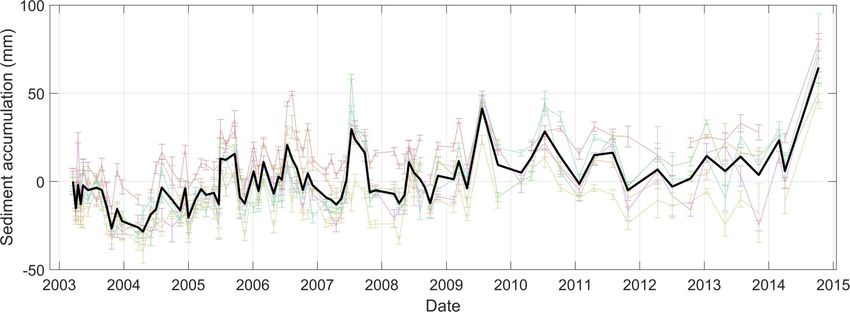
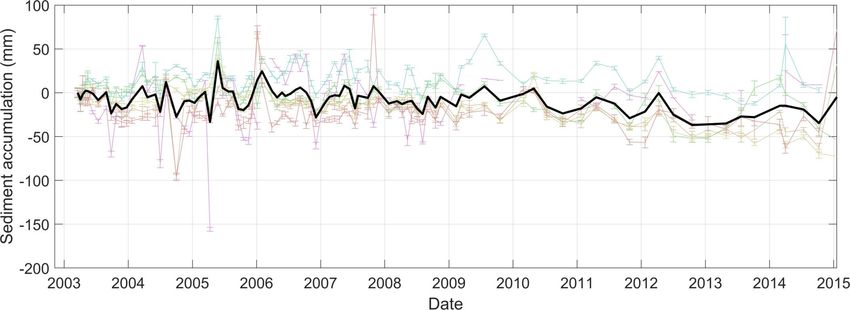
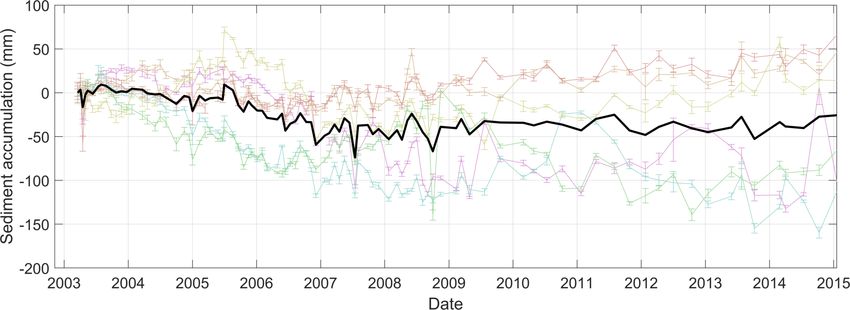
Page 10 Doc # 4099567Figure 3: Sedimentation recorded in the Firth of Thames over the Kaiaua Plates. Averages for the ten replicates at Plate 1 (pink line), Plate 2 (blue line), Plate 3 (green line), Plate 4 (yellow line), Plate 5 (orange line) and Plate 6 (red line) are shown and error bars show the standard deviation around this average. The average of all plates is shown by the thick black line. Plate 1 is landward and Plate 6 is seaward. Doc # 4099567 Page 11
Figure 4: Sedimentation recorded in the Firth of Thames over the Miranda Plates.
Averages for the ten replicates at Plate 1 (pink line), Plate 2 (blue line), Plate 3 (green line), Plate 4 (yellow line), Plate 5 (orange line) and Plate 6 (red line) are shown and
error bars show the standard deviation around this average. The average of all plates is shown by the thick black line. Plate 1 is landward and Plate 6 is seaward.

Page 12                                                                                          Doc # 4099567
Figure 5: Sedimentation recorded in the Firth of Thames over the Gun Club Plates.
Averages for the ten replicates at Plate 1 (pink line), Plate 2 (blue line), Plate 3 (green line), Plate 4 (yellow line), Plate 5 (orange line) and Plate 6 (red line) are shown and
error bars show the standard deviation around this average. The average of all plates is shown by the thick black line. The two periods during which plate 3 was uncovered
at the Gun Club site are shown between the pairs of dashed black lines. Plate 1 is landward and Plate 6 is seaward.

Doc # 4099567                                                                                         Page 13
Figure 6: Sedimentation recorded in the Firth of Thames over the Kuranui Bay Plates.
Averages for the ten replicates at Plate 1 (pink line), Plate 2 (blue line), Plate 3 (green line), Plate 4 (yellow line), Plate 5 (orange line) and Plate 6 (red line) are shown and
error bars show the standard deviation around this average. The average of all plates is shown by the thick black line. Plate 1 is landward and Plate 6 is seaward.

Page 14                                                                                          Doc # 4099567
Figure 7: Seabed level relative to mean sea level and SAR.
Data from the Gun Club (circles), Kuranui Bay (triangles) and Miranda (diamonds). The colour of each symbol
denotes the plate number, Plate 1 (pink symbol), Plate 2 (blue symbol), Plate 3 (green symbol), Plate 4 (yellow
symbol), Plate 5 (orange symbol) and Plate 6 (red symbol). Note that LiDAR data were not available for Plates
5 and 6 at Kuranui Bay and all plates at Kaiaua and these plates are not plotted. The solid black, dashed black
and dotted black lines show fit using linear regression for the Gun Club, Miranda and Kuranui Bay data,
respectively.

Doc # 4099567                                                                                     Page 15
Table 2: Summary of plate condition in the Firth of Thames on the 14/06/2018.
 REMP       Plate ID Photo                                  Maximum variation in sediment thickness over   Notes
 site                                                       10 replicate measurements (mm)
                                                            Before uncovering     After burial
 Gun Club 4                                                 12                    4                        Spirit level showed that plate was level. Plate felt to be in
                                                                                                           good condition but could not be seen due to groundwater.

            3                                             35                     38                        Has been exposed before due to fluctuations in bed level.
                                                                                                           Hard to see the plate due to groundwater but the plate felt
                                                                                                           like it was sloping, the variations in sediment depth
                                                                                                           measurements over the plate seem to confirm this.

 Miranda    2                                             11                     5                         Spirit level showed that plate was level. Plate felt to be in
                                                                                                           good condition but could not be seen due to groundwater.

            5                                             21                     7                         Plate feels level. Too much water to see (no photo taken).
                                                                                                           Does not feel pitted or eroded and is in good condition

Page 16                                                                               Doc # 4099567
3.2 Whaingaroa (Raglan) Harbour
Between 2003 and 2015, monitoring found net sediment accumulation at Haroto Bay (Figure 8 and
Table 3) in the smaller southern sub-estuary, and Okete Bay (Figure 11 and Table 3), and net erosion
at Whatitirinui Island (Figure 9 and Table 3) and Te Puna Point (Figure 10 and Table 3), both in the
larger, northern sub-estuary. Both erosion and accretion have occurred at Ponganui Creek (Figure 12
and Table 3), which is seaward closer to the main entrance, over the monitoring period but the
changes have been small and the seabed elevation is largely stable. Although there was variability
between individual plates, the variability has not been systematic. The relationship between water
depth and SAR shows no clear relationship between different monitoring sites (Figure 13) but clusters
of plates tended to show similar behaviour. If all plate data at each site is aggregated to calculate a
single SAR for each transect, accretion is recorded at Haroto Bay and Okete Bay, erosion is recorded
at Whatitirinui Island and Te Puna Point, and Ponganui Creek can be considered largely stable (Table
3).
Inspection found that plates were intact, level and in good condition (Table 4), although at Haroto Bay
and for Whatitirinui Island, Plate D, full assessments were not possible. However, for these the
condition was checked by feeling for pitting along the top, edges and corners of the plates and all were
in good condition. There was no indication of plates tilting, with relatively small magnitudes of
variation in sediment depth across replicates for individual plates (Table 4). One exception was
recorded for Plate D Whatitirinui Island with a post burial variability of 39 mm. This was likely to be
due to uneven sediment infilling above the plate and will be checked during the next routine
monitoring visit.
Table 3: Summary of SAR (mm/yr) at each plate in Whaingaroa (Raglan) Harbour.
Haroto Bay Whatitirinui Te Puna Point Okete Bay Ponganui Creek
Island
Plate A 1.67 -2.98 -1.64 4.05 0.30
Plate B 0.86 -3.05 -3.56 7.04 1.32
Plate C 2.83 -3.98 -1.01 -0.43
Plate D 2.86 -2.37 -0.73 -1.18
All plates 2.02 -3.14 -1.73 7.36 -0.02
Doc # 4099567 Page 17Figure 8: Sedimentation recorded over the Haroto Bay Plates. Averages for the ten replicates at Plate A (pink line), Plate B (blue line), Plate C (green line) and Plate D (yellow line) are shown and error bars show the standard deviation around the average. The average of all plates is shown by the thick black line. Plates C and D are landward, plates A and B are seaward. Linear accretion rates from the analysis of sediment cores (Swales et al., 2005) are shown as a thick red line. Page 18 Doc # 4099567
Figure 9: Sedimentation recorded over the Whatitirinui Island Plates.
Averages for the ten replicates at Plate A (pink line), Plate B (blue line), Plate C (green line) and Plate D (yellow line) are shown and error bars show the standard deviation
around the average. The average of all plates is shown by the thick black line. Plates C and D are landward, plates A and B are seaward.

Doc # 4099567                                                                                       Page 19
Figure 10: Sedimentation recorded over the Te Puna Point Plates.
Averages for the ten replicates at Plate A (pink line), Plate B (blue line), Plate C (green line) and Plate D (yellow line) are shown and error bars show the standard deviation
around the average. The average of all plates is shown by the thick black line. Plates C and D are landward, plates A and B are seaward.

Page 20                                                                                      Doc # 4099567
Figure 11: Sedimentation recorded over the Okete Bay Plates.
Averages for the ten replicates at Plate A (pink line) and Plate B (blue line) are shown and error bars show the standard deviation around the average. The average of all
plates is shown by the thick black line. Plates A and B are seaward of the benthic monitoring plot. Linear accretion rates from the analysis of sediment cores (Swales et al.,
2005) are shown as a thick red line.

Doc # 4099567                                                                                     Page 21
Figure 12: Sedimentation recorded over the Ponganui Creek Plates.
Averages for the ten replicates at Plate A (pink line), Plate B (blue line), Plate C (green line) and Plate D (yellow line) are shown and error bars show the standard deviation
around the average. The average of all plates is shown by the thick black line. Plates C and D are landward, plates A and B are seaward.

Page 22                                                                                      Doc # 4099567
Figure 13: Seabed depth relative to mean sea level and associated SAR.
Data from the Haroto Bay site (southern arm) are shown as circles, Okete Bay is shown as triangles, Te Puna
Point (northern arm) is shown as diamonds, Whatitirinui Island (northern arm) is shown as stars and Ponganui
Creek is shown as squares. The colour of each symbol denotes the plate number, Plate A (pink symbol), Plate B
(blue symbol), Plate C (green symbol) and Plate D (yellow symbol).

Doc # 4099567                                                                                  Page 23
Table 4: Summary of plate condition in Whaingaroa (Raglan) Harbour on the 31/08/2016 (Haroto Bay and Te Puna Point) and 10/04/2017 (Whatitirinui Island, Ponganui
         Creek and Okete Bay).
 REMP site           Plate ID    Photo                              Maximum variation in sediment thickness over Notes
                                                                    10 replicate measurements (mm)
                                                                    Before uncovering      After burial
 Haroto         Bay B                                               7                      4                     No photo and level could not be checked due to
 (Waitetuna arm)                                                                                                 groundwater.

                                                                                                                  Plate not visible but felt in good condition.
                    C                                               6                      11                     No photo due to groundwater.

                                                                                                                  It was noted that the plate felt uneven but this
                                                                                                                  could not be assessed due to groundwater.

                                                                                                                  Plate not visible but felt in good condition.
 Te Puna Point      A                                               17                     17                     Plate was level and in good condition.
 (Waingaro arm)

Page 24                                                                              Doc # 4099567
C 6 12 Plate was almost level and in good condition
Whatitirinui B 8 9 Plate is level and in good condition
Island
(Waingaro arm)
D 8 39 No photo due to groundwater.
Plate not visible but felt in good condition
Ponganui Creek A 7 8 Plate is level and in good condition
Doc # 4099567 Page 25C 12 7 Plate is level and in good condition
Okete Bay A 10 13 Spirit level showed that plate is not level, the plate
is in good condition.
Page 26 Doc # 40995674 Discussion
4.1 Sedimentation trends
4.1.1 Firth of Thames
The distinction in patterns of sedimentation across the transects at Kuranui Bay (Figure 6) and Kaiaua
(Figure 3) relative to the similar patterns of sedimentation at the southern Firth of Thames sites
(Figures 4 and 5) (i.e. Miranda and Gun Club) can be attributed to site specific changes in elevation or
due to other differences in the morphological and hydrodynamic environment. As the range of plate
elevations at the southern Firth of Thames sites and Kuranui Bay sites are different and do not overlap
(Figure 7), it is impossible to establish if similar sedimentation patterns at similar depths would occur
at the southern Firth of Thames sites and the Kuranui Bay sites. The intertidal elevation at Kaiaua are
not known but the LiDAR survey, the extent of which ends landward of plate 1 (Figure 1b), suggests
that the plates are lower than all the other sites. This lower elevation is confirmed by technical staff
at WRC who are only able to access this site at tides predicted at 0.4 m LAT.
Other studies have measured sedimentation within the mangrove forest (Swales et al., 2019) and
adjacent intertidal flat (Zeldis et al., 2015) in the southern part of the Firth of Thames situated between
the Gun Club and Miranda sites. Measurements of sediment accumulation over buried tiles in the
mangrove forest show contemporary SAR of ~13 – 47 mm/yr between 2009 and 2016 with SAR
increasing towards the seaward fringe of the mangroves. Analysis of 210PB within sediment cores show
SAR ranging between 26 – 43 mm/yr between c. 1990 – 2006. The SAR over the intertidal areas are
again greatest adjacent to the seaward edge of the mangrove forest and reduce to a constant level
averaging ~26 mm/yr in the area 600 – 1000 m from the seaward edge of the mangrove forest in 2006.
The lower SAR presented here indicate that the large SAR recorded in the mangrove forest (Swales et
al., 2019) and over the adjacent intertidal flats (Zeldis et al., 2015) in the southern Firth of Thames are
atypical and represent a preferential sink for fine sediment. It is possible that the sink of sediment in
the southern Firth of Thames removes large proportions of fine sediment from the Firth and therefore
helps prevent sedimentation elsewhere. Given the large SAR identified in the southern Firth of
Thames (Swales et al., 2019; Zeldis et al., 2015) the relatively low rates of accretion and / or erosion
identified here are unexpected, this section discusses the possible reasons for the observed spatial
patterns of sedimentation over the plate sites.
The Firth of Thames is a mesotidal system (Dyer, 1997) with a mean spring tidal range of 3.3 m and a
mean neap tidal range of 2.1 m (LINZ, 2017a). The patterns of sediment erosion in the upper intertidal
over the southern Firth of Thames sites do not reflect a typical tidally dominated environment where
deposition and accretion might be expected over the shallower intertidal areas. Instead the
relationship between increasing water depth and sediment accumulation is indicative of a wave
dominated environment where the intertidal is responding to the differing influence of wave
attenuation or dissipation has on bed sediment transport with changing water depths (Fagherazzi et
al., 2006, 2007; Mariotti and Fagherazzi, 2013a, 2013b; Hunt et al., 2015, 2016, 2017). The sediment
erosion over the upper intertidal areas may also be indicative of the intertidal flat tending towards a
Doc # 4099567 Page 27concave-up wave dominated shape along the cross-shore profile (Friedrichs and Aubrey, 1996; Bearman et al., 2010; Friedrichs, 2011; Zhou et al, 2015; Hunt et al., 2015, 2016). This concave-up cross-shore profile is a theoretical equilibrium intertidal shape that occurs when the spatial distribution of bed shear stresses due to waves and therefore suspended sediment concentrations, are in equilibrium across the intertidal profile resulting in no net transport of suspended sediment (Friedrichs and Aubrey, 1996). Good quality long-term wave records are not available for the Firth of Thames. The tide gauge at Tararu was setup with the intention of recording wave conditions but previous analysis of the data to estimate wave heights highlighted concerns over the quality of the wave record (NIWA, 2015). It is possible that the shape of the structure, on which the tide gauge is situated, interferes with the propagation of waves and is not suitable for wave collection. Furthermore the instrument and sampling schedule is not optimised for collecting wave data and therefore the dataset requires validation with an independent instrument. This structure needs to be replaced within the next few years and this could offer an opportunity to optimise the instrumentation and structure for wave data collection. To provide a comparison dataset and to help further characterise the wave climate within the Firth of Thames a wave sensor is being deployed by WRC in 2019 as part of the Firth of Thames water quality buoy. In the absence of wave data, modelled hindcast wave data can be used to infer the wave climate in the Firth. Hindcast information from MetOcean View (https://metoceanview.com/) extracted at the centre of the study area (see Figure 1 for hindcast model location) at a water depth of ~4m below LAT (LINZ, 2017b) indicates that the most common waves have a small peak period (Tp) with waves between 2 and 4 s accounting for 43.5% of the hindcast record (Figures 14 and 15). These small period waves are associated with small waves with significant wave heights (Hs) ranging between 0 and 1 m (Figure 14). Most waves have a Tp of 2–3 s (Figure 15) and an Hs of between 0–0.5 m accounting for 25% of the record alone (Figure 16). The small short period waves come from a variety of directions but the majority of waves come from the north (Figures 15 and 16). The total amount of waves from the northerly sector amounts to 71% of the total record with waves between 2 and 4 s from the north accounting for 21.4% of the total record (Figure 16). Wind conditions measured at the Tararu tide gauge between 2003-2015 (see Figure 1 for location of tide gauge) show that the most common wind speeds range between 0 and 10 m/s and account for 93% of the record (Figure 17). The majority of winds have speeds of less than 6 m/s accounting for 70% of the record (Figure 17). The most common wind direction is from the north (345 - 15˚) accounting for 15.5% of the record and the north- northwest (315 - 345˚) accounting for 13.4% of the record (Figure 17). Within these common directions, the most frequent wind speeds are in the 0 – 6 m/s bin (18.5% of the record) and the 6 – 10 m/s bin (8.2% of the record) (Figure 17). Wind from these directions have a maximum fetch of ~100 km terminating at the area around Little Barrier and Great Barrier Islands. When the wind is blowing from the edges of these northerly sectors (345˚ and 15˚) the fetch is shorter and measures ~25 km. Overall, the wind record and wave hindcast data indicate that the sites in the Firth of Thames are exposed to both occasional long-period waves that propagate into the Firth and more common shorter period waves that are generated along the large fetch coincident with the prevailing northerly wind direction. The sedimentation record at Miranda and Gun Club is indicative of a typical short Page 28 Doc # 4099567
wave period dominated sedimentation pattern with accretion over the deeper plates and erosion over
the shallower plates and therefore also a possible increase in concavity of the intertidal profile. The
initiation of erosion could potentially arise from changes in forcing conditions such as a reduction in
sediment supply relative to wave forcing or a change in the wave climate. A further possibility is that
the erosion is part of a cyclical feedback between intertidal height and hydrodynamics whereby
intertidal levels accrete to a level where orbital velocities from waves can begin to erode the intertidal.
There is not enough evidence to confirm either of these hypothesises and will be the subject of
ongoing investigations and further monitoring.

Doc # 4099567                                                                                Page 29
Figure 14: Distribution of wave events from the MetOcean View hindcast model plotted as the percentage
           occurrence of Tp and Hs (see Figure 1 for hindcast model location).

Figure 15. Wave rose showing distribution of wave events from the MetOcean View hindcast model plotted
as the percentage occurrence of Hs and the associated wave direction
The data was extracted at 37.148S 175.426E (see Figure 1 for hindcast model location).

Page 30                                                                              Doc # 4099567
Figure 16: Wave rose showing distribution of wave events from the MetOcean View hindcast model plotted as the percentage occurrence of Tp and the associated wave direction. The data was extracted at 37.148S 175.426E (see Figure 1 for hindcast model location). Figure 17: Wind rose summarising the wind record at Tararu tide gauge between 1st January 2003 and 1st January 2015 (see Figure 1 for tide gauge location. Doc # 4099567 Page 31
To test the hypothesis that waves are driving patterns of erosion and accretion across the intertidal
profiles at each site, a simple model was written in Matlab to calculate the typical bed shear stress
from locally generated short period waves (τw) for different water depths, wind speeds and fetch
lengths using empirical equations (e.g. Hunt et al., 2017; see Appendix B for details of model setup).
The model was run with wind scenarios ranging between 0 and 6 m/s. These wind speeds were run
over a fetch lengths of 100 km representing the maximum available fetch and 25 km representing a
smaller cross basin fetch and water depths ranging between 0 and 20 m (Figure 18).

With a fetch length of 100 km and using the same depth as at the location of the hindcast model point
(~7.8 m at Mean High Water Springs (MHWS) (LINZ, 2017a)) the Tp predicted by the model ranged
between 0 and 3.4 s and Hs ranged between 0 and 0.7 m. With a fetch length of 25 km and the same
water depth the Tp predicted by the model ranged between 0 and 2.7 s and Hs ranged between 0 and
0.46 m. These modelled Hs and Tp comprise 61% and 51 % of the hindcast wave model record and
therefore represent the envelope of most common wave types and indicate that the model is
replicating the relevant wave climate at a simple monochromatic level.

To assess the likelihood of sediment erosion or accretion the modelled values of τw can be compared
to the critical bed shear stress (τcrit) required to initiate sediment movement. The range of potential
τcrit are calculated based on sediment characteristics at each site (see Appendix B for details) and are
plotted as horizontal black lines on Figure 18 showing an upper, average and lower τcrit. When τw > τcrit
then erosion is likely, when τw < τcrit then accretion is likely. To show how these modelled patterns of
τw relative to τcrit relate to measured trends of sedimentation or accretion each tile has been plotted
relative to its depth at MHWS (see Appendix A for calculation of water levels) and the measured SAR
(Table 1) at each plate over the entire monitoring record (Figure 18). The model indicates that for a
fetch of 100 km, waves generated by a wind speed of ~4 m/s cause erosion of sediment over the upper
(shallower) plates and accretion of sediment over the lower (deeper) plates consistent with the
monitoring data (Figure 18) at Miranda and Gun Club. For a smaller fetch of 25 km a slightly larger
wind speed of ~ 5 m/s is required to initiate a similar pattern of erosion and accretion (Figure 18) at
Miranda and Gun Club. Erosion rates are greater over the shallower plates and this is likely to be due
to the non-monotonic shape of the τw curves which peak in shallower water depths (Figure 18). In
addition the sediment overlying the upper (shallow) plates only requires small waves and
consequently low wind speeds (> ~ 3m/s) to erode and these smaller wind speeds are slightly more
common than higher wind speeds (Figure 17) so these wave events would occur more often. Wind
speeds greater than the thresholds of ~4 m/s and 5 m/s will cause erosion of the sediment over the
lower (deeper) plates, the greater the wind speed the more lower (deeper) plates experience erosion
(Figure 18). This occasional erosion due to larger wind speeds will account for the periodic erosion of
sediment identified in the monitoring record and the relatively small rates of net accretion over the
lower (deeper) plates at Gun Club and Miranda (Figures 4 and 5).

The model results (Figure 18) indicate that the increased erosion with depth at Kuranui Bay does not
fit the expected patterns of erosion and accretion from short period locally generated waves and
therefore it is probable that different hydrodynamic processes are driving the sedimentation patterns
observed at Kuranui Bay compared to Gun Club and Miranda. Importantly this distinction between
the processes driving sedimentation at Kuranui Bay compared to Gun Club and Miranda means that
the patterns of sedimentation shown in Figure 7 should not be grouped and viewed across a constant

Page 32                                                                               Doc # 4099567
depth continuum. Instead Kuranui Bay should be treated as a separate hydrodynamic and
sedimentary environment subject to different physical processes to those experienced at Gun Club
and Miranda.

It is important to emphasise that this model is only a basic representation of the hydrodynamic
environment. The model has not been calibrated or validated and the modelled magnitude τw is
extremely sensitive to the calculations used, the chosen boundary conditions and the assumptions
made during its formulation (see Appendix B for details of modelling assumptions and approach).
Furthermore, the sediment plate depths are plotted at a static water level at MHWS (see Appendix A
for water level definition), in reality the modelled magnitude of τw at each plate will change greatly
during the tidal cycle due to the changing water depths as the tide ebbs and floods and switches
between spring and neap states. These changes in water levels will complicate the processes of
erosion and accretion considerably especially considering that the fetch in the Firth of Thames will be
long, and therefore the wave climate could be well-developed, even at low water. This is in contrast
to an estuary like Raglan when the fetch varies greatly during a tidal cycle (Hunt et al., 2015; 2016)
and between spring and neap tides (Hunt et al., 2016; 2017). Further data collection is required to
reduce these critical assumptions. Overall the model results support the interpretation that waves
drive patterns of sedimentation over Gun Club and Miranda but not at Kuranui Bay but further data
needs to be collected to support this hypothesis.

The reason for erosion at greater water depths at Kuranui Bay is not known but further investigation
is underway to investigate the physical processes driving these distinct patterns of bed change. It is
possible that the patterns of erosion in deeper water at Kuranui Bay could be in response to occasional
long period waves that propagate into the study area from the Pacific Ocean. It is also possible that
Kuaraui Bay is exposed to strong tidal currents, subject to tidal asymmetry, alongshore wave driven
transport or wind driven estuarine circulation all of which could prevent sediment accumulation.
Published hydrodynamic modelling results and data within the Firth of Thames (Proctor and Greig,
1989; Black et al., 2000) indicate that residual tidal circulation is weak and does not appear to be
orientated in a systematic direction (Proctor and Greig, 1989) that could explain the observed erosion
at Kuranui Bay. It has been hypothesised that as tidal currents would deflect to the left in the Firth of
Thames, flood tides would be stronger along the eastern side of the Firth and ebb tides would be
stronger along the western side of the Firth creating a clockwise tidal circulation pattern (Zeldis et al.,
2015). This clockwise pattern of circulation could feasibly supply oceanic water with low suspended
sediment concentrations to the eastern side of the Firth (i.e. Kuranui Bay) during the flooding tide and
estuarine water with higher concentrations of suspended sediment to the western side of the Firth
(i.e. Kaiaua) during the ebbing tide but there is no known published evidence to support this
hypothesised clockwise tidal circulation.

Modelling studies indicate that both the residual circulation (Proctor and Greig, 1989) and patterns of
sediment deposition (Zeldis et al., 2015) are modified by wind. Modelled wind speeds of 15 m/s from
the northeast could feasibly enhance a clockwise residual rotation within the Firth of Thames (Proctor
and Grieg, 1989) although these wind conditions appear to be rare (Figure 17). Instead, wind records
at Tararu show that the prevailing wind directions during the sediment plate monitoring are from the
north, the northwest and the southeast. Under modelled southeasterly winds of 15 m/s residual
currents are strengthened towards the western side of the Firth and are therefore consistent with the

Doc # 4099567                                                                                Page 33
deposition patterns recorded in the plate data over Kaiaua (Proctor and Greig, 1989). Under modelled
northwesterly winds of 15 m/s residuals are enhanced in a direction away from the western side of
the Firth of Thames (i.e. Kaiaua) and towards the south but importantly residual currents under both
the prevailing southeasterly and northwesterly winds are not enhanced in a direction towards the
eastern side of the Firth of Thames (i.e. Kuranui Bay) (Proctor and Greig, 1989; Black et al., 2000).
These modelled patterns of wind enhanced residual currents indicate that under prevailing wind
conditions circulation is not directed towards the western side of the Firth of Thames and the Kuranui
Bay site and therefore these circulation patterns could contribute to the observed erosion along much
of the plates at Kuranui Bay. Overall the published modelled data in the Firth of Thames offers limited
insight into the measured patterns of sedimentation and erosion at the plate sites due to the limited
hydrodynamic data collected and the limited wind speed and direction scenarios modelled.
Furthermore, wind scenarios of 15 m/s and greater are uncommon amounting to < ~ 0.5 % of the wind
record and therefore do not represent the diversity of actual wind scenarios experienced in the Firth
of Thames (Figure 17).

Any sedimentation trends are further complicated by the overall subsidence of the Firth of Thames
basin. Measurements of subsidence at the Tararu tide gauge and within the Mangrove forest along
the southern margin of the Firth by WRC, NIWA and the University of Otago (Swales et al., 2016) have
shown evidence of deep subsidence within the Firth of Thames basin. Within the Mangrove forest,
subsidence ranges between 7.7 ± 0.5 to 9.4 ± 0.5 mm/yr and at the Tararu tide gauge subsidence rates
of 3.6 ± 0.7 mm/yr were measured. These rates of subsidence were attributed mainly to sediment
compaction with a smaller contribution from vertical land movement (Swales et al., 2016). Based on
these subsidence measurements the Firth could have potentially sunk by between 58 and 150 mm
between 2000 and 2016. A drop in bed height would increase water depths which in turn attenuates
orbital velocities and increases sediment accommodation space. In general subsidence of the basin
and increases in water depth should increase SAR but the effects are likely to be more complex and
should become more apparent with further monitoring.

Based on the available data, it appears that the similar patterns of erosion in shallower water depths
and accretion over deeper water depths at Gun Club and Miranda are controlled by the relative
strength of orbital velocities from locally generated short period waves. Similarly the trend of
deposition at the deeper Kaiaua site is likely due to attenuation of orbital velocities in deep water,
although the actual depth of this site is not known. In contrast the trend of erosion over the deeper
(relative to Miranda and Gun Club) Kuranui Bay sites could be a result of weak tidal and wind driven
circulation patterns and therefore a reduced supply of fine sediment to this area but processes at the
Kuranui Bay site are poorly understood. Deployment of the plates over a similar range of water depths
at each site would have made comparison of the datasets simpler and further reduced uncertainty
regarding the processes controlling sedimentation at each site. Further targeted hydrodynamic data
collection will help understand basic patterns of circulation and wave distribution in the Firth of
Thames.

Page 34                                                                             Doc # 4099567
You can also read