Relationships of cochlear coiling shape and hearing frequencies in cetaceans, and the occurrence of infrasonic hearing in Miocene Mysticeti ...
←
→
Page content transcription
If your browser does not render page correctly, please read the page content below
Foss. Rec., 21, 33–45, 2018
https://doi.org/10.5194/fr-21-33-2018
© Author(s) 2018. This work is distributed under
the Creative Commons Attribution 4.0 License.

Relationships of cochlear coiling shape and hearing
frequencies in cetaceans, and the occurrence of infrasonic
hearing in Miocene Mysticeti
Indira S. Ritsche1 , Julia M. Fahlke1 , Frank Wieder2 , André Hilger3 , Ingo Manke3 , and Oliver Hampe1
1 Museum  für Naturkunde – Leibniz-Institut für Evolutions- und Biodiversitätsforschung, Invalidenstraße 43,
10115 Berlin, Germany
2 Bundesanstalt für Materialforschung und -prüfung, Unter den Eichen 44–46, 12203 Berlin, Germany
3 Helmholtz-Zentrum Berlin für Materialien und Energie GmbH, Hahn-Meitner-Platz 1, 14109 Berlin, Germany

Correspondence: Indira S. Ritsche (indira.ritsche@mfn-berlin.de)

Received: 26 October 2017 – Revised: 22 November 2017 – Accepted: 23 November 2017 – Published: 16 January 2018

Abstract. Baleen whales (Mysticeti) are known to use              middle ear, where it is amplified by the ossicles and further
low frequencies (LF; 200 Hz and below) and infrasound             transmitted into the liquid-filled inner ear at the oval win-
(< 20 Hz) for communication. The lowest hearing limits of         dow (e.g., Fleischer, 1973). Inside the cochlea sound waves
toothed whales (Odontoceti), which are able to produce ultra-     propagate towards the apex via displacement of the basilar
sound (> 20 kHz), reach low frequencies. Researchers have         membrane, thereby stimulating the hair cells responsible for
tried to understand the evolution of LF and infrasonic hear-      the conduction of the acoustic signal to the nervous system.
ing in mysticetes by linking the shape of the inner ear cochlea   Low-frequency sound travels further up towards the apex
or individual cochlear measurements to known hearing fre-         than high-frequency sound, the latter of which is mostly de-
quencies and making inferences to extinct species. Using          tected along the basal region of the membrane, enhanced by
landmark-based shape analysis of complete cochlear coil-          the so-called “whispering gallery effect”, due to a redistribu-
ing, we show that cochlear coiling shape correlates with          tion of wave energy toward the outer cochlear wall (Manous-
LF and high-frequency (HF; > 10 kHz) hearing limits in            saki et al., 2006, 2008). Throughout the paper we use the
cetaceans. Very LF ( ≤ 50 Hz) and infrasonic hearing are as-      following definitions based on human hearing: ultrasound
sociated with, for example, a protruding second turn, a de-       is above 20 kHz, the term “audible range” refers to the hu-
scending apex, and a high number of turns. Correlations be-       man audible range between 20 kHz and 20 Hz, frequencies
tween cochlear and cranial variables and cochlear and cranial     of 200 Hz and below are called low frequencies (LF), and in-
shape indicate that low LF hearing limits are furthermore         frasound is below 20 Hz (e.g., Møller and Pedersen, 2004). In
connected to longer cochleae and relatively larger cranial        this paper, we additionally use the term “very low frequen-
widths. Very LF hearing in Mysticeti appeared in the middle       cies” for hearing frequencies of 50 Hz and below within the
Miocene, and mysticete infrasonic hearing had evolved by          audible range. Following Heffner and Heffner (2008), fre-
the late Miocene. Complete cochlear coiling is suitable for       quencies above 10 kHz are defined as high-frequency hear-
estimating hearing limits in cetaceans, closely approximated      ing.
by cochlear length times number of cochlear turns.                   The cetacean ear is specialized in hearing underwater
                                                                  (Fleischer, 1978; Nummela et al., 2004, 2007). The biggest
                                                                  challenge is to solve the problem of the almost identical
                                                                  impedance of water and of soft tissues (muscles, fat, etc.),
1   Introduction                                                  which hampers the ability of directional hearing. Thus, the
                                                                  ears of aquatic mammals are acoustically isolated from the
In mammalian hearing, sound is usually transmitted by vi-         skull due to decoupling of the ear from the skull as seen in
bration of the eardrum or bone conduction into the air-filled     dolphins, or evolving voluminous and heavy tympanic and

Published by Copernicus Publications on behalf of the Museum für Naturkunde Berlin.
34 I. S. Ritsche et al.: Relationships of cochlear coiling shape and hearing frequencies
periotic bones as seen in baleen whales (Fleischer, 1978; Ket- cetaceans, and particularly to make inferences regarding the
ten, 1992; Nummela et al., 2004). The external auditory mea- occurrence of very LF and infrasonic hearing in Mysticeti,
tus is practically functionless in cetaceans. In odontocetes, a including extinct taxa. The background for this is the theory
high-frequency waterborne sound is transmitted through the that the snail or spiral shape of the cochlea contributes to an
lower jaw via a fat pad to the tympanic plate and then through improved perception of low frequencies (Manoussaki et al.,
the ossicular chain to the oval window (Nummela et al., 2006, 2008).
2007). The sound perception pathway in mysticetes remains
unknown, but several mechanisms have been presumed by
different hearing models, such as the fatty sound reception 2 Materials and methods
pathway in minke whales (Balaenoptera acutorostrata; Yam-
ato et al., 2012), a skull-vibration-enabled bone conduction 2.1 Specimens
mechanism in fin whales (Balaenoptera physalus; Cranford
Periotic bones used in this study include the cochleae of three
and Krysl, 2015), or a sound pathway via the glove finger and
extant Odontoceti, and 5 extant and 33 extinct Mysticeti.
via the thin region of tympanic bone for lower and higher fre-
All specimens, including geochronological information, are
quencies, respectively, in minke whales (Tubelli et al., 2012).
listed in Table 1.
While odontocetes use ultrasound for orientation and com-
munication, sound production data imply that mysticetes pri- 2.2 Institutional abbreviations
marily use low frequencies, and it is likely that several baleen
species hear well at infrasonic frequencies (Ketten, 1992, ChM: The Charleston Museum, Charleston, SC, USA;
1994; Wartzok and Ketten, 1999). There are contrasting hy- CN: Statens Naturhistoriske Museum/Zoologisk Museum,
potheses on the evolution of LF hearing: either dominant Copenhagen, Denmark; IRSNB: Institut Royal des Sci-
LF sensitivity (e.g., Fleischer, 1976a; Nummela et al., 2004; ences Naturelles de Belgique, Brussels, Belgium; MB.Ma.:
Uhen, 2004; Ekdale and Racicot, 2015; Park et al., 2017) Museum für Naturkunde Berlin, fossil mammal collection,
or dominant HF sensitivity (e.g., Ketten, 1992; Fahlke et al., Berlin, Germany; NEOMED: Northeast Ohio Medical
2011; Churchill et al., 2016) was the ancestral state for all University, Rootstown, OH, USA; NMR: Natuur Museum,
Neoceti (Mysticeti and Odontoceti), implying that LF and Rotterdam, the Netherlands; MNHN: Muséum National
infrasonic hearing in Mysticeti is either due to retaining (and d’Histoire Naturelle, Paris, France; SBMB: Stiftung
improving) the ancestral condition or due to a reduction in Bachmann-Museum Bremervörde, Germany; USNM:
HF sensitivity. United States National Museum of Natural History, Wash-
A relationship between the hearing range of an animal and ington, D.C., USA; ZMB_MAM: Museum für Naturkunde
the properties of its cochleae might seem obvious, based on Berlin, extant mammal collection, Berlin, Germany.
the dependence of sound propagation on cochlear anatomy
(e.g., West, 1985; Vater et al., 2004). Various methods have 2.3 Scanning and visualization
been applied to test such a relationship, using either indi-
vidual variables, and products thereof, such as number of Cochlear parts of cetacean inner ears were micro-CT-
turns and basilar membrane length (West, 1985), the ratio scanned using a locally developed industrial scanner at
of the radii of the basal and apical turns (Manoussaki et al., the Helmholtz-Zentrum Berlin für Materialien und Energie
2008), or cochlear shape (Wannaprasert and Jeffery, 2015). GmbH, Germany (part of the CONRAD facility; Kard-
However, these methods have either been used in incompa- jilov et al., 2016). Isometric voxel length varied between
rable ways, e.g., radii ratio measured from the modiolar axis 0.023 mm (humpback whale, Megaptera novaeangliae fetus)
(Chadwick et al., 2006; Ekdale and Racicot, 2015; Ketten and 0.045 mm (blue whale, Balaenoptera musculus).
et al., 2016) or using individual spiral centers for each mea- Reconstruction of the cochleae in three dimensions (3-D)
surement of basal and apical turn (Manoussaki et al., 2008), was performed in Octopus 8 (Inside Matters), and VGStudio
or they have been applied to a variety of mammals, mainly MAX 2.2 was used for visualization (Fig. 1a). In order to
including hearing generalists (Manoussaki et al., 2008; Wan- trace the basilar membrane, the primary and secondary bony
naprasert and Jeffery, 2015), not shedding much light on laminae (Fig. 1b) were used as osteological correlates. Where
hearing in cetaceans in particular. Also, Ketten (1992) and the secondary bony lamina was missing, the point on the
Ketten et al. (2016) used basilar membrane width and thick- outer cochlear wall exactly opposite the primary bony lamina
ness as correlates for LF sensitivity in whales. However, soft was used instead. The center positions between the two lam-
tissue is not preserved in fossil cochleae, and osteological inae were marked in all turns of the cochlea in 90 sections
features that indicate the extent of the basilar membrane, across the modiolus (Fig. 1b; 180◦ in 2◦ increments) using
such as the secondary bony lamina, are very delicate and do a function programmed in IDL 8.5. Attention was paid to
not preserve well (Ekdale and Racicot, 2015). capturing the complete length of the basilar membrane from
The aim of this study is to test relationships of cochlear the round window to the apex of the cochlea. All included
coiling shape with the frequency ranges presumably heard by specimens feature intact apices and basal turns. Marks were
Foss. Rec., 21, 33–45, 2018 www.foss-rec.net/21/33/2018/I. S. Ritsche et al.: Relationships of cochlear coiling shape and hearing frequencies 35
Table 1. Specimens included in the study, cochlear length, number of cochlear turns, radii ratio, and skull length. Skull length is condylo-
basal length measured from cranial models used by Fahlke and Hampe (2015). For family attribution and relationships, see Steeman (2007,
2010), Boessenecker and Fordyce (2015), and Marx et al. (2016).
ID Group/species Family Time Cochlear Number Radii Skull Specimen
length (mm) of turns ratio length (mm) number
ODONTOCETI
2 Delphinapterus leucas Monodontidae Recent 47.32 1.9 4.09 577 NEOMED no number
26 Physeter macrocephalus Physeteridae Recent 60.27 1.7 5.73 ZMB_MAM_45194
30 Tursiops truncatus Delphinidae Recent 34.81 1.7 4.53 509 ZMB_MAM_27159
MYSTICETI
0 Balaena mysticetus Balaenidae Recent 62.78 2.4 6.24 2650 CN38
4 Balaenoptera acutorostrata Balaenopteridae Recent 54.35 2.2 6.65 1600 NMR 9990-03410
15 Balaenoptera acutorostrata Balaenopteridae Recent 55.40 2.2 6.75 1600 CN no number
3 Balaenoptera musculus Balaenopteridae Recent 83.23 2.4 5.62 5748 CN11x
13 Megaptera novaeangliae (fetus) Balaenopteridae Recent 61.37 2 6.46 CN14
40 Balaena primigenia Balaenidae Pliocene 61.34 2.1 5.89 IRSNB M 887
1 Balaenidae indet. Balaenidae Pliocene 57.15 2.2 5.61 IRSNB Vert-33312-02
39 Balaenoptera rostratella Balaenopteridae Pliocene 54.14 2.1 5.12 IRSNB M 794
6 Eschrichtiidae indet. Eschrichtiidae Pliocene 96.88 2.7 5.60 IRSNB Vert-33312-01
25 Herpetocetus transatlanticus Cetotheriidae Pliocene 42.64 2.6 6.82 IRSNB Vert-33178-02
17 Aglaocetidae indet. Aglaocetidae late Miocene 45.78 2.6 6.23 MB.Ma. 51614
38 Aglaocetus latifrons Aglaocetidae late Miocene 41.75 2.7 6.70 IRSNB M 567 f
18 Aglaocetus sp. Aglaocetidae late Miocene 41.91 2.7 6.55 MB.Ma. 51615
16 Aglaocetus patulus Aglaocetidae late Miocene 44.10 2.8 6.06 1601 MB.Ma. 51613
24 Aglaocetus patulus Aglaocetidae late Miocene 41.98 2.7 6.14 1601 MB.Ma. 51622
10 Amphicetus later Diorocetidae late Miocene 44.35 2.7 6.98 IRSNB M 622
35 Amphicetus later Diorocetidae late Miocene 47.26 2.4 4.91 IRSNB M 575
19 Diorocetidae indet. Diorocetidae late Miocene 42.83 2.7 6.17 MB.Ma. 51616
20 Diorocetidae indet. Diorocetidae late Miocene 48.66 2.7 6.74 MB.Ma. 51618
21 Diorocetidae indet. Diorocetidae late Miocene 50.13 3 6.04 MB.Ma. 51619
23 Diorocetidae indet. Diorocetidae late Miocene 49.06 2.8 6.59 MB.Ma. 51621
37 Diorocetidae indet. Diorocetidae late Miocene 45.74 2.7 6.04 MB.Ma. 51623
22 Diorocetus sp. Diorocetidae late Miocene 47.21 2.8 6.56 MB.Ma. 51620
31 Megaptera miocaena Balaenopteridae late Miocene 55.40 2.6 7.30 USNM 10300
12 Megapteropsis robusta Balaenopteridae late Miocene 82.23 2.6 6.46 IRSNB M 809 a
9 Parietobalaena affinis Pelocetidae late Miocene 41.27 2.5 6.68 IRSNB M 605 b
27 Piscobalaena nana Cetotheriidae late Miocene 45.07 2.6 6.35 1064 MNHN PPI259
29 Piscobalaena nana Cetotheriidae late Miocene 43.15 2.5 6.07 1064 MNHN SAS 892
11 Aglaocetus burtinii Aglaocetidae middle Miocene 43.21 2.4 5.87 IRSNB M 676
33 Diorocetus hiatus Diorocetidae middle Miocene 42.03 2.7 6.34 USNM 23494
5 Diorocetus sp. “type Freetz” Diorocetidae middle Miocene 45.54 2.5 6.20 SBMB A2008:1252
34 Halicetus ignotus Pelocetidae middle Miocene 55.35 2.3 6.11 USNM 23636
7 Heterocetus sprangii Diorocetidae middle Miocene 48.36 2.8 6.88 SBMB A2008:1253
32 Parietobalaena palmeri Pelocetidae middle Miocene 41.17 2.5 7.44 1014 USNM 13874
8 Amphicetus later Diorocetidae early to middle Miocene 46.69 2 4.56 IRSNB M 548 a
28 Eomysticetus whitmorei Eomysticetidae late Oligocene 36.44 2.4 7.06 ChM PV4253
14 Micromysticetus rothauseni Eomysticetidae late Oligocene 37.69 2.5 7.45 ChM PV7225
36 toothed mysticete Oligocene 35.97 2.1 6.37 ChM PV5720
connected to form a continuous line and exported as volume nation of the radii of curvature of these turns the line rep-
data (image stacks). resentative of the basilar membrane (derived as described
above) was projected in apical view onto an isometric two-
2.4 Number of turns and radii ratio dimensional (2-D) grid created with MatheKonstruktor (http:
//www.martware.de/mathekonstruktor.html, last accessed 14
The number of cochlear turns was determined at a precision April 2016). Circles were fitted onto the basal and apical
of 2◦ based on the images used to trace the bony laminae. turns in such a way that lines were parallel with the most
The ratio of the most basal and the most apical cochlear basal and most apical 90◦ of the respective turn (Fig. 1c).
turns was determined according to the method as intro- Radii and the ratio between the radii of the basal turn of the
duced by Manoussaki et al. (2008), allowing both turns to cochlea and the apical turn were then calculated in Microsoft
have one centrum each, as opposed to a common centrum Excel 2010 based on the 2-D coordinates of three points on
on the modiolar axis (cf. Chadwick et al., 2006; Ekdale the most basal and most apical quarter turns.
and Racicot, 2015; Ketten et al., 2016). For the determi-
www.foss-rec.net/21/33/2018/ Foss. Rec., 21, 33–45, 201836 I. S. Ritsche et al.: Relationships of cochlear coiling shape and hearing frequencies
(a) (b) the analysis. Outlines or curves with homologous start and
end points in each object are also frequently used, and the
same arbitrary number of equally spaced semi-landmarks is
placed along that feature in each object. Landmark configu-
rations are superimposed by minimizing the sum of squared
distances between corresponding landmarks from all objects
to the average configuration (Procrustes superimposition), re-
moving size, position, and orientation of the objects, and
leaving only shape information. Centroid size is the square
root of the sum of the squared distances of the landmarks
(c) (d) from the centroid and represents the size of a landmark con-
figuration.
In our study, the coordinates of 40 semi-landmarks along
the length of the cochlea (Fig. 1d) were exported as text files.
After assembling semi-landmark coordinates of all 41 speci-
mens in Microsoft Excel 2010, a single matrix was exported
as a .txt file and read into MorphoJ 1.06e (Klingenberg,
2011), where Procrustes superimposition was performed.
2.6 Sources and definition of hearing limits
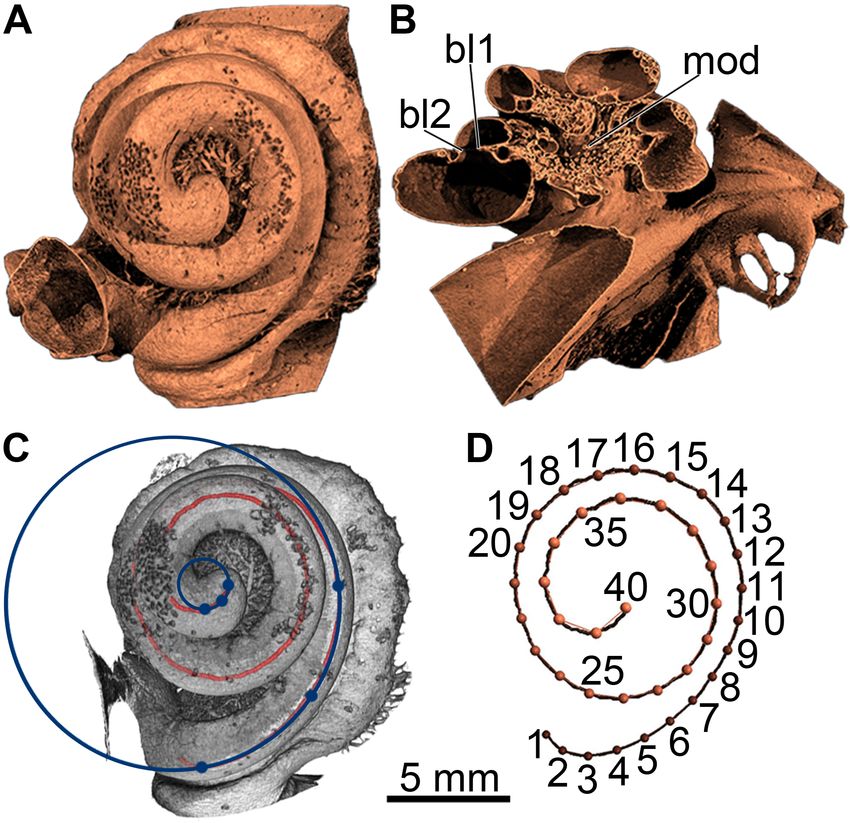
Figure 1. Cochlear anatomy and visualization of methods. (a)
Three-dimensional rendering of the cochlea (shown as right) of Bal- To date, no hearing measurements have been taken on baleen
aenoptera acutorostrata in apical view. (b) Same, virtually tran- whales or on sperm whales (Physeter macrocephalus), and
sected along the modiolus (mod) showing the primary and sec- so the current knowledge of their hearing abilities is based
ondary bony laminae (bl1 and bl2, respectively). (c) Radii ratio on their vocalization frequencies only. The hearing data are
method as applied in this study: circles superimposed onto basal
thus indirect or deduced. It is generally accepted that most
and apical turns of a 2-D projection of the path tracing the basilar
animals are able to hear the frequencies they produce. The
membrane within the cochlea. Dots represent three points on each
circle for calculation of the respective radius. (d) Landmark-based odontocetes Delphinapterus leucas (beluga whale) and Tur-
geometric morphometrics: 3-D resampled path with landmarks 1 to siops truncatus (common bottlenose dolphin) are good ex-
40. amples to support this approach, as known vocalization lim-
its are almost equal to known hearing limits (e.g., Johnson,
1966; Awbrey et al., 1988; Herzing, 2000; Karlsen et al.,
2.5 Cochlear length and geometric morphometrics 2002; Blomqvist and Amundin, 2004; Castellote et al., 2014;
Mishima et al., 2015). Hearing data were used whenever pos-
Exported image stacks of the CT scans were read into ZIB- sible, and vocalization data when no hearing data were avail-
Amira 2015.24, where automatic threshold selection was per- able. For comparability, highest and lowest vocalization fre-
formed. Selection growth was applied twice, and the seg- quencies were used as proxies for HF and LF hearing limits,
mented material was extracted as a thin, tube-shaped coil, respectively. Sources of LF and HF hearing limits are indi-
representing the position of the basilar membrane through- cated in Table 2. For easier reading, regardless of the source
out the cochlea. Three-dimensional surfaces were saved in used, we use the terms “LF hearing” and “HF hearing” be-
.stl file format. Surfaces of left cochleae were flipped using low.
MeshLab v.1.3.1 (http://meshlab.sourceforge.net/) so that all
landmark configurations would later represent the coiling of 2.7 Statistical analysis
cochleae of the same (right) body side. Files were imported
into TIVMI V2.1, where paths were fitted to the surface using Principal components analysis (PCA) of the shape coordi-
an arbitrary adequate number of points, again paying special nates was performed in MorphoJ. In order to test dependence
attention to including basal and apical ends of the coil. Paths of cochlear coiling shape on centroid size, additional linear
were then resampled to be represented by 40 equally spaced regression of shape coordinates on log centroid size was per-
semi-landmarks (Fig. 1d). Resampled path length was used formed in MorphoJ.
as an estimate of cochlear length in this study. PC scores were correlated with cochlear length, number
Geometric morphometrics is a landmark-based approach of cochlear turns, radii ratio, and skull length (Table 1), as
to shape analysis. Comprehensive reviews of the method well as LF and HF hearing limits (Table 2). Skull length was
are given by Mitteroecker and Gunz (2009), Zelditch et used here as a proxy of both intermeatal distance (used for
al. (2012), and Adams et al. (2013). Usually, homologous correlations by Wannaprasert and Jeffery, 2015) and body
landmarks are collected on all objects that are included in size. Skull lengths are condylo-basal lengths measured by
Foss. Rec., 21, 33–45, 2018 www.foss-rec.net/21/33/2018/I. S. Ritsche et al.: Relationships of cochlear coiling shape and hearing frequencies 37
Table 2. Reported hearing and vocalization limits for extant species included in this study.
Species Suborder Low-frequency High-frequency Results based Reference
limit in Hz limit in kHz on
Tursiops Odontoceti 150–200 150 Hearing tests Johnson (1966),
truncatus Turl (1993)
Delphinapterus Odontoceti 125 150 Hearing tests Awbrey et al. (1988),
leucas Castellote et al. (2014)
Physeter Odontoceti 200 32 Vocalization Backus and Schevill
macrocephalus (1966), Madsen et al.
(2002)
Balaenoptera Mysticeti 50 20 Vocalization Gedamke et al. (2001),
acutorostrata Erbe (2002)
Balaenoptera Mysticeti 9 8 Vocalization Beamish and Mitchell
musculus (1971), Mellinger and
Clark (2003)
Megaptera Mysticeti 20 44 Vocalization Thompson et al. (1986),
novaeangliae Erbe (2002)
Balaena Mysticeti 20–25 5 Vocalization Cummings and Holli-
mysticetus day (1987), Erbe (2002)
JMF on cranial 3-D models of adult individuals of the same mation was averaged by species, and individual Procrustes
species used in Fahlke and Hampe (2015). Sources of LF fits and PCAs for these samples needed to be performed.
and HF hearing limits are indicated in Table 2. All variables Again, cranial shape information of M. novaeangliae was
except the PC scores were log10-transformed prior to cor- that of an adult specimen while the cochlea analyzed here is
relation. All correlations and regressions were done in Past that of a fetus. Therefore, only nine cochlear specimens and
3.11 (Hammer et al., 2001). Pearson correlation and linear 18 cranial specimens (representing seven species: two odon-
regression were used. Statistical significance was accepted at tocetes, three extant mysticetes, and two extinct mysticetes)
P38 I. S. Ritsche et al.: Relationships of cochlear coiling shape and hearing frequencies
0.4
Odontoceti 26
200 Hz
150-200 Hz
Principal component 2
30
Mysticeti
0.2 2
21 125 Hz
16 38
22 33 23 20
24 25
7 37 10
18 11 36
0.0 27
19
17
32 (20 Hz) 13
29 9
31 28 39
5
14
0 40
6 35 1 34
** ** 20-25 Hz 8** 50 Hz
3 9 Hz 15
** 12 4 50 Hz
-0.2
-0.4 -0.2 0.0 0.2 0.4 0.6
Principal component 1
Figure 2. PCA plot of shape variation of cochlear coiling. Lines represent 95 % confidence ellipses for Mysticeti (red) and Odontoceti
(blue). Shape change along the axes is shown as black landmark configurations against the average shape (in gray) in apical view and in
profile. Known lowest hearing limits in Hz are given for extant cetaceans (see Table 2). Number in parentheses refers to a fetus. * denotes
extinct mysticetes with presumed very low frequency hearing (50 Hz and below). ** denotes extinct mysticetes with presumed infrasonic
hearing (below 20 Hz). Gray numbers represent identification numbers (ID) listed in Table 2. The specimens plotting outside of the ellipse
are Megapteropsis robusta (ID12) and Eschrichtiidae indet. (ID6).
higher values are associated with a wide basal turn and a very 3.3 Relations of cochlear coiling shape, cochlear
narrow second turn. Low values are again associated with a metrics, hearing frequencies, and cranial shape
wide, almost-protruding second turn and a descending apex.
At high values on PC3 (5.46 % of total variance; not included
The original PC1, PC2, and PC3 of cochlear coiling shape, as
in Fig. 2) the basal turn is quite wide, and the second and api-
well as cochlear length, number of cochlear turns, radii ratio,
cal turns ascend steadily, while lower values on PC3 appear
and skull length, were used.
to be connected with a narrower basal turn, tilting of the sec-
Based on these individual variables, 17 significant correla-
ond turn, and deflection of the apex.
tions were found (Table 3, upper three sections, normal font).
Only 12.69 % of the variation in the data is dependent on
Linear regressions for all significant correlations that involve
size, as regression of shape coordinates on logarithmic cen-
PC1 and PC2 of cochlear coiling shape of the original PCA
troid size revealed (permutation test against null hypothesis
are shown in Fig. 3a–g. Our results indicate that cetacean
of independence: P = 0.007). Therefore cochlear size is not
cochlear coiling, cochlear metrics, and hearing frequencies
the main cause of shape differences.
are linked as follows: higher values on PC1 are associated
3.2 Distribution of LF hearing limits in the PCA plot with lower numbers of cochlear turns (Fig. 3a), a lower radii
ratio (Fig. 3b), and both higher LF and HF hearing limits
LF hearing limits between 200 and 125 Hz (low frequencies (Fig. 3e, g). Higher values on PC2 are associated with shorter
within the human audible range; Møller and Pedersen, 2004) cochlear lengths (Fig. 3c), with smaller skull length (Fig. 3d),
are found in extant Odontoceti on positive values along both and again with higher LF hearing limits (Fig. 3f). Higher val-
axes in the upper right quadrant of the PCA plot (Fig. 2). ues on PC3 are related to shorter cochlear lengths and higher
Very low-frequency hearing of 50 Hz and below is found in radii ratios. It should be added that, while number of cochlear
the lower right quadrant at positive values on PC1 and nega- turns and cochlear length each relate to individual PCs (PC1,
tive values on PC2 (Balaenoptera acutorostrata and Balaena and PCs 2 and 3, respectively), the product of both these vari-
mysticetus). The only extant mysticete in the study that is ables strongly correlates with all three PCs of cochlear coil-
presumably capable of true infrasonic hearing, Balaenoptera ing shape (Table 3, upper section, in italics).
musculus (cf. Mellinger and Clark, 2003), plots in the lower Lower LF hearing limits furthermore occur at longer
left quadrant at negative values on both axes. cochlear lengths, higher numbers of cochlear turns, and to-
gether with lower HF hearing limits. Lower HF hearing lim-
its also occur at longer cochlear lengths and higher numbers
of cochlear turns, and are also connected to a larger radii
ratio (Table 3, third section, normal lettering). Not surpris-
Foss. Rec., 21, 33–45, 2018 www.foss-rec.net/21/33/2018/I. S. Ritsche et al.: Relationships of cochlear coiling shape and hearing frequencies 39
Table 3. Significant correlations (Pearson) found in this study. * means separate Procrustes fit and PCA for cochlear specimens with available
cranial shape data. For correlation of cochlear and cranial shape, shape data were averaged by species prior to PCA.
Significant correlation Sample r P
PC1 – log10 number of turns n = 41 −0.893240 I. S. Ritsche et al.: Relationships of cochlear coiling shape and hearing frequencies
(a) (b) LF hearing via the coupling of the hearing limits. Correla-
0.48
0.36 tions of PC1 and number of turns with each other and both
0.32 0.24 hearing limits are stronger (lower P value, higher absolute
0.16 0.12 values of r; Table 3) than any correlations of radii ratio.
PC1
PC1
0.00
0.00 Shape change along PC2 is linked to cochlear length,
-0.12 which in turn increases with skull length. Longer cochlear
-0.16
-0.24 and skull lengths are connected with lower frequency ranges.
-0.32
-0.36 Notably, this link seems to be unrelated to the number of
-0.16 0.00 0.16 0.32 0.48 0.64 0.80 0.32 0.48 0.64 0.80 0.96 1.12
Log10 number of turns Log10 radii ratio cochlear turns, as number of turns correlated neither with
(c) (d) cochlear length nor with skull length. In cetaceans, a connec-
0.75
0.32
tion between cochlear length, skull size, and, consequently,
0.50
0.24
animal size was detected, although no significant correlation
0.25
0.16
between cochlear length and frequency was found by Ket-
PC2
PC2
0.00
0.08
-0.25
ten (1992). Wannaprasert and Jeffery (2015) found correla-
0.00
-0.50
tions between cochlear length, skull size, and also LF hear-
-0.08
-0.75
ing limit, but they used intermeatal distance instead of skull
-0.16
length as a proxy for body size. Relative intermeatal distance
1.5 1.6 1.7 1.8 1.9 2.0 2.00 2.25 2.50 2.75 3.00 3.25 3.50 3.75
Log10 cochlear length Log10 skull length is reflected in PC3 of symmetric cranial shape change in this
(e) (f) present study, and our results support the link between low
2.25 2.25
LF hearing limits and relatively broader posterior portions
Log10 lf limit (Hz)
Log10 lf limit (Hz)
2.00 2.00
of the cranium. The correlations of PC3 of cochlear shape
1.75 1.75 change with cochlear length (negative) and radii ratio (posi-
1.50 1.50 tive) must be regarded carefully. PC3 only covers 5.46 % of
1.25 1.25 total variation in the data. Thus, the shape changes along PC3
1.00 1.00 outlined in the results section are hardly recognizable in in-
-0.50 -0.25 0.00 0.25 0.50 0.75 1.00 -0.75 -0.50 -0.25 0.00 0.25 0.50 0.75
dividual specimens and are probably obliterated by the more
PC1 PC2
dominant shape changes along the PCs that represent more
(g)
2.8 variation.
2.4 All three significant PCs as well as both hearing limits
Log10 hf limit (kHz)
2.0 have significant correlations with cochlear length times num-
1.6 ber of turns. The relationship between this product and LF
1.2
hearing limits has already been postulated by West (1985),
0.8
Manoussaki et al. (2008), and Wannaprasert and Jeffery
0.4
(2015). Since number of turns is already a defining factor of
0.0
-1.0 -0.5 0.0 0.5 1.0 1.5 cochlear coiling shape, and cochlear length at least correlates
PC1
with PC2, it is not surprising that the product of both serves
Figure 3. (a–g) Linear regressions for significant correlations of well to approximate overall cochlear coiling shape.
PC1 and PC2 with individual variables tested in this study. Our findings regarding cetacean cochlear coiling indicate
that (1) cochlear coiling shape may be used to infer hearing
range; (2) radii ratio might serve as a proxy for cochlear coil-
ing shape and HF hearing limit, but not LF hearing limit; (3)
ously, as Wannaprasert and Jeffery (2015) were not able to number of turns is a stronger proxy for cochlear coiling shape
link the PCs with the highest variance to hearing frequen- and should be preferred over radii ratio; and (4) the closest
cies but reported a positive correlation with PC4 (only 7.2 % representation of cochlear coiling shape and strong correla-
of variance in their study). Also, Ekdale (2016) did not find tions with both LF and HF hearing limits are achieved when
a link between cochlear coiling shape and hearing abilities cochlear length times number of turns is used.
using PCA. Number of cochlear turns, deemed functionally The correlation between hearing limits and cranial shape
insignificant by Fleischer (1976a), was already identified as links the symmetric, broad mysticete cranial shape to lower
an indicator for LF hearing sensitivity by West (1985). hearing frequencies and the asymmetric, “telescoped” odon-
Interestingly, radii ratio has previously only been linked to tocete cranial shape to higher hearing frequencies, and thus
LF hearing limits or thresholds in hearing generalists (Chad- quantitatively supports the widely accepted assumption of
wick et al., 2006; Manoussaki et al., 2008) and LF special- this interrelation (cf. Fleischer, 1976b). Consequently, the
ists (Ketten et al., 2016). In this study; however, radii ratio shape of cochlear coiling that is linked to hearing frequen-
is connected to PC1, number of turns, and HF hearing limit. cies also links to cranial shape.
Thus, there is only an indirect connection of radii ratio and
Foss. Rec., 21, 33–45, 2018 www.foss-rec.net/21/33/2018/I. S. Ritsche et al.: Relationships of cochlear coiling shape and hearing frequencies 41
4.2 Occurrence of very low-frequency and infrasonic the higher LF limit of the odontocetes, plotting next to an
hearing Oligocene toothed mysticete (ID36), which obviously points
to a deviating hearing ability of the unborn because of the yet
Based on cochlear coiling shape, a middle Miocene dioro- incomplete development of the cochlear coiling shape. It can-
cetid Amphicetus later (IRSNB M 548a, formerly Mesocetus not be ruled out that phylogenetic relationships potentially
longirostris, Steeman, 2010) and the middle Miocene Hal- play a role in the patterns observed in Fig. 2. Nevertheless,
icetus ignotus (both denoted * in Fig. 2, left to right) are we decided not to perform a phylogenetic analysis, because
found close to B. acutorostrata (ID4, ID15), in the lower several specimens included here, especially those from the
right quadrant of the PCA plot, implying that very low- Neogene of Belgium and Germany, are described on isolated
frequency hearing of around 50 Hz had already evolved by periotic bones only. Phylogenetic relationships for part of the
the middle Miocene. The Oligocene eomysticetids Eomys- taxa are either not resolved or currently under debate (see
ticetus whitmorei (ID28) and Micromysticetus rothauseni Steeman, 2007; Hampe and Ritsche, 2011; Boessenecker and
(ID14) also plot in the vicinity, but higher on PC2, suggest- Fordyce, 2015; Marx and Fordyce, 2015).
ing the possibility that even the late Oligocene Chaeomys- In conclusion, it should be noted that, although we con-
ticeti were capable of hearing frequencies between 100 and sider it likely that low and even very low frequencies were
50 Hz. A Pliocene eschrichtiid, a late Miocene balaenopterid heard by the earliest mysticetes, our results do not indicate
(Megapteropsis robusta), and the late Miocene Amphicetus the occurrence of infrasonic hearing before the late Miocene.
later (IRSNB M 575; all three denoted ** in Fig. 2, left An early sensitivity for low frequencies is in concordance
to right) plot beyond B. musculus (ID3) in the lower left with the results by Nummela et al. (2004) and Uhen (2004),
quadrant. This position suggests that infrasonic hearing be- who analyzed the anatomy of archaeocete outer, middle, and
low 20 Hz had evolved by the late Miocene. The extraordi- inner ears. Infrasonic hearing is a specialization that possi-
nary position of M. robusta and of a Pliocene member of bly evolved several times within baleen whales, as its occur-
Eschrichtiidae outside the confidence ellipse of mysticetes rence in Diorocetidae, Eschrichtiidae, and Balaenopteridae
indicates a unique cochlear coiling shape and leads to the as- implies. Therefore, within cetaceans, infrasonic hearing can
sumption that these two extinct balaenopteroids were proba- be regarded as a purely mysticete trait, and ultrasonic hear-
bly specialized to very low and infrasonic frequencies only. ing as an odontocete trait. Also, Mourlam and Orliac (2017)
The upper left quadrant with negative values on PC1 and concluded that infrasonic and ultrasonic hearing evolved af-
positive values on PC2 is occupied by middle Miocene to ter the emergence of fully aquatic whales and within Neoceti,
Pliocene mysticetes. The lack of extant cetaceans in this plot which contrasts with previous results of infrasonic sensitivity
area prohibits direct inference of a LF hearing limit, but the in basilosaurids (Ekdale, 2016; Park et al., 2017). However,
distribution of cetaceans with reported hearing and vocaliza- no archaeocetes were included in our study, and a more de-
tion limits (see Table 2) suggests that all these extinct mys- tailed interpretation would be merely speculative based on
ticetes were also capable of hearing frequencies of 125 Hz our data.
and below.
The three specimens of Amphicetus later (revised by Stee- 4.3 Method applicability and comparisons
man, 2010) occupy different quadrants of the graph and are
positioned far apart from each other. A. later (IRSNB M 622, We used hearing thresholds determined by experiment where
formerly Heterocetus sprangii) plots in the upper right quad- possible (Table 2). However, as mentioned above, actual fre-
rant, whereas A. later (IRSNB M 548a, formerly Mesoce- quency thresholds were only available for the two smaller
tus longirostris) and Amphicetus later (IRSNB M 575) plot odontocetes, Tursiops truncatus and Delphinapterus leucas.
in the lower right and lower left quadrant, respectively. In- For Physeter and the extant mysticetes included, such experi-
traspecific variation does not seem to have a strong influence ments have not been conducted as of yet (at least not for adult
on the positions of individuals in the plot, as seen in B. acu- individuals). Therefore, highest and lowest vocalization fre-
torostrata. Therefore, the scattering of individuals of A. later quencies observed in the wild were used as proxies for hear-
across the plot might imply that these individuals actually ing frequencies (Table 2). We are aware that the lack of hear-
represent different species, and are not conspecific, as Stee- ing data for mysticetes and adult sperm whales is critical, as
man (2010) suggested. is the combination of hearing and vocalization frequencies in
The number of 20 Hz in parentheses in the upper right correlations.
quadrant of the graph refers to Megaptera novaeangliae, a Furthermore, observations of vocalization frequencies as
fetus of unknown developmental stage and the only fetal in- well as experimentally determined hearing thresholds need
dividual included in this study. The LF vocalization limit of to be considered carefully. For example, the highest observed
20 Hz has been reported for adult individuals (see Table 2). frequency emitted by a blue whale is thought to be 8 kHz,
However, all adult mysticetes with presumed very LF and but a noise at 31 kHz was also recorded around a blue whale,
infrasonic hearing are found at lower values on PC2. The however, it might have been emitted by a different animal
position of the fetus of M. novaeangliae is shifted towards (Beamish and Mitchell, 1971).
www.foss-rec.net/21/33/2018/ Foss. Rec., 21, 33–45, 201842 I. S. Ritsche et al.: Relationships of cochlear coiling shape and hearing frequencies Experimental hearing tests are also problematic, because aspects of cochlear coiling shape. Thus, their inclusion would they often refer to the response of a tested subject at cer- not have added to this study but rather would have reduced tain frequencies, a circumstance that, in itself, is a source the clarity of the discussion. of uncertainty. For reasons of comparability, hearing tests Like other individual measurements, the radii ratio method are often conducted at a sound pressure level of 60 dB re does not yield comprehensive information on cochlear coil- 20 µPa in air and at 120 dB re 1 µPa in water as an equiva- ing shape. While the relationship between the curvature of lent sound pressure level (West, 1985; Wartzok and Ketten, the most basal and the most apical turns gives us some in- 1999). Other studies, such as that by Wannaprasert and Jef- formation regarding wave energy redistribution and conse- fery (2015), used frequency limits that had been determined, quently propagation of LF waves and reception of LF sound for example, at 140 dB re 1 µPa with the sound source posi- (Manoussaki et al., 2006, 2008), the length, number of turns, tioned directly in front of the single subject (in this case Del- and shape of the turns in between the basal and apical turn phinapterus leucas; Johnson et al., 1989, which is the same are not covered by this method. reference indirectly used by Wannaprasert and Jeffery, 2015, Furthermore, there is a widely ignored problem with the who cited Nedwell et al., 2004). It is hard to tell whether the reproducibility of the radii ratio method. In order to describe LF response by the subject at such high sound pressure lev- the curvature of the basal and apical turns, Manoussaki et els is due to hearing or rather feeling the sound wave (see al. (2008) used five equally spaced points on the first quarter Turl, 1993). The hearing test for belugas referred to in this of basal and last quarter of the apical turn on an orthogonal study was conducted at a maximum sound pressure level of projection of the path of the basilar membrane in order to 120 dB re 1 µPa and with three captive individuals (Awbrey determine the center of curvature and radius for each of the et al., 1988). turns individually. This way, actual curvature is taken into Taken together, LF and HF hearing limits, as used here, consideration. This procedure is mimicked in our study by can only be approximations of the actual lowest and highest calculating the respective radii based on 2-D coordinates of frequencies these cetaceans are able to hear or vocalize, and three points on the most basal and most apical quarter turns that correlations with these hearing limits indicate but do not (Fig. 1c). prove that certain characteristics are responsible for LF and A different procedure to determine basal and apical radii infrasonic hearing abilities. Additionally, HF and LF hearing was used by Chadwick et al. (2006), Ekdale and Racicot and vocalization limits were only available for seven species (2015), and Ketten et al. (2016). These authors connected included in our study. Of these species, Megaptera novaean- one point at the basal end and one point at the apical end of gliae was represented by a fetus and was therefore excluded, the basilar membrane each to a common center, positioned but Balaenoptera acutorostrata was represented by two adult either at the center of the spiral or at the center of the modi- specimens, leaving us at a sample size of n = 7 (out of 41). olus, in an orthogonal 2-D projection of the cochlea. This Based on this small sample size, statistical significance of procedure is a mere connection of points and has little to the correlations of PC scores with LF and HF hearing limits do with the actual curvature of the respective turns. Further- needs to be regarded carefully, and certainly the inclusion of more, all three points (basal, apical, and central) were deter- more extant cetaceans with known hearing limits and vocal- mined differently by all three working groups; for example, ization spectra would be worthwhile in order to corroborate the apical point is either at the minimum distance to the cen- our results in the future. ter (Chadwick et al., 2006), at the tip of the apex (Ekdale In this study, we demonstrated that cochlear coiling shape and Racicot, 2015), or at the center of the basilar membrane is related to LF and HF hearing limits in cetaceans. We also at the helicotrema (Ketten et al., 2016). The radii yielded by found that number of turns and especially cochlear length these various approaches are not comparable or interchange- times number of turns (see West, 1985) offer reliable and able with each other. Furthermore, these various approaches more readily measurable alternatives in order to estimate possibly lead to different radii ratios of curvature calculated hearing ranges. However, overall cochlear coiling shape in- for Balaenoptera musculus: 4.8 (Chadwick et al., 2006), 10.5 cludes cochlear characters that cochlear length or number of (Ketten et al., 2016), and 5.6 in our study. Estimating LF turns do not cover, for example, the protrusion of the second hearing limits by using the ratio of the radii of curvature cochlear turn over the basal turn, the position of the basal end from the most basal and most apical turn of the cochlea is below the level of the basal turn, or the descending apex – thus a delicate issue. Nonetheless, Ekdale and Racicot (2015) characters that are all related to very LF and infrasonic hear- and Park et al. (2017) used the radii measured with their ing. own technique but the equation derived by Manoussaki et Of course, there are other cochlear measurements (e.g., al. (2008) to estimate the frequency limits of extinct and ex- cochlear height, and other products and ratios of measure- tant cetaceans. Therefore, we suggest that their implied infra- ments, e.g., basal ratio, axial pitch, or cochlear slope) that sonic hearing limit for the archaeocete Zygorhiza kochii (8 or surely have functional significance (Ekdale and Racicot, 10 Hz, respectively) and for some toothed mysticetes (Park et 2015). However, we did not use them here, because, like al., 2017: table 1) be reevaluated, and that the application of cochlear length times number of turns, they do not cover all the radii ratio method be standardized. Foss. Rec., 21, 33–45, 2018 www.foss-rec.net/21/33/2018/
I. S. Ritsche et al.: Relationships of cochlear coiling shape and hearing frequencies                                                    43

   It is hard to tell whether it is due to this reproducibility is-     Very low-frequency hearing (50 Hz and below) had likely
sue of the radii ratio method that we were not able to correlate      evolved by the middle Miocene, and infrasonic hearing (be-
radii ratio with LF hearing limit. Manoussaki et al. (2008)           low 20 Hz) had evolved by the late Miocene. Even the earliest
stated that their method might only be applicable to hear-            Mysticeti were probably able to hear frequencies of 100 Hz
ing generalists (potentially excluding LF hearing specialists).       and below, and the ability to hear low frequencies within the
However, Ketten et al. (2016), using the single-center ap-            human audible range may be ancestral to all Neoceti.
proach, were able to show a connection between radii ratio              Cochlear coiling shape proved useful for inferring hear-
and LF limit for Mysticeti.                                           ing range, as did number of turns and cochlear length times
   Our study is not the first one to use cochlear coiling             number of turns. Radii ratio is not directly connected to LF
shape (termed “cochlear shape” by Wannaprasert and Jef-               hearing in our study, and to date the method has not been
fery, 2015). Wannaprasert and Jeffery (2015) used a simi-             used in a standardized, comparable manner.
lar mode of extracting coiling information from CT scans,
but their method differs from ours in several details: First of
all, our data were not initially intended to be used for shape        Data availability. Micro-CT data and related metadata are archived
analysis, but only for calculation of radii ratio and cochlear        at the Helmholtz-Zentrum Berlin für Materialien und Energie. Ad-
length. Therefore, coordinates of the initial landmarks that          ditional data (morphometrics, PCAs, imaging, statistics) can be ac-
were placed on the resliced CT images were not available,             cessed through the Museum für Naturkunde – Leibniz-Institut für
                                                                      Evolutions- und Biodiversitätsforschung in Berlin, Germany.
and we had to implement the extra step of exporting a tube-
shaped spiral and placing landmarks onto it. Wannaprasert
and Jeffery (2015) apparently deduced their shape informa-
                                                                      Competing interests. The authors declare that they have no conflict
tion directly from CT images, which, admittedly, makes their
                                                                      of interest.
approach less prone to user errors. However, they only used
22.5◦ increments to capture the coiling shape, whereas we
used increments of 2◦ , resulting in a much more precise rep-         Special issue statement. This article is part of the special issue
resentation of cochlear coiling geometry. Also, Wannaprasert          “Secondary adaptation of tetrapods to life in water – Proceedings of
and Jeffery (2015) used “the center of the cochlear cavity”           the 8th International Meeting, Berlin 2017”. It is a result of the 8th
(Wannaprasert and Jeffery, 2015: p. 43) to place the initial          International Meeting on the Secondary Adaptation of Tetrapods to
landmarks in each slice, whereas we used a more precise and           Life in Water, Berlin, Germany, 3–8 April 2017.
reproducible location, namely the point exactly halfway be-
tween the primary and secondary bony laminae. Therefore,
we assume that we provided valuable improvement in terms              Acknowledgements. We kindly thank the following persons and
of accuracy and reproducibility for the method introduced by          institutions for access to specimens: David J. Bohaska and Nicholas
Wannaprasert and Jeffery (2015).                                      D. Pyenson (USNM), Mark Bosselaers (Royal Zeeland Society of
                                                                      Science, Middelburg, the Netherlands; IRSNB), Mark T. Clementz
                                                                      (University of Wyoming, Laramie, WY), Ellen Horstrup (SBMB),
5   Conclusions                                                       Annelise Folie and Olivier Lambert (IRSNB), Frieder Mayer
                                                                      and Detlef Willborn (ZMB_MAM), Jennifer McCormick (ChM),
Based on the results of our analysis of cochlear coiling shape,       Christian de Muizon (MNHN), Morten Tange Olsen (CN), Klaas
shape change along the PC axes (Fig. 2) suggests that a shift         Post (NMR), and J. G. M. “Hans” Thewissen (NEOMED). We
of the frequency range towards the lower end, including the           are indebted to Nikolay Kardjilov (Helmholtz-Zentrum Berlin) for
                                                                      support of micro-CT scanning, reconstruction, and visualization.
ability to hear very low and infrasonic frequencies, is asso-
                                                                      We would also like to express our cordial thanks to Olivier Lambert
ciated with compact coiling, a nongradual ascent of the basi-
                                                                      (Institut royal des Sciences naturelles de Belgique, Brussels) and
lar membrane, the basal end of the basilar membrane be-               Benjamin Ramassamy (Museum Sønderjylland, Gram, Denmark)
low the level of the basal turn, the second turn protruding           for their critical and helpful reviews of the manuscript, plus Eric
over the basal turn, a descending apex, and a high number             G. Ekdale (San Diego State University) and Thomas Deméré (San
of turns (2.2 or above). Furthermore, low LF limits occur in          Diego Natural History Museum) for commenting on an earlier
cetaceans with longer cochleae and relatively larger cranial          version of the manuscript. Funding was provided by the Deutsche
widths (PC3 of symmetric cranial shape).                              Forschungsgemeinschaft (DFG HA 1776/13-1, DFG FA 889/2-1,
   Frequency ranges at the higher end of the cetacean spec-           and DFG BA 1170/25-1).
trum, including the use of ultrasound, as well as regularly
coiled, shorter cochleae with fewer turns, and a lower radii          Edited by: Florian Witzmann
                                                                      Reviewed by: Olivier Lambert and Benjamin Ramassamy
ratio, are clearly tied to the odontocete cranial shape featur-
ing extreme posterior shift and shortening of the nasals (tele-
scoping) and cranial asymmetry (a larger right side of the
cranium).

www.foss-rec.net/21/33/2018/                                                                               Foss. Rec., 21, 33–45, 2018
44 I. S. Ritsche et al.: Relationships of cochlear coiling shape and hearing frequencies
References Fleischer, G.: Studien am Skelett des Gehörorgans der Säugetiere,
einschließlich des Menschen, Säugetierkundl. Mitt., 21, 131–
Adams, D. C., Rohlf, F. J., and Slice, D. E.: A field comes of age: 239, 1973.
geometric morphometrics in the 21st century, Hystrix, 24, 7–14, Fleischer, G.: Hearing in extinct cetaceans as determined by
2013. cochlear structure, J. Paleont., 50, 133–152, 1976a.
Awbrey, F. T., Thomas, J. A., and Kastelein, R. A.: Low-frequency Fleischer, G.: Über die Beziehungen zwischen Hörvermögen und
underwater hearing sensitivity in belugas, Delphinapterus leu- Schädelbau bei Walen, Säugetierkundl. Mitt., 24, 48–59, 1976b.
cas, J. Acoust. Soc. Amer., 109, 1717–1722, 1988. Fleischer, G.: Evolutionary principles of the mammalian middle ear,
Backus, R. H. and Schevill, W. E.: Physeter clicks, in: Whales, dol- Adv. Anat. Embryol. Cell Biol., 55, 3–70, 1978.
phins and porpoises, edited by: Norris, K. S., Univ. California Gedamke, J., Costa, D. P., and Dunstan, A.: Localization and visual
Press, Berkeley, 510–528, 1966. verification of a complex minke whale vocalization, J. Acoust.
Beamish, P. and Mitchell, E.: Ultrasonic sounds recorded in the Soc. Amer., 109, 3038–3047, 2001.
presence of a blue whale Balanoptera musculus, Deep-Sea Res., Hammer, Ø., Harper, D. A. T., and Ryan, P. D.: PAST: Paleontolog-
18, 803–809, 1971. ical statistics software package for education and data analysis,
Blomqvist, C. and Amundin, M.: High-frequency burst-pulse Palaeontol. Electronica, 4, 1–9, 2001.
sounds in agonistic/agressive interactions in Bottlenose dolphins, Hampe, O. and Ritsche, I.: Die Bartenwalfauna (Cetacea: Mys-
Tursiops truncatus, in: Echolocation in bats and dolphins, edited ticeti: Balaenomorpha) aus dem Lüneburgium (Serravallium,
by: Thomas, J. A., Moss, C. F., and Vater, M., University Press, Mittelmiozän) von Freetz bei Sittensen (Niedersachsen, Deutsch-
Chicago, 425–431, 2004. land), Z. geol. Wiss., 39, 83–110, 2011.
Boessenecker, R. W. and Fordyce, R. E.: A new genus and species Heffner, H. E. and Heffner, R. S.: High-frequency hearing, in:
of eomysticetid (Cetacea: Mysticeti) and a reinterpretation of Handbook of the senses: Audition, edited by: Dallos, P., Oertel,
‘Mauicetus’ lophocephalus Marples, 1956: Transitional baleen D., and Hoy, R., Elsevier, New York, 55–60, 2008.
whales from the upper Oligocene of New Zealand, Zool. J. Lin- Herzing, D. L.: Acoustics and social behaviour of wild dolphins:
nean Soc., 175, 607–660, 2015. Implications for a sound society, in: Hearing by whales and dol-
Castellote, M., Mooney, T. A., Quakenbush, L., Hobbs, R., Goertz, phins, edited by: Au, W. W. L., Popper, A. N., and Fay, R. R.,
C., and Gaglione, E.: Baseline hearing abilities and variability in Springer, New York, 225–272, 2000.
wild beluga whales (Delphinapterus leucas), J. Exp. Biol., 217, Johnson, C. S.: Auditory threshold of the bottlenosed porpoise (Tur-
1682–1691, 2014. siops truncatus, Montagu), NOTS Techn. Publ., 4178, U.S. Naval
Chadwick, R. S., Manoussaki, D., Dimitriadis, E. K., Shoelson, B., Ordonance Test Station, China Lake, CA, 1966.
Ketten, D. R., Arruda, J., and O’Malley, J. T.: Cochlear coiling Johnson, C. S., McManus, M. W., and Skaar, D.: Masked tonal hear-
and low-frequency hearing, in: Auditory mechanisms: Processes ing thresholds in the beluga whale, J. Acoust. Soc. Amer., 85,
and models, Nuttall, A. L., Ren, T., Gillespie, P., Grosh, K., and 2651–2654, 1989.
de Broer, E., World Scientific Publishing, Singapore, 417–424, Kardjilov, N., Hilger, A., Manke, I., Woracek, R., and Banhart,
2006. J.: CONRAD-2: the new neutron imaging instrument at the
Churchill M., Martínez-Cáceres, M., de Muizon, C., Mnieckowski, Helmholtz-Zentrum Berlin, J. Applied Crystallogr., 49, 195–202,
J., and Geisler, J. H.: The origin of high-frequency hearing in 2016.
whales, Current Biol., 26, 2144–2149, 2016. Karlsen, J. D., Bisther, A., Lydersen, C., Haug, T., and Kovacs, K.
Cummings, W. C. and Holliday, D. V.: Sounds and source levels M.: Summer vocalizations of adult male white whales (Delphi-
from bowhead whales off Pt. Barrow, Alaska, J. Acoust. Soc. napterus leucas) in Svalbard, Norway, Polar Biol., 25, 808–817,
Amer., 82, 814–821, 1987. 2002.
Cranford, T. W. and Krysl, P.: Fin whale sound re- Ketten, D. R.: The cetacean ear: Form, frequency and evolution,
ception mechanisms: Skull vibration enables low- in: Marine mammal sensory systems, edited by: Thomas, J. A.,
frequency hearing, PLoS ONE, 10, e0116222, 1–17, Kastelein, R. A., and Supin, A. Y., Plenum Press, New York, 53–
https://doi.org/10.1371/journal.pone.0116222, 2015. 75, 1992.
Erbe, C.: Hearing abilities of baleen whales, Defense R&D Canada Ketten, D. R.: Functional analysis of whale ears: Adaptations for
Atlantic Contractor Report, 2002-065, 1–28, 2002. underwater hearing, IEEE Proc. Underwater Acoust., 1, 264–
Ekdale, E. G.: Morphological variation among the inner ears of ex- 270, 1994.
tinct and extant baleen whales (Cetacea: Mysticeti), J. Morphol., Ketten, D. R., Arruda, J., Cramer, S., and Yamato, M.: Great
277, 1599–1615, 2016. ears: Low-frequency sensitivity correlates in land and marine
Ekdale, E. G. and Racicot, R. A.: Anatomical evidence for low fre- leviathans, in: The effects of noise on aquatic life II. Advances
quency sensitivity in an archaeocete whale: Comparison of the in Medicine and Biology, 875, edited by: Popper, A. N. and
inner ear of Zygorhiza kochii with that of crown Mysticeti, J. Hawkins, A., Springer, New York, 529–538, 2016.
Anat., 226, 22–39, 2015. Klingenberg, C. P.: MorphoJ: An integrated software package for
Fahlke, J. M. and Hampe, O.: Cranial symmetry in baleen whales geometric morphometrics, Molecular Ecol. Resources, 11, 353–
(Cetacea, Mysticeti) and the occurrence of cranial asymmetry 357, 2011.
throughout cetacean evolution, Naturwiss., 102, 1–16, 2015. Madsen, P. T., Wahlberg, M., and Møhl, B.: Male sperm whale
Fahlke, J. M., Gingerich, P. D., Welsh, R. C., and Wood, A. R.: Cra- (Physeter macrocephalus) acoustics in a high-latitude habitat:
nial asymmetry in Eocene archaeocete whales and the evolution implications for echolocation and communication, Behavioral
of directional hearing in water, P. Natl. Acad. Sci., 108, 14545– Ecol. Sociobiol., 53, 31–41, 2002.
14548, 2011.
Foss. Rec., 21, 33–45, 2018 www.foss-rec.net/21/33/2018/I. S. Ritsche et al.: Relationships of cochlear coiling shape and hearing frequencies 45 Manoussaki, D., Dimitriadis, E. K., and Chadwick, R. S.: Cochlea’s Steeman, M. E.: Cladistic analysis and a revised classification of graded curvature effect on low frequency waves, Phys. Rev. Lett., fossil and recent mysticetes, Zool. J. Linnean Soc., 150, 875– 96, 1–4, 2006. 894, 2007. Manoussaki, D., Chadwick, R. S., Ketten, D. R., Arruda, J., Dimitri- Steeman, M. E.: The extinct baleen whale fauna from the Miocene- adis, E. K., and O’Malley, J. T.: The influence of cochlear shape Pliocene of Belgium and the diagnostic cetacean ear bones, J. on low-frequency hearing, P. Natl. Acad. Sci., 105, 6162–6166, Syst. Palaeont., 8, 63–80, 2010. 2008. Thompson, P. O., Cummings, W. C., and Ha, D. J.: Sounds, source Marx, F. G. and Fordyce, R. E.: Baleen boom and bust: A synthesis levels, and associated behavior of humpback whales, Southeast of mysticete phylogeny, diversity and disparity, R. Soc. open sci., Alaska, J. Acoust. Soc. Amer., 80, 735–740, 1986. 2, 140434, https://doi.org/10.1098/rsos.140434, 2015. Tubelli, A. A., Zosuls, A., Ketten, D. R., Yamato, M., and Mountain, Marx, F. G., Lambert, O., and Uhen, M. D.: Cetacean Paleobiology, D. C.: A prediction of the minke whale (Balaenoptera acutoros- Wiley, Chichester, UK, 2016. trata) middle-ear transfer function, J. Acoust. Soc. Amer., 132, Mellinger, D. K. and Clark, C. W.: Blue whale (Balaenoptera mus- 3263–3272, 2012. culus) sounds from the North Atlantic, J. Acoust. Soc. Amer., Turl, C. W.: Low-frequency sound detection by a bottlenose dol- 114, 1108–1119, 2003. phin, J. Acoust. Soc. Amer., 94, 3006–3008, 1993. Miller, G. S.: The telescoping of the cetacean skull, Smithsonian Uhen, M. D.: Form, function, and anatomy of Dorudon atrox (Mam- Misc. Coll., 76, 1–71, 1923. malia, Cetacea): An archaeocete from the middle to late Eocene Mishima,Y., Morisaka, T., Itoh, M., Matsuo, I., Sakaguchi, A., and of Egypt, Univ. Michigan Pap. Paleontol., 34, 1–222, 2004. Miyamoto, Y.: Individuality embedded in the isolation calls of Vater, M., Meng, J., and Fox, R. C.: Hearing organ evolution and captive beluga whales (Delphinapterus leucas), Zool. Lett., 1, specialization: Early and later mammals, in: Evolution of the ver- 27, https://doi.org/10.1186/s40851-015-0028-x, 2015. tebrate auditory system, edited by: Manley, G. A., Popper, A. N., Mitteroecker, P. and Gunz, P.: Advances in geometric morphomet- and Fay, R. R., Springer, New York, 256–288, 2004. rics, Evol. Biol., 36, 235–247, 2009. Wannaprasert, T. and Jeffery, N.: Variations of mammalian cochlear Møller, H. and Pedersen, C. S.: Hearing at low and infrasonic fre- shape in relation to hearing frequency and skull size, Tropical quencies, Noise Health, 6, 37–57, 2004. Nat. Hist., 15, 41–54, 2015. Mourlam, M. J. and Orliac, M. J.: Infrasonic and ultrasonic hearing Wartzok, D. and Ketten, D. R.: Marine mammal sensory systems, evolved after the emergence of modern whales, Current Biol., 27, in: Biology of marine mammals, edited by: Reynolds III, J. E. 1776–1781, 2017. and Rommel, S. A., Smithsonian Inst. Press, Washington, D.C., Nedwell, J. R., Edwards, B., Turnpenny, A. W. H., and Gordon, J.: 117–175, 1999. Fish and marine mammal audiograms: A summary of available West, C. D.: The relationship of the spiral turns of the cochlea and information, Subacoustech Rep., 534R0214, Hampshire, 2004. the length of the basilar membrane to the range of audible fre- Nummela, S., Thewissen, J. G. M., Bajpai, S., Hussain, S. T., and quencies in ground dwelling mammals, J. Acousti. Soc. Amer., Kumar, K.: Eocene evolution of whale hearing, Nature, 430, 77, 1091–1101, 1985. 776–778, 2004. Yamato, M., Ketten, D. R., Arruda, J., Cramer, S., and Moore, K.: Nummela, S., Thewissen, J. G. M., Bajpai, S., Hussain, S. T., and The auditory anatomy of the minke whale (Balaenoptera acu- Kumar, K.: Sound transmission in archaic and modern whales: torostrata): A potential fatty sound reception pathway in a baleen anatomical adaptations for underwater hearing, Anat. Rec., 290, whale, Anat. Rec., 295, 991–998, 2012. 716–733, 2007. Zelditch, M. L., Swiderski, D. L., and Sheets, H. D.: Geometric Park, T., Evans, A. R., Gallagher, S. J., and Fitzgerald, E. M. G.: morphometrics for biologists: A primer, 2nd edition, Elsevier Low-frequency hearing preceded the evolution of giant body- Acad. Press, London, 2012. size and filter feeding in baleen whales, Proc. Roy. Soc. B, 284, 20162528, https://doi.org/10.1098/rspb.2016.2528, 2017. www.foss-rec.net/21/33/2018/ Foss. Rec., 21, 33–45, 2018
You can also read