RENEW NSRP Executive Housing Market - Newcastle-Under ...
←
→
Page content transcription
If your browser does not render page correctly, please read the page content below
RENEW NSRP Executive Housing Market

September 2010

Prepared for                                Arc4 contact

Joanne Tyzzer, Darren Jones, Brian Davies   David Cumberland /
North Staffordshire Regeneration            Ross Tolmie-Thomson
Partnership                                 Arc4 Ltd
Renew North Staffordshire                   Beehive Mill
Stoke City Council                          Jersey Street
                                            Ancoats
                                            Manchester
                                            M4 6JG

email: joanne.tyzzer@stoke.gov.uk           Tel    +44 (0) 161 228 1689
                                            email
                                            david.cumberland@arc4.co.uk
                                            ross.tolmie-thomson@arc4.co.uk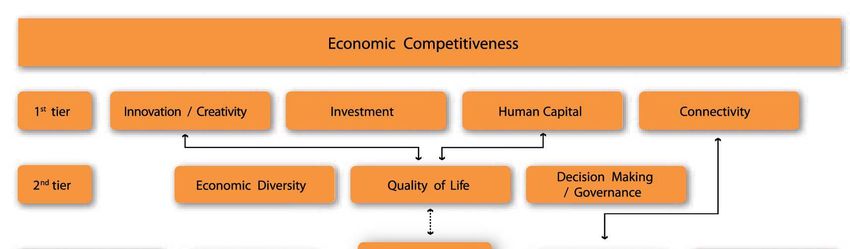
4
arc
Beehive Mill
Jersey Street
Ancoats
Manchester
M4 6JG
T: 0161 228 1689
F: 0161 228 6514
Email: contact@arc4.co.uk
Website: www.arc4.co.uk

Contents

arc4 RENEW NSRP Executive Housing Market Research Sept 2010   2 of 80
Section 1.0       Report Overview                                      4
                  Introduction                                         4

Section 2.0       Methodology                                          7
                  Current Executive Housing Market                     8
                  Future Executive Housing Market                      9
                  Research Framework                                   9

Section 3.0       Executive Housing Market Definition                 12

Section 4.0       Executive Housing Market Assessment                 14
                  Current Executive Housing Market                    14
                  Current high-end property market context            17
                  Wider Housing Reference Area                        22

Section 5.0       Strategic Policy context for housing delivery       25

Section 6.0       Demand for Executive Housing                        31
                  Household income and ACORN profiles                 31
                  Demographic and population projections              33
                  Changes in employment and incomes                   37

Section 7.0       Primary Fieldwork                                   38
                  Estate agent testimonies                            38
                  Focus group attitudes and aspirations               43
                  Developer perceptions                               45

Section 8.0       Current supply of new build executive housing       48

Section 9.0       Developing an executive housing market              50

Section 10.0      Conclusions                                         56
                  Including recommendations                           63

Appendices                                                            65

arc4 RENEW NSRP Executive Housing Market Research Sept 2010       3 of 80
Section 1
Report overview
1.1 Introduction
1.1.1 Arc4 Ltd. has been commissioned by RENEW and NSRP to undertake an assessment of the
Executive Housing Market (EHM) in the North Staffordshire regeneration Partnership (NSRP)
area, including the local authorities of Stoke, Newcastle-under-Lyme and Staffordshire
Moorlands. The assessment framework is split into two distinctive areas: a review of the
current EHM in terms of housing supply and demand profiles, then secondly an assessment
of the future EHM in terms of market demand and developer potential. Stakeholder and
consumer consultation has been an important component of this research, which ensures a
wide range of views and expertise is captured in the research.
1.1.2 Under the aegis of the NSRP Business Plan, there is a priority within the housing and
regeneration frameworks to diversify the stock profile. Limited supply of high value executive
housing assets (properties in the higher Council Tax bands G and H) is weakening the
housing offer. Testing the housing markets appetite for increasing the supply of properties in
tax bands E to H will feature heavily in the assessment process.
1.1.3 In summary this research
• Provides a definition of an executive housing market and the attributes of an exclusive
housing product
• Explores the size and profiles of the current executive housing market in North
Staffordshire
• Provides material on future executive housing aspirations based on market testing of the
demand group and housing agents
• Reviews the potential for future executive housing delivery across the district based on
developer and local planning authority perspectives.
1.1.4 There is a requirement to produce an evidence-based, focussed review of
opportunities and identify issues pertaining to the suitability of developing executive housing
on land both owned and identified with potential for this supply type.
1.1.5 The adopted Newcastle-under-Lyme and Stoke-on-Trent Core Spatial Strategy outlines that
in order to achieve the strategic aims both regionally and sub-regionally, substantial
restructuring of the employment and residential offer in North Staffordshire is required.
Although the Regional Spatial Strategy has been abolished, Stoke City Council are still
working to the same housing growth numbers as before, since they have been included
within the Core Strategy and were arrived at through thorough research of the evidence
base.
1.1.6 The latest available indicators suggest that the existing provision for the executive market is
limited in North Staffordshire, specifically so within the city of Stoke-on-Trent. As outlined by
the RENEW North Staffordshire Regeneration Partnership Business Plan 2008 – 2011, the
sub region has a constrained supply of high-end market housing and the imbalance of
housing supply is closely allied to the socio-economic profile and under performance of the
area in retaining and attracting economically independent households.
arc4 RENEW NSRP Executive Housing Market Research Sept 2010 4 of 801.1.7 The latest Strategic Housing Market Assessment identified Stoke-on-Trent as a unique
market in continuing to suffer population loss, in particular to neighbouring authorities
Newcastle-under-Lyme and Staffordshire Moorlands (SHMA 2008). A contributory factor is
the limited residential offer across the spectrum of the housing market, one of the main
SHMA recommendations identifying the requirement for ‘more executive housing in the
housing sectors shown to be disproportionately dominated by terraced dwellings’.
1.1.8 One of the principal objectives of the RENEW North Staffordshire Regeneration Partnership
Business Plan 2008 – 2011 in recognising the limited housing choice, is to provide a
diversified residential offer. Providing the right type of dwellings, in the right location and
environment will be key to addressing and reversing the trend of net population loss. An
important factor for competitiveness in the knowledge economy is the extent to which places
have a skilled, creative and entrepreneurial workforce. Employers will choose to locate partly
on the basis of where this workforce is located and therefore the residential offer must be
closely aligned with the aspirations of economically independent households.
1.1.9 We note that ‘top end of the market’ executive housing can also have a further significant
impact on the economy. The evidence suggests that residents of executive housing include a
high proportion of entrepreneurs, with a consequent high level of business start-ups. This
leads to establishment of new employment opportunities, often in locations convenient to the
home of the entrepreneur.
1.1.10 One of the NSRP Business Plan priorities, in providing a portfolio of high quality/specification
detached houses or luxury apartments, seeks to meet the aspirations of existing and future
residents on higher incomes, both in the interests of greater social inclusivity and to remove
a barrier to the pursuit of economic prosperity. A broader housing choice is essential to
accommodate the changing aspirations of the resident population and to retain graduates
and attract new economically active households into the area.
1.1.11 Current housing supply throughout areas of Stoke-on-Trent, Newcastle-under-Lyme and
Staffordshire Moorlands, reflect an earlier pattern of economic structure and development
that does not meet the current, nor future needs, for a balance of dwellings types and choice
and the need to develop mixed communities.
1.1.12 Much of the offer within the constituent authorities competes for skilled workforce and
economically independent households with a limited residential offer. Issues of deprivation,
worklessness and social exclusion are inextricably linked with poor quality housing and less
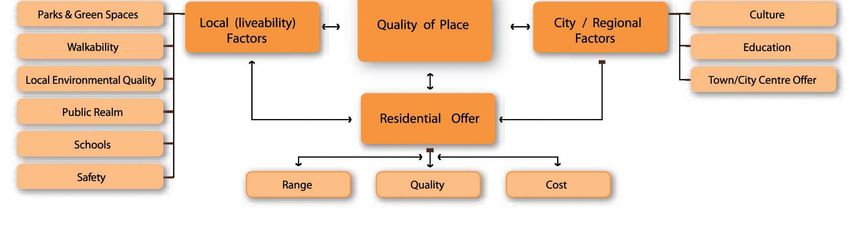
desirable environments. Therefore, an improved residential offer and quality of place is
essential to the creation of mixed and balanced communities and fundamental to improving
the economic performance of the area (RENEW NSPR BP).
1.1.13 Creating sustainable, mixed communities coupled with high design quality and place making
is a key part of the Government’s approach to housing and planning policy going forward.
Providing a quality residential offer is not about ‘gentrification’ alone, but about creating
quality places through new development and interventions in existing neighbourhoods to
provide a range of house types and tenures. It is the aim of RENEW and the NSRP that
opportunities are identified to address the need for provision of a broader mix of housing
supply across the intervention areas in the sub region.
1.1.14 This research provides an intelligence report examining the issues around the provision of
executive housing and developing a meaningful definition framed within a North Staffordshire
context. The report provides an examination of both the local and regional housing market (in
arc4 RENEW NSRP Executive Housing Market Research Sept 2010 5 of 80terms of depth of the potential market) and the planning supply context for the provision of
executive housing. The report focuses in particular at recent experience of developing
executive housing framed in the context of the local potential market demand, competing
sites, migration, travel to work patterns, sales performance and land/site supply.
1.1.15 Our perspective is holistic. We do not see development and the supply of housing in
isolation. As such, we have examined the objectives of recent spatial planning policy at both
the (now abolished) Regional Spatial Strategy and emerging Local Development Framework
levels. This research paper looks to test the potential demand and requirement for larger
executive developments within North Staffordshire.
1.1.16 Much has changed in the national and regional arenas since this report was commissioned,
including the election of the Coalition Government and its abolition of whole swathes of
regional governance including the Regional Development Agencies, Regional Assemblies
and planned regional Leaders’ Boards, together with Regional Spatial Strategies. Further
clarity around the new Local Economic Partnerships and the extent of their remit is awaited.
arc4 RENEW NSRP Executive Housing Market Research Sept 2010 6 of 80Section 2
Methodology
2.1 Methodology
2.1.1 The research methodology has been mainly desk-based, with primary input from discussions
with the client on previous work and telephone interviews with local agents and relevant
development stakeholders with specific delivery experience within this market. These include
officers from the local authority planning departments, developers (both specialist and
mainstream), estate and land agents. Linkages have also been drawn from feedback
received from the focus group work undertaken as part of the wider contract brief.
2.1.2 Stage I – Strategic policy context for housing delivery in North Staffordshire.
Note that in this report, unless specifically stated otherwise, the description “North
Staffordshire” is used to refer to the three Local Authorities that comprise the NSRP.
Consolidation and review of literature outlining strategic planning policy for housing delivery
in North Staffordshire, draws on the Local Development Frameworks, the (now abolished)
Regional Economic, Housing and Spatial Strategies and findings of the Strategic Housing
Market Assessment (SHMA). This is supplemented by a critique of the underlying vision for
residential development in North Staffordshire.
It is important that this analysis is provided in the context of the wider economic climate and
the likely impact upon development of any kind going forward. A shift in market conditions
and economic fundamentals has called into question the established development
framework that operated previously, shown to be dependent upon the availability of credit for
development and mortgage liquidity. Development across all market tenures now operates in
a constrained marketplace, therefore it is important that the research draws clear links to the
economic model update work for North Staffordshire being undertaken simultaneously by
Experian. Consideration of the wider economic environment will provide an indication of
potential quantum and viability for selected sites.
2.1.3 Stage II - Demand side trends
Market research of the local and sub-regional household profiles and secondary data
analysis to establish a target market definition, the potential pool of demand and its share of
the overall market. We have analysed population and household projections, migration and
travel-to-work patterns, including identifying key local employers identified as sources of
potential target market for this housing, demographic and household change and the findings
of the latest Strategic Housing Market Assessment. This provides the context on the current
and future demand profile for proposed executive housing development in North
Staffordshire.
2.1.4 Stage III – Supply side trends and review of the experience and impact of executive housing
development elsewhere
In this stage we examine historic completion rates by type of property (including new build
and conversions), outlining the relatively narrow supply within North Staffordshire in recent
years compared to neighbouring locations. This analysis includes discussions with the
arc4 RENEW NSRP Executive Housing Market Research Sept 2010 7 of 80respective planning departments to identify sources of existing property stock with potential
for delivering executive type housing.
We undertook an examination of future supply to ascertain competing areas and
developments through the SHLAA process, National Land Use Database schedule, Five
Year Land Supply and current outstanding permissions data.
Desk-based, case study review of experience and impact of executive housing development
in comparable housing markets. We appreciate that a comparable market to North
Staffordshire may not exist explicitly, however the key success factors can be identified from
executive housing development case studies and an analysis provided of the factors to be in
place to underpin development of this type in the North Staffordshire market.
This element primarily aims to consolidate understanding and provision of a workable
definition of executive housing in the North Staffordshire context. We have undertaken
previous analysis of executive housing case studies and are well aware that this does not
necessarily include volume-built, higher-end detached market housing. As noted above,
provided the right location and environment, executive housing may include;
• Mix of bespoke detached properties at low density ie, Wynard, Stockton-on-Tees
• Individual architect designed properties ie, Tutti Frutti Urban Splash, Manchester
• Self build developments ie, Ashley Vale, Bristol
• Environmentally sustainable developments ie, Accordia, Cambridge; Upton,
Northampton; Great Bow Yard, Somerset
• New build period townhouses ie, The Square, York
2.1.5 Stage IV – Site locations and agent interviews
Analysis of the strategic potential sites is supplemented with local agent interviews
examining the aspirations of those purchasing executive housing and areas of search for
such housing to understand the depth of the potential market.
2.2 Current Executive Housing Market
2.2.2 The first phase of the assessment investigates the extent of housing in the North
Staffordshire sub-region, which fits the broad definition of an Executive product. Several
secondary data sources were used to identify the extent of high property values and high
incomes. This has included:
• Council Tax banding information for 2008 (based on property valuations at
1991);
• Land registry property sale values;
• Household Income 2008 (Annual Survey of Hours and Earnings).
2.2.3 The following variables are identified; the proportions of properties in Band ‘E to H’, property
values ‘£350-500k, £500k-£750k, £750+’ and household incomes of ‘£900+pw and £1k+pw’.
Where data is available, results have been analysed on a number of geographical scales:
• Address level
arc4 RENEW NSRP Executive Housing Market Research Sept 2010 8 of 80• Postcode sector
• Lower SOAs
• Wards
2.2.4 This information has been triangulated to produce a series of maps and tables identifying the
spatial extent of the current executive housing markets and the numbers in the market.
2.2.5 The second phase of the assessment has involved identifying households from the ASHE
data 2008 who command sufficient incomes and access to equity or savings, therefore form
the primary target market for property deemed to be of executive housing standard. Detailed
analysis of the selected market profile looks at the current property and household
characteristics.
2.2.6 The third phase of the assessment was to define distinctive market typologies through a
process of qualitative and quantitative methods (see definition of executive housing below).
This process brings together selective property and household characteristics to define
executive housing products and demand behaviour.
2.2.7 A number of variables were used to develop market typologies. A series of profiles or short
case studies have been developed to illustrate these typologies with the context of North
Staffordshire and its surrounding area. A number of case study examples from a range of
national perspectives are provided in section 9.
2.3 Future Executive Housing Market
2.3.2 It is essential that the proposed market typologies are rigorously tested with housing
practitioners, who have a practical understanding of high value housing markets. A series of
interviews, market area observations, and discussions with a range of stakeholders has
taken place to test the emerging findings.
2.3.3 Aspirations for future development from the housing supplier and planning control
perspectives state the requirements necessary for future executive housing.
2.4 Research Framework
2.4.2 Our research approach is structured as follows and has been split into sections for ease of
access.
Section Topic Background review
Stage 1 Strategic policy context for housing
delivery in Stoke-on-Trent
Review of existing plans • Examination of latest regional and local • RSS, The Regional
and strategies planning strategy; Economic Strategy,
• Examination of latest regional and local NSRP Business Plan
economic strategy; 2008-11; SHMA, Stoke-
• Adopted Stoke-on-Trent and Newcastle- on-Trent AMR,
under-Lyme Core Strategy; Staffordshire Newcastle under Lyme
Moorlands Submission Core Strategy. AMR, Staffordshire
Moorlands AMR,
arc4 RENEW NSRP Executive Housing Market Research Sept 2010 9 of 80RENEW AMR 2008/09.
What is the existing position?
• Where are the high value dwellings • Land Registry house
located? price indices;
• Executive housing supply in the planning • Council Tax Register;
pipeline ie, benefit of detailed consent? • Mapping correlation of
• How do the constituent local authorities properties and earners
stand in valid comparison within NSHMA at ward and / or output
and to adjacent markets? area geographies;
• Where do current high earners live? • Latest NSHMA;
• Correlation between the two • ONS neighbourhoods;
• Supply pipeline data;
• Travel to work data
comparison of resident
and workplace based
incomes;
• Income data by Lower
Super Output Area /
ward;
• Focus group feedback;
• Estate agent feedback;
• Council planning
departments feedback.
Local housing market • Overview of local market trends and • Land Registry;
overview differentiation of local housing markets. • New build market data.
• Local economic drivers.
Demand analysis • Forecasts for current and future population • Population and
and household change; household projections;
• Drivers and dynamics of population and • Migration statistics into
household change; and within the Stoke
• Migration and travel to work trends; Housing Market area
• Socio-economic profiling; and the sub-region;
• What type of households? Neighbourhood • GDP statistics;
statistics analysis of socio-economic • Local economic drivers;
composition; • ACORN profiling;
• Demand for executive housing, fuelled by • Neighbourhood
demographic changes; Statistics and NOMIS;
• Where are the gaps between demand and • 2001 Census, ONS;
supply?; • Population estimates,
• Growth of working age population; ONS;
• Key areas of economic growth now and • Annual Survey of Hours
forecast; and Earnings;
• Potential constraints unique to the local • GIS mapping analysis.
market, lifestyle offer etc. • Focus group feedback
Supply analysis • What has been built? An overview of • Latest development
historic supply in the local authority market supply pipeline
in terms of size, number and spatial statistics;
arc4 RENEW NSRP Executive Housing Market Research Sept 2010 10 of 80location of executive housing; • Latest development
• What is being built? A review of planned capacity data;
schemes and those under construction in • Developer feedback
respect of outstanding planning • Local authority planning
permissions, SHLAA and National Land feedback.
Use Database;
• Locally determined growth strategy -
supply targets;
• What reasonable quantum of executive
housing should the local authorities be
aiming for?
• What is the gap between existing demand
and supply?
Where do the three local authorities want to
be?
• Current gap analysis between demand • Experian, ASHE;
and supply profile; • SHMA
• ‘Visions’ to be supplied by the respective • Council feedback and
local authorities emerging LDF
documents
arc4 RENEW NSRP Executive Housing Market Research Sept 2010 11 of 80Section 3
Executive Housing Market Definition
3.1 Introduction
3.1.1 Housing referred to as ‘executive’ is a vague market product and has eluded definitive
classification due to the many forms, densities, locations and contexts within which property
referred to as ‘executive’ can be found. Indeed the term is often used, somewhat
erroneously, to uplift the image of developments that would otherwise be classified as
volume built housing. The term ‘executive’ may be allocated to new build developments in
one location due to relative exclusivity in the context of resident household incomes, that
may not be regarded as distinct developments in more affluent locations. Furthermore the
term can be used dependent upon consumer perception and aspiration, in reference to new
build bespoke properties, gated communities or period properties.
3.1.2 The term ‘executive’ equates to the most desirable and commonly, most expensive property
in a particular location. Executive markets are locations that generally operate on a regional
basis, across regional housing markets due to their exclusivity, the operation of such not
confined to local authority boundaries. Purchasers of executive housing will often travel over
large distances to employment locations, due to the nature of the desired character of
residence.
3.1.3 In broad terms, executive housing is acknowledged as, ‘High quality accommodation in low
1
density, suited to the needs and aspirations of higher income households’.
3.1.4 The first aspect of this research is to establish a meaningful definition of executive housing in
the North Staffordshire market context. An executive housing market is dependent upon the
components of supply and demand. In these terms, a housing supply profile based on
property prices, property sizes, dwelling types, interior specifications, outside space and
location. A housing demand profile based on household income, equity and savings,
household type, household size, household needs, length of occupancy, access to
occupancy and business ownership.
3.1.5 Characteristics of an executive housing market would also include a clear linkage to the
national / international market, beneficial or at least low taxation, in terms of the location
choice of industry and employment opportunities most conducive to business leaders,
excellent environmental conditions, a contiguous executive or prime property market and
associated lifestyle offer (discussed in further detail below).
3.1.6 An executive housing market can be defined in a number of ways combining the property
value, but including a suite of elements such as price, density, design, location and
specification, in order to establish a meaningful definition. In addition to a price level, this
may include for example factors such as low density (eg, approximating five units per acre),
with large floor space in excess of 2,000sqft, offering facilities such as 4+ bedrooms, double
garages and ensuite bedrooms or luxury apartments in desirable locations. They can include
bespoke design and self-build and are generally in owner occupation.
1
Tomaney, J. Bradley, D. (2006). The economic role of mobile professional and creative workers and their housing residential
preferences: evidence from North East England. Nathanial Lichfield and Partners. Centre for Urban and Regional
Development Studies, University of Newcastle upon Tyne. Newcastle.
arc4 RENEW NSRP Executive Housing Market Research Sept 2010 12 of 803.1.7 It is appreciated that in many markets and normal market conditions, property regarded as
executive housing is likely to attract prices in excess £450,000. However a certain level of
discount has been factored into our analysis for Stoke, in terms of both council tax banding
and property pricing. This has been appropriate in order to capture the top end of the market
for comparable properties with those in the adjacent local authorities of North Staffordshire.
This approach has been informed by analysis of transaction levels across North Staffordshire
and interviews with local agents active across the area, listed in appendix F. Our analysis
therefore includes council tax banding E – H, rather than just G – H, to include the top end of
the residential markets in each LA.
3.1.8 In addition our analysis of the depth of the top end market in North Staffordshire has
identified disparities in achieved property values. Analysis of the depth of this market
represented by transaction activity identified a number of price bands.
3.1.9 As we outline in section four below there are a significantly higher number of transactions
recorded in Staffordshire Moorlands and Newcastle-under-Lyme for properties in excess of
£400,000 compared to Stoke. The justification for adopting a £400,000 threshold for upper
market housing is two-fold. Namely this property value reflects the council tax discount for
Stoke encompassing a comparable upper-end market within bands E-H. Secondly the
feedback from considerable focus group work with local agents and residents identified this
level at which properties were considered to be upper market in Stoke.
3.1.10 Therefore the value ranges we have identified and will use in this assessment of current
high-end property transactions include;
• £400 - £500K range covers the ‘very high end’ property stock in Stoke and ‘high
end’ property in Newcastle-under-Lyme and Staffordshire Moorlands;
• £500 - £750K range covers the ‘exceptional and exclusive’ properties in Stoke
and the ‘very high end’ properties in Newcastle-under-Lyme and Staffordshire
Moorlands;
• £750K+ covers the ‘exceptional and exclusive’ properties in Newcastle-under-
Lyme and Staffordshire Moorlands.
3.1.11 Below we examine the current upper end housing offer demand in terms of both transaction
levels and housing type. This will inform the recommendations as to the housing typologies
and characteristics comprising a conducive ‘Quality of Place’ and residential offer in our case
study section. An explanation of the relationship between these aspects is discussed in
section 9.
arc4 RENEW NSRP Executive Housing Market Research Sept 2010 13 of 80Section 4
Executive Housing Market Assessment
Current Executive Housing Market
4.1.1 As Table 4.1 illustrates the buying activity of detached properties in the three local authorities
of North Staffordshire over the last three years highlights properties commanding prices in
excess of £750,000 and £1M in Newcastle-under-Lyme and Staffordshire Moorlands. In
comparison the top end of the Stoke market is represented by a market high of 0.9% during
2008 of between £500,000 - £600, 000 (Land Registry, Q2 2009).
4.1.2 The analysis has focussed upon detached property transactions due to nominal levels of
activity in the higher price categories for other property types such as flats, semi-detached
and terraced properties. We appreciate that in certain markets the executive market has the
potential to include properties of these types, such as prime location flats and townhouses.
We identify the current demand levels for these alternative housing types in the higher price
bands in section 4.2 below.
Table 4.1: Buying activity detached properties North Staffordshire 2007 – 2009 to date
Stoke 2007 2008 2009
Nos % Nos % Nos %
Under 100K 29 2.9% 26 4.8% 7 5.5%
100 -150K 215 21.7% 114 20.9% 55 43.0%
150 - 200 347 34.9% 200 36.6% 49 38.3%
200 - 300 283 28.5% 147 26.9% 13 10.2%
300 - 400 76 7.7% 40 7.3% 3 2.3%
400 - 500 38 3.8% 14 2.6% 1 0.8%
500-600 5 0.5% 5 0.9% 0 0.0%
Total 993 100.0% 546 100.0% 128 100.0%
Newcastle-under-Lyme 2007 2008 2009
Nos % Nos % Nos %
Under 100K 7 1.4% 4 1.2% 4 3.8%
100 -150K 63 12.8% 45 13.4% 18 17.0%
150 - 200 211 42.7% 117 34.9% 30 28.3%
200 - 300 132 26.7% 103 30.7% 39 36.8%
300 - 400 52 10.5% 48 14.3% 9 8.5%
400 - 500 21 4.3% 7 2.1% 4 3.8%
500-750 7 1.4% 10 3.0% 1 0.9%
750-1M 1 0.2% 0 0.0% 0 0.0%
1M+ 0 0 1 0.3% 1 0.9%
Total 494 100.0% 335 100.0% 106 100.0%
Staff Moors 2007 2008 2009
Nos % Nos % Nos %
Under 100K 9 1.2% 6 1.8% 4 3.5%
100 -150K 232 30.4% 40 11.9% 23 20.4%
150 - 200 174 22.8% 96 28.6% 27 23.9%
200 - 300 221 29.0% 128 38.1% 40 35.4%
300 - 400 81 10.6% 41 12.2% 12 10.6%
400 - 500 32 4.2% 19 5.7% 4 3.5%
500-750 12 1.6% 6 1.8% 3 2.7%
arc4 RENEW NSRP Executive Housing Market Research Sept 2010 14 of 80750-1M 1 0.1% 0 0.0% 0 0.0%
1M+ 1 0.1% 0 0.0% 0 0.0%
Total 763 100.0% 336 100.0% 113 100.0%
Source: Land Registry Q2 2009
4.1.3 As Table 4.1 illustrates, at the height of the property market, the top 4% of transactions in
Stoke were recorded above £400,000, characterising an exclusive executive housing market.
Comparable levels of transactions in Newcastle-under-Lyme and Staffordshire Moorlands
are recorded between the £500 - £750,000 price categories, with a greater representation of
transactions recorded in these local authorities in the uppermost price bands.
Table 4.2: Percentage of properties recorded within respective council tax bands
Council tax bands
LA A B C D E F G H Total E-H F-H
Stoke-on- 62.0 19.5 12.5 3.9 1.5 0.4 0.1 0.0 100.0 2.0 0.6
Trent
Newcastle- 44.8 18.0 19.8 7.8 4.8 3.1 1.7 0.1 100.0 9.6 4.8
under-Lyme
Staffordshire 22.0 23.7 24.5 14.1 9.6 4.3 1.8 0.1 100.0 15.7 6.2
Moorlands
Total 49.4 20.0 16.8 7.0 4.0 1.9 0.8 0.1 100.0 6.8 2.8
Source: Council tax records RENEW
4.1.4 Table 4.2 illustrates the respective distribution of properties across North Staffordshire by
council tax banding. Reflecting the transaction activity in Table 4.1 both Newcastle-under-
Lyme and Staffordshire Moorlands record higher levels of stock within the higher tax bands
compared to Stoke. A full breakdown of properties by CT band and ward is provided in
Appendix A and B. This data has been compared to respective household income data by
ward to identify the most conducive locations for potential executive housing delivery in
terms of a target market.
4.1.5 Council tax banding classifies properties from band A (properties with the lowest tax rating)
to band H (highest tax rating) in accordance with the properties value at the time of
assessment. A summary of the distribution of council tax band classifications, across the
North Staffordshire housing market, is shown in Table 4.2 and a full breakdown by ward in
Appendix A. However in terms of the target bands of E – H, a total of 2,273 properties were
identified within these bands in Stoke, compared to more than double at 5,107 properties
within Newcastle-under-Lyme and a further 6,649 properties within Staffordshire Moorlands.
4.1.6 The disparities become even greater when considering the bands F – H, with 617 properties
in Stoke compared to a more substantial 2,573 in Newcastle-under-Lyme and 2,613 within
Staffordshire Moorlands. Properties within council tax bands F – H account for just 0.6% of
all properties within Stoke, compared to 4.8% of properties in Newcastle-under-Lyme and
6.2% in Staffordshire Moorlands. There is a justifiable requirement to factor in a ‘banding
discount’ in terms of analysis in regards ‘top-end’ of the respective markets. The transaction
and council tax data above indicates that high value housing offers an insignificant
contribution to the Stoke housing market in particular.
4.1.7 In terms of ward distribution of higher value properties as illustrated in full in Appendix A and
B, Table 4.3 identifies the top ten Stoke wards with the highest representation of properties
arc4 RENEW NSRP Executive Housing Market Research Sept 2010 15 of 80in the uppermost council tax bands. The three wards of Trentham and Hanford (30%), Meir
Park and Sandon (16.9%) and Abbey Green (11.2%) contain almost two-thirds of all Stoke
properties within bands E – H, at 58.1%.
Table 4.3: Top ten Stoke wards recording highest valued properties council tax bands E - H
Ward name E F G H E-H Total (%) F-H Total (%)
Abbey Green 3.4 1.1 0.1 0.0 4.7 1.3
Blurton 2.2 0.9 0.1 0.0 3.2 1.0
Chell and Packmoor 0.8 0.0 0.0 0.0 1.0 0.1
East Valley 1.8 0.9 0.1 0.0 2.8 1.0
Hartshill and Penkhull 1.5 0.4 0.1 0.2 2.1 0.7
Longton South 1.9 0.3 0.1 0.0 2.3 0.4
Meir Park and Sandon 4.8 2.1 0.2 0.0 7.1 2.3
Northwood and Birches Head 1.5 0.0 0.0 0.0 1.5 0.0
Norton and Bradeley 0.9 0.1 0.1 0.0 1.2 0.2
Trentham and Hanford 9.6 2.2 0.7 0.2 12.6 3.1
Source: RENEW
4.1.8 In terms of ward distribution of higher value properties as illustrated in full in Appendix A and
B, Table 4.4 identifies the top ten Newcastle-under-Lyme wards with the highest
representation of properties in the uppermost council tax bands. The three wards of
Loggerheads and Whitmore (25.2%), Westlands (16.6%) and Keele (15.7%) contain almost
half of all Newcastle-under-Lyme properties within bands E – H, at 47.5%.
Table 4.4: Top ten Newcastle-under-Lyme wards recording highest valued properties council tax bands E – H
Ward name E F G H E-H F-H
Audley and Bignall End 4.3 1.3 0.3 0.0 5.9 1.6
Halmerend 12.1 8.8 3.0 0.4 24.2 12.1
Keele 18.2 12.3 5.1 1.9 37.6 19.4
Loggerheads and Whitmore 24.6 17.8 17.2 0.4 60.0 35.4
Madeley 9.3 7.5 1.7 0.2 18.7 9.3
May Bank 2.2 1.7 1.3 0.0 5.2 3.0
Newchapel 3.1 1.1 0.1 0.0 4.3 1.2
Seabridge 11.2 2.5 0.2 0.0 13.9 2.7
Thistleberry 8.1 4.1 0.7 0.0 13.0 4.9
Westlands 14.2 18.0 7.3 0.0 39.6 25.4
Source: RENEW
4.1.9 In terms of ward distribution of higher value properties as illustrated in full in Appendix A and
B, Table 4.5 identifies the top ten Staffordshire Moorlands wards with the highest
representation of properties in the uppermost council tax bands. The three wards of Horton
(12.1%), Dane (10.5%) and Bagnall and Stanley (9.0%) contain over one-third of all
Staffordshire Moorlands properties within bands E – H, at 31.6%. As indicated in Appendix B
map B3, the distribution of higher valued properties is more widespread across the authority
in comparison to the pockets of higher value stock in Newcastle-under-Lyme and in far fewer
proportions in Stoke.
Table 4.5: Top ten Staffordshire Moorlands wards recording highest valued properties council tax bands E – H
Ward name E F G H E-H F-H
Alton 24.1 10.4 4.8 0.3 39.6 15.6
arc4 RENEW NSRP Executive Housing Market Research Sept 2010 16 of 80Bagnall and Stanley 22.1 19.4 9.1 0.0 50.6 28.5
Biddulph North 14.0 4.5 2.6 0.0 21.1 7.1
Caverswall 14.9 7.2 4.2 0.1 26.5 11.6
Cheddleton 13.2 6.6 1.7 0.2 21.7 8.5
Dane 26.2 22.7 9.2 0.9 59.0 32.8
Hamps Valley 22.2 8.9 4.1 0.3 35.6 13.3
Horton 21.5 27.0 19.5 0.4 68.4 46.9
Ipstones 19.1 7.8 2.6 0.1 29.6 10.5
Manifold 26.7 10.1 4.0 0.0 40.8 14.1
Source: RENEW
4.1.10 The distribution of properties in council tax bands E – H is shown in Appendix B1 – B3. It is
clear that higher value property makes a nominal contribution to the overall housing stock in
Stoke as a local authority. In Newcastle-under-Lyme, there appears to be a clear distinction
between the north and east of the local authority with a low representation of higher valued
stock compared to the south in particular in Loggerheads and Whitmore, Keele and
Westlands and west such as in Halmerend and Madeley.
4.1.11 Higher value property appears to represent a greater proportion and wider distribution of
property stock in Staffordshire Moorlands, particularly towards the east of the district in the
National Park (Appendix Map B3).
4.2 Current ‘high-end’ property market context
4.2.1 Land Registry sales data was examined for the period Q1 2005 – Q2 2009. The dataset
comprises 31,702 individual residential sales records from open market transactions in the
three local authorities of North Staffordshire, over the four-year period. By way of comparison
the rate of private sector turnover is far greater in Stoke at 18,839 transactions over this
period, compared to 7,139 in Newcastle-under-Lyme and 5,724 sales in Staffordshire
Moorlands within this period.
4.2.2 In terms of analysing the depth of the high-end property market in North Staffordshire,
unsurprisingly a significantly higher number of transactions have been recorded in
Staffordshire Moorlands and Newcastle-under-Lyme for properties in excess of £400,000
compared to Stoke. The justification for adopting a £400,000 threshold for upper market
housing is two-fold. Namely this property value reflects the council tax discount for Stoke
encompassing a comparable upper-end market within bands E-H. Secondly the feedback
from considerable focus group work with local agents and residents identified this level at
which properties were considered to be in the highest market.
4.2.3 The total number of recorded transactions above this threshold between Q1 2007 and Q2
2009 was 63 sales in Stoke. All sales were existing stock apart from two new build sales and
all apart from three being detached properties. Table 4.6 identifies those ‘high-end’ non-
detached property sales over this period, illustrating the constrained demand for upper
market housing typologies from the traditional detached type. Each transaction was recorded
as an existing semi-detached property within a suburban / rural location.
Table 4.6: Non-detached upper market property transactions - Stoke
Price Type New Build / Existing Post Code Ward Name Rural / Suburban / Urban
£370,000 Semi Existing ST3 5YD Longton North Suburban / Rural
£379,950 Semi Existing ST4 8XJ Trentham & Hanford Suburban / Rural
arc4 RENEW NSRP Executive Housing Market Research Sept 2010 17 of 80£395,000 Semi Existing ST2 9DD Berryhill & Hanley East Suburban / Rural
Source: RENEW, Land Registry
4.2.4 In Newcastle-under-Lyme the number of transactions above this threshold was 53. All sales
were existing stock apart from four new build sales and all sales except 17 being detached
properties, 9 semi-detached and 8 terraced. Table 4.7 identifies those ‘high-end’ non-
detached property sales over this period, illustrating the depth of upper market housing
typologies from the traditional detached type. Each transaction was recorded as an existing
property apart from two new builds, the majority within a rural / suburban location. Notably
there is an equal representation of larger terraced / townhouse and semi-detached
properties.
Table 4.7: Non-detached upper market property transactions – Newcastle-under-Lyme
Price Type New Build / Existing Post Code Ward Name Rural / Suburban / Urban
£750,000 T Existing ST5 0QW May Bank Suburban
Loggerheads and
£760,000 T Existing TF9 4HE Whitmore Rural
Loggerheads and
£775,000 S Existing ST5 5HB Whitmore Rural
Loggerheads and
£595,000 T Existing TF9 2PA Whitmore Rural
Loggerheads and
£495,000 T Existing TF9 2PA Whitmore Rural
£500,000 S Existing ST5 0QN May Bank Urban / Suburban
Loggerheads and
£520,000 T New Build TF9 4NA Whitmore Rural
Loggerheads and
£350,000 T Existing TF9 4HJ Whitmore Rural
£350,000 S Existing CW3 9QL Madeley Rural
£355,000 S Existing CW3 9AN Halmerend Rural / Suburban
£375,000 S Existing ST5 3LT Westlands Suburban / Urban
£377,500 S Existing ST5 1DP Town Urban / Suburban
Loggerheads and
£385,000 S Existing TF9 2QH Whitmore Rural
Loggerheads and
£389,950 S Existing TF9 4NB Whitmore Rural
£397,000 S New Build ST5 3JG Westlands Rural / Suburban
£429,000 T Existing ST5 2NF Thistleberry Suburban
£475,000 T Existing ST5 3GZ Knutton and Silverdale Rural / Suburban
Source: RENEW, Land Registry
4.2.5 In Staffordshire Moorlands 78 transactions were recorded above £400,000. All sales were
existing stock apart from seven new build sales and all sales except 39 being for detached
properties. Table 4.8 identifies those ‘high-end’ non-detached property sales over this period,
illustrating the depth of upper market housing typologies from the traditional detached type.
Each transaction was recorded as an existing property apart from two new builds, the
majority within a rural / suburban location. Notably there is an equal representation of larger
terraced / townhouse and semi-detached properties, with only one recorded sale for a flat
within this market.
arc4 RENEW NSRP Executive Housing Market Research Sept 2010 18 of 80Table 4.8: Non-detached upper market property transactions – Staffordshire Moorlands
Price Type New Build / Existing Post Code Ward Name Rural / Suburban / Urban
£370,000 T Existing ST13 5LR Leek East Rural / Suburban
£440,000 S Existing ST13 8JS Leek North Rural / Suburban
£365,000 S Existing ST13 8DL Leek West Suburban / Rural
£495,000 S Existing ST10 4JH Checkley Rural
£980,000 S Existing CW12 3QJ Horton Rural
£370,000 T Existing ST9 9PS Bagnall and Stanley Rural
£390,000 T Existing SK17 0NZ Manifold Rural
£360,000 S Existing ST9 9NJ Bagnall and Stanley Rural
£400,000 S Existing ST13 5PA Leek South Suburban
£370,000 S Existing ST13 7EA Cheddleton Rural
£400,000 S Existing ST11 9BG Forsbrook Rural
£450,000 T Existing ST9 9NS Bagnall and Stanley Rural
£385,000 T Existing ST13 6AB Leek North Urban
£481,000 S Existing ST10 4BN Alton Rural
£364,000 T Existing ST9 9LX Bagnall and Stanley Rural
£570,000 S Existing ST8 6QP Biddulph North Suburban
£670,000 F New Build DE6 2FR Hamps Valley Rural
£365,000 S Existing ST11 9HQ Forsbrook Suburban / Rural
£404,000 T Existing ST9 9QF Horton Rural
£950,000 S Existing SK11 0RF Dane Rural
£357,000 S Existing ST13 5SB Leek East Suburban / Rural
£480,000 S Existing ST13 8SB Leek North Rural
£430,000 S Existing ST13 5EZ Leek North Urban
£395,000 T Existing ST13 8SA Leek North Rural
£375,000 T Existing ST13 7AL Leek South Rural
£590,000 S Existing ST13 7QZ Hamps Valley Rural
£500,000 T Existing ST10 2BA Churnet Rural
£370,000 T Existing ST13 8RN Horton Rural
£600,000 T Existing ST13 5RD Leek South Rural
£410,000 S New Build ST10 3BQ Alton Rural
£440,000 T Existing ST9 0BA Cheddleton Rural
£425,000 T Existing ST8 7PS Biddulph South Rural
£430,000 T Existing ST8 7RS Biddulph North Rural
£660,000 S Existing ST10 4AP Alton Rural
£385,000 S Existing ST10 4BH Alton Rural
£595,000 S Existing ST13 8SH Dane Rural
Brown Edge and
£350,000 S Existing ST9 9DY Endon Rural
£350,000 S Existing ST13 8PU Horton Rural
Source: RENEW, Land Registry
4.2.6 As the tables above indicate there is a considerable paucity of new build executive property
supply on the current market throughout the three authorities of North Staffordshire. The total
number of new build sales in this sector across the three authorities being 13 sales over this
period. The main focus of transaction activity within the high end market recorded within
existing properties within a rural and suburban location. This feature of the North
Staffordshire executive market is highlighted within section 6 agent and developer interviews
arc4 RENEW NSRP Executive Housing Market Research Sept 2010 19 of 80below. Illustrating a distinct absence of new build property currently on the market, the
highest priced new build stock in North Staffordshire is £259,995, volume-built and not
representative of an executive market according to the definitions provided.
4.2.7 The value ranges used in this assessment of current high-end property transactions include;
• £400 - £500K range covers the ‘very high end’ property stock in Stoke and ‘high
end’ property in Newcastle-under-Lyme and Staffordshire Moorlands;
• £500 - £750K range covers the ‘exceptional and exclusive’ properties in Stoke
and the ‘very high end’ properties in Newcastle-under-Lyme and Staffordshire
Moorlands;
• £750K+ covers the ‘exceptional and exclusive’ properties in Newcastle-under-
Lyme and Staffordshire Moorlands.
4.2.8 Identified property sales within the three high-end value ranges are broken down by ward
and local authority in Tables 4.9 – 4.11 below.
Table 4.9: High end house price transactions by ward - Stoke
Ward name £400 - £500 - £750K+
£500K £750K
Abbey Green 2
Bentilee and Townsend 1
Berryhill and Hanley East 1
Blurton 1
Burslem North 1
East Valley 4
Longton North 1
Meir Park and Sandon 1
Northwood and Birches Head 1
Stoke and Trent Vale 1
Trentham and Hanford 9 1
Source: Land Registry, RENEW
4.2.9 As illustrated in Table 4.9, only one property could be classified as ‘exclusive and
exceptional’ in terms of price, this property recorded in the Trentham and Hanford ward. As
we have illustrated elsewhere, this ward comprises the highest proportion of private sector
stock in the highest council tax bands and the highest average household income of Stoke
wards.
4.2.10 Stoke has a highly constrained supply of high value housing. Indeed the fact that all but one
property has been sold for sub-£500,000 would indicate that compared to some higher value
areas an executive housing product does not exist.
4.2.11 Table 4.10 illustrates the higher representation of high value properties within Newcastle-
under-Lyme. A total of 130 transactions are recorded within the ‘high-end’ range, 18 sales
within the ‘very-high’ range and 6 within the ‘exceptional’ range. These transactions are
recorded within the ward of Loggerheads and Whitmore and include a sale in excess of
£1.1M. The wards of Westlands, Halmerend and May Bank also record representation within
the ‘very high’ range.
Table 4.10: High end house price transactions by ward - Newcastle-under-Lyme
arc4 RENEW NSRP Executive Housing Market Research Sept 2010 20 of 80Ward name £400 - £500 - £750K+
£500K £750K
Audley and Bignall End 2
Halmerend 9 3
Keele 1
Knutton and Silverdale 1
Loggerheads and Whitmore 42 7 6
Madeley 3 1
May Bank 5 2
Newchapel 3
Seabridge 3
Thistleberry 5 1
Town 3
Westlands 27 4
Wolstanton 1
Source: Land Registry, RENEW
4.2.12 Table 4.11 illustrates the higher representation of high value properties within Staffordshire
Moorlands. A total of 145 transactions are recorded within the ‘high-end’ range, 30 sales
within the ‘very-high’ range and 8 within the ‘exceptional’ range. These transactions are
recorded within six wards and include sales in excess of £1M.
Table 4.11: High end house price transactions by ward – Staffordshire Moorlands
Ward name £400 - £500 - £750K+
£500K £750K
Alton 7 1
Bagnall and Stanley 10 1
Biddulph Moor 2
Biddulph North 8 2 1
Biddulph South 1
Brown Edge and Endon 5 1
Caverswall 2 1
Cheadle South East 1
Cheadle West 1
Checkley 5 1 1
Cheddleton 12
Churnet 5 4
Dane 6 2 1
Forsbrook 9 1
Halmerend 1
Hamps Valley 6 2 2
Horton 15 9 1
Ipstones 8
Leek East 8
Leek North 9 1
Leek South 7 1
Leek West 3
Manifold 10 3 2
Tutbury and Outwoods 1
arc4 RENEW NSRP Executive Housing Market Research Sept 2010 21 of 80Werrington 3
Source: Land Registry, RENEW
4.3 Wider Housing Reference Area
4.3.1 As the research identifies, the market for executive housing operates over a wide area,
larger than housing markets are normally defined. The market is often described as
regional, but as North Staffordshire sits on the boundary of two regions it is appropriate to
consider a cross-regional wider market area. Following consultation, we based it on the
wider reference area for the North Staffordshire housing market and included the (pre-
reorganisation) LA areas of Crewe and Nantwich, Congleton, Stafford and North Shropshire.
.
4.3.2 Table 4.12 illustrates the buying activity of detached properties in this wider housing
reference area over the last three years. The number of properties commanding prices in
excess of £500,000 - £1M in North Shropshire represents 4.5% of the total market, higher
than that in Newcastle-under-Lyme and Staffordshire Moorlands. The volume of transactions
at £400K-£500K records almost 10% of the total market share of detached sales. In terms of
sales volumes, North Shropshire is comparable with Newcastle-under-Lyme
4.3.3 In terms of transaction volumes, Stafford records a considerable number of sales within the
higher price bands, comparable with, though slightly higher in numerical terms with
Staffordshire Moorlands over the three-year period. Comparable levels of transactions in the
higher price categories are recorded, including individual exceptional priced sales in excess
of £1M.
4.3.4 The analysis has focussed upon detached property transactions due to nominal levels of
activity in the higher price categories for other property types such as flats, semi-detached
and terraced properties. In Stafford sales of these property types recorded over this three
year period were 8 semi-detached between £400-£500K, no flats and 4townhouse / terraced
properties. No transactions recorded for these types over £500,000.
Table 4.12: Buying activity wider Housing Reference Area 2007 – 2009 to date
North Shropshire 2007 2008 2009
Nos % Nos % Nos %
Under 100K 5 1.2% 3 1.2% 2 2.5%
100 -150K 20 4.8% 12 4.8% 9 11.3%
150 - 200 103 24.8% 55 21.9% 26 32.5%
200 - 300 159 38.3% 105 41.8% 25 31.3%
300 - 400 80 19.3% 42 16.7% 10 12.5%
400 - 500 30 7.2% 24 9.6% 7 8.8%
500-750 16 3.9% 8 3.2% 1 1.3%
750-1M 2 0.5% 2 0.8% 0 0.0%
Total 415 100.0% 251 100.0% 80 100.0%
Stafford 2007 2008 2009
Nos % Nos % Nos %
Under 100K 5 0.8% 2 0.6% 3 1.9%
100 -150K 27 4.1% 13 3.7% 23 14.6%
150 - 200 147 22.3% 75 21.1% 39 24.8%
200 - 300 301 45.7% 160 45.1% 59 37.6%
300 - 400 120 18.2% 60 16.9% 19 12.1%
arc4 RENEW NSRP Executive Housing Market Research Sept 2010 22 of 80400 - 500 38 5.8% 21 5.9% 9 5.7%
500-750 17 2.6% 20 5.6% 5 3.2%
750-1M 1 0.2% 3 0.8% 0 0.0%
1M+ 2 0.3% 1 0.3% 0 0.0%
Total 658 100.0% 355 100.0% 157 100.0%
Congleton 2007 2008 2009
Nos % Nos % Nos %
Under 100K 7 1.0% 3 1.0% 3 2.9%
100 -150K 16 2.4% 19 6.2% 17 16.2%
150 - 200 112 16.7% 51 16.7% 33 31.4%
200 - 300 339 50.7% 146 47.9% 36 34.3%
300 - 400 112 16.7% 52 17.0% 9 8.6%
400 - 500 49 7.3% 21 6.9% 4 3.8%
500-750 31 4.6% 12 3.9% 2 1.9%
750-1M 3 0.4% 0 0.0% 1 1.0%
1M+ 0 0.0% 1 0.3% 0 0.0%
Total 669 100.0% 305 100.0% 105 100.0%
Crewe and Nantwich 2007 2008 2009
Nos % Nos % Nos %
Under 100K 2 0.3% 4 1.3% 3 2.3%
100 -150K 52 8.3% 41 13.0% 22 17.2%
150 - 200 170 27.0% 86 27.3% 31 24.2%
200 - 300 224 35.6% 104 33.0% 37 28.9%
300 - 400 87 13.8% 46 14.6% 21 16.4%
400 - 500 70 11.1% 15 4.8% 12 9.4%
500-750 20 3.2% 15 4.8% 2 1.6%
750-1M 2 0.3% 4 1.3% 0 0.0%
1M+ 2 0.3% 0 0.0% 0 0.0%
Total 629 100.0% 315 100.0% 128 100.0%
Source: Land Registry Q2 2009
4.3.5 As Table 4.12 illustrates, the buying activity of detached properties in the wider South
Cheshire area incorporating Congleton and Crewe and Nantwich over the last three years
has declined significantly in line with the wider market trends. In Congleton, in terms of
absolute transaction levels and distribution of stock, similar trends are drawn with
Staffordshire Moorlands. However in both Congleton and Crewe and Nantwich a higher
concentration of sales are recorded in the mid-range executive properties namely £400K -
£500K price band.
4.3.6 The analysis of the extent of the respective executive markets across the wider housing
market reference area identifies the comparative lack of housing being sold within this sector
in Stoke-on-Trent in particular. The majority of transactions at this level are recorded for
existing detached properties.
4.3.7 The overall position is shown in Table 4.13. To give a snapshot, it is probably reasonable to
consider the annual level of transactions at prices of £500k and over, based on 2007 and
2008. This covers a year that had buoyant activity and one of declining activity. The figures
for the first half of 2009 are much lower, and represent a depressed rather than a normal
market. On this basis, there are
arc4 RENEW NSRP Executive Housing Market Research Sept 2010 23 of 80An average of 106 sales at the high end of the market across the wider sub-regional
area
Of these 25 are in North Staffordshire and 5 in Stoke.
Table 4.13: Summary of executive housing market sales across wider reference area
LA in Housing reference 2007 – 2008 (2007- 2009) 2007 - 2008 (2007- 2009) All 2007- Per annum Per annum
area 2009 Q2 based on (2007-2009
2007-8 Q2)
£500K- Over £750K
£750k
North Shropshire 24 (25) 4 (4) 29 14 11.6
Stafford 37 (42) 7 (7) 49 22 19
Congleton 43 (43) 4 (5) 48 23 19
Crewe and Nantwich 35 (37) 8 (8) 45 22 18
Staffordshire Moorlands 18 (21) 2 (2) 23 10 9.2
Newcastle-under-Lyme 17 (18) 2 (3) 21 10 8.4
Stoke-on-Trent 10 (0) 0 (0) 10 5 4
Total in reference area 184 (198) 27 (29) 227 106 91
Source: Land Registry Q2 2009
arc4 RENEW NSRP Executive Housing Market Research Sept 2010 24 of 80Section 5
Policy Context
5.1 National policy context
5.1.1 The one issue that dominates all others in the UK housing market at the current time is that
there is an underlying undersupply of the correct housing to meet demand. Demand has
increased substantially over recent years through demographic and cultural shifts, smaller
household sizes, increased life expectancy, immigration and rising wealth. Over the past
decade house building has simply not kept pace, latest CLG figures reveal 133,710
completions during 2008 against a national target of 240,000.
5.1.2 One of the consequences of this imbalance has been to contribute to the extent that house
prices have risen dramatically over the last five years. In addition the cost differentials
between tenures has risen to such a level that many households are trapped within the
rented sector. For example, the ability for households in social rented accommodation to
exercise any choice within the market is heavily restricted and first time buyer loans are
currently at historically low levels.
5.1.3 The former Government’s policy solution to the perceived housing ‘crisis’ was contained
within the 2007 Housing Green Paper, which set ambitious targets for the volume of future
house building in England. The Green paper proposed the delivery of three million homes by
2020. Meeting this 240,000 unit per annum target will be a significant challenge for both the
development industry and the planning system and as such the then Government stated that
policy would aim to move beyond supply and demand issues. The objective was to loosen
the housing market and enable households to move between different tenures more easily at
different life stages. The future direction of government policy on housing, beyond the very
sketchy outlines in the Coalition Government agreement remains to be clarified.
How does lower density executive housing provision within North Staffordshire fit within the
strategic planning framework for North Staffordshire and the wider sub-region?
5.1.4 Stoke, like other local authorities, is currently in a period of transition from the current
Structure Plan planning framework to the emerging Local Development Framework. Local
Development Frameworks are designed to promote a proactive approach to managing and
facilitating development. LDF’s differ considerably to previous spatial planning documents in
that they are continuous and fluid and are designed to be driven by an overall vision for
development.
5.1.5 The North Staffordshire Regeneration Partnership Business Plan establishes the aim to
promote and develop a quality housing range and offer, as part of an over-arching ambition
to create sustainable communities and encourage economic growth. This mission statement
on the sub-regional level reflects a series of national and regional policy drivers.
Planning Policy Statement 3: Housing
5.1.6 PPS3 sets out the Government’s national planning policy framework for delivering the
Government’s housing objectives. PPS3 has been developed in response to the Barker
Review of Housing Supply in March 2004. The proposals draw on a range of research and
consultation exercises. The underlying objective of PPS3 is to initiate the necessary step
change in housing delivery to meet the emphasis on increasing supply. The Government
arc4 RENEW NSRP Executive Housing Market Research Sept 2010 25 of 80You can also read