Renewable and Sustainable Energy Reviews
←
→
Page content transcription
If your browser does not render page correctly, please read the page content below
Renewable and Sustainable Energy Reviews 143 (2021) 110913
Contents lists available at ScienceDirect
Renewable and Sustainable Energy Reviews
journal homepage: http://www.elsevier.com/locate/rser
Electric vehicles and charging infrastructure in Turkey: An overview
Ömer Gönül a, b, A. Can Duman a, b, Önder Güler a, *
a
Istanbul Technical University, Energy Institute, Ayazaga Campus, 34469, Maslak, İstanbul, Turkey
b
Turkish-German University, Department of Energy Science and Technology, 34820, Beykoz-Istanbul, Turkey
A R T I C L E I N F O A B S T R A C T
Keywords: The depletion of fossil resources, energy dependency, increase in fuel costs and environmental concerns caused
Electric vehicle (EV) by fossil fuel vehicles, along with the advances in battery technology and their manufacturing processes have
Charging station promoted a transition towards electric vehicles (EV). Depending on inner and external factors, some countries
Renewable integration
fastly adopted the new technology, whereas others act more slowly. In this study, an overview of Turkey’s
Energy policy
Vehicle to grid (V2G)
position in EV technology is presented. The current EV, charging infrastructure, and battery market, as well as
Turkey EV-related regulations, research and development (R&D) activities, and industry in the country are evaluated. An
EV charging station (EVCS) density map of Turkey is formed to illustrate the deficiencies in the existing charging
infrastructure. The challenges and opportunities in the country are discussed and presented in the form of a
Strengths, Weaknesses, Opportunities, and Threats (SWOT) analysis and the study is concluded with a list of
recommendations. Currently, the public in Turkey is focused on the state-supported “local brand EV” project.
However, the acceptance of EVs is still low in the country. To that end, social awareness-raising activities,
especially electric public transportation and electric public fleets, should be promoted for EVs to achieve their
higher visibility. The EVCS infrastructure should be further expanded in the eastern part of Turkey and further
steps should be taken regarding EV/EVCS-related incentives.
1. Introduction with no gasoline engine. The battery power is used to drive an electric
motor and onboard electronics. A PHEV consists of an electric motor
Today, whether passenger or commercial, the vast majority of ve with a battery and a gasoline engine. The battery energy is both supplied
hicles are fossil-fueled. The total number of vehicles worldwide was by grid power and regenerative brakes. An HEV contains an electric
1.282 billion in 2015 (947 million passengers, 335 million commercial) motor and a gasoline engine. Unlike a PHEV, HEV battery connected to
and this figure is expected to reach 2 billion by 2030 [1,2]. An average of the electric motor is only charged by regenerative braking [8].
93.8 million vehicles was produced annually between 2014 and 2018 Despite their high costs today, BEVs are reported to become
worldwide [3,4]. The bulk of the production belongs to internal com competitive to ICEVs on a life cycle basis by 2030 [2]. Although larger
bustion engine vehicles (ICEVs), which are a large source of CO2 emis sales shares of PHEVs than BEVs are expected in the short-term pro
sions. Today, approximately 20% of the total CO2 emissions in the world jections (until 2030), the picture is not clear for the medium-to long-
arise from the transportation sector and 71% of the transportation sector term [9]. Yet, current literature reviews suggest that BEVs and PHEVs
is due to road transportation [5,6]. In this regard, many manufacturers have higher potential than HEVs to constitute our next generation of
continue to work on integrating energy recovery and carbon emission transportation [10].
reduction technologies into ICEVs. Many countries aim to achieve their greenhouse gas (GHG) mitiga
Taking into account environmental concerns and depletion of fossil tion targets by promoting EVs. In the European Union (EU) in 2013,
fuel reserves, “transportation electrification” has become one of the BEVs allowed potential GHG savings compared to ICEVs between 50 and
strongest technological alternatives to gasoline vehicles. In this regard, 60% [11]. In the USA, if all light-duty vehicles were replaced by EVs,
electric vehicles (EVs) have started to become widespread in recent then GHGs could be reduced by 25% and oil consumption by less than
years. There are mainly three types of EVs, namely, battery EV (BEV), 67% [12]. Yet, EVs are not carbon neutral. EV and battery
plug-in hybrid EV (PHEV), and hybrid EV (HEV) [7]. BEV is a fully EV manufacturing [13,14] and battery recycling processes increase the
* Corresponding author.
E-mail address: onder.guler@itu.edu.tr (Ö. Güler).
https://doi.org/10.1016/j.rser.2021.110913
Received 5 August 2020; Received in revised form 22 January 2021; Accepted 28 February 2021
Available online 8 March 2021
1364-0321/© 2021 Elsevier Ltd. All rights reserved.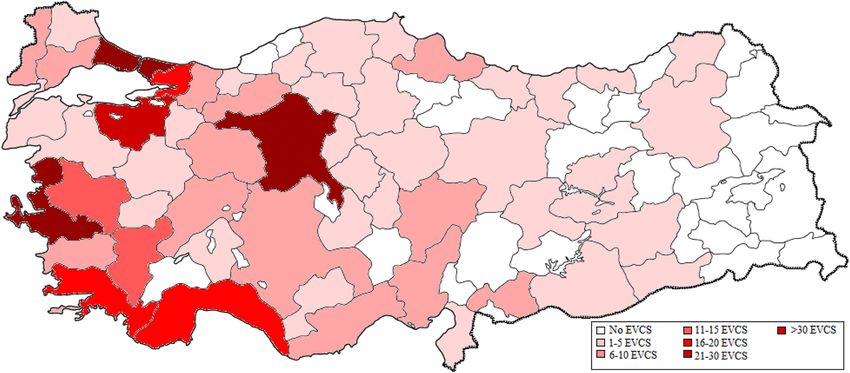
Ö. Gönül et al. Renewable and Sustainable Energy Reviews 143 (2021) 110913
carbon and material footprint of EVs. The material footprint of EVs is
reported to be not lower than ICEVs [15].
EVs do not only help to mitigate CO2 emissions but also are capable
to integrate with renewable energy systems (RES), especially with PVs in
urban areas [16–18]. The efficiency of EV-RES integration can be further
increased by performing smart charging [19,20] and demand-side
management (DSM) methods [21,22]. EVs have great potential to help
to minimize the “Duck Curve” phenomenon caused by high PV pene
tration during midday [23], and with the implementation of smart
charging strategies, they can even reduce grid operating costs by
smoothing the demand profile [24].
EVs are expected to become a crucial part of future grid network
under the concept of smart grids [18]. An EV battery is capable of
realizing technologies such as vehicle-to-grid (V2G) [25,26],
vehicle-to-home (V2H) [27,28] and vehicle-to-building (V2B) [29,30],
as well as, home-to-vehicle (H2V) and building-to-vehicle (B2V) in a
bi-directional energy transfer manner [31]. Any purpose of EV battery
outside of the vehicle, in short called vehicle-to-everything (V2X), can
balance out electricity demand and avoid any unnecessary costs for
infrastructure expanding [32].
Today, the main challenges of the EVs are twofold: their impact on Fig. 1. Global EV sales.
the grid network [33,34] and their social acceptance [35]. High pur
chase prices of EVs, long duration of fueling, lack of enough charging
infrastructure in some countries, and battery replacement [36] are the
most critical from the consumers’ point of view.
The trends, infrastructure studies, potential technologies in the field
of electro-mobility have been handled and discussed in detail in the
literature for the United States [37], China [38,39], Japan [40],
Australia [41], Spain [42], Germany [43], Poland [44], Lithuania [45],
Portugal [46] and Austria [47,48].
The EV market in Turkey is still in its infancy stage. Although some
developments and initiatives have emerged in recent years, the number
of registered EVs is still low and there is a lack of legislative and political
support for the improvement and stimulation of the EV market. There
fore, a comprehensive assessment of EVs and EV-related sub-sectors
(electric vehicle charging stations (EVCS), battery technologies,
research and development (R&D) studies, and industry) in Turkey is
provided in this study. The local challenges and opportunities are dis
cussed and within the context of Turkey; 1) The competitive position of
Turkey in the global EV market is discussed in terms of fueling costs
since Turkey has low electricity prices and high gasoline prices, 2) Since
Turkey has revealed an ambitious target of unveiling a “local brand
vehicle” and it has become a state policy, this exceptional state-
supported venture is analyzed, 3) An EVCS density map of Turkey is Fig. 2. Future trend of EV sales (adopted from Ref. [52]).
formed to discuss the non-homogeneous distribution of EVCSs in the
country and to give a direction to future EVCS installations. The dis
2. A brief review of EV, charging infrastructure and battery
cussion part is summarized with a SWOT analysis of EVs in Turkey, and
market
lastly, a list of policy recommendations with a roadmap towards EV
transition in the country is presented. It is expected that the outcomes of
2.1. EV market
this study will attract attention in the relevant circles by providing
recommendations for individuals, businesses, and decision-makers.
The first EVs appeared in the late 1800s [49]. The lack of advanced
This paper is organized as follows; Section 2 and Section 3 present an
battery technologies, weakness of electrical networks, and the rise of the
overview of EV, EVCS, and battery markets in the world and Turkey,
cheap oil era resulted in the rapid development of ICEVs. Today, with
respectively. Section 4 introduces EV-related regulations in the country.
the depletion of fossil resources, energy dependency, and arising envi
Section 5, summarizes R&D activities of the public and private sectors in
ronmental concerns, EVs have started to gain popularity again. Espe
Turkey. Section 6 carries out a cost comparison analysis of EV battery
cially in the last decade, the global EV market had an explosive growth
charging and ICEV refueling among G20 countries. Section 7 discusses
rate (Fig. 1). Global EV sales of 2000 in 2010 reached 765,000 in the first
the factors influencing the development of the EV market in Turkey,
half of 2019 [50].
evaluates the EVCS infrastructure in the country taking into account
Among the top EV sales, China has the highest numbers in line with
renewable energy integration, and provides a SWOT analysis to present
its population, resources, supportive policies, and aggressive production
a general view of all positive and negative determinants. Finally, Section
strategy [51]. In the first half of 2019, 430.7 thousand EV sales, which is
8 presents the conclusion.
more than half of the global sales, were made in China [50]. China is
followed by the USA, Norway, Germany, and France, respectively.
Global EV sales were roughly 0.8 million in the first half of 2019 and
constituted a small portion of the total vehicle sales. Yet, EV sales are
2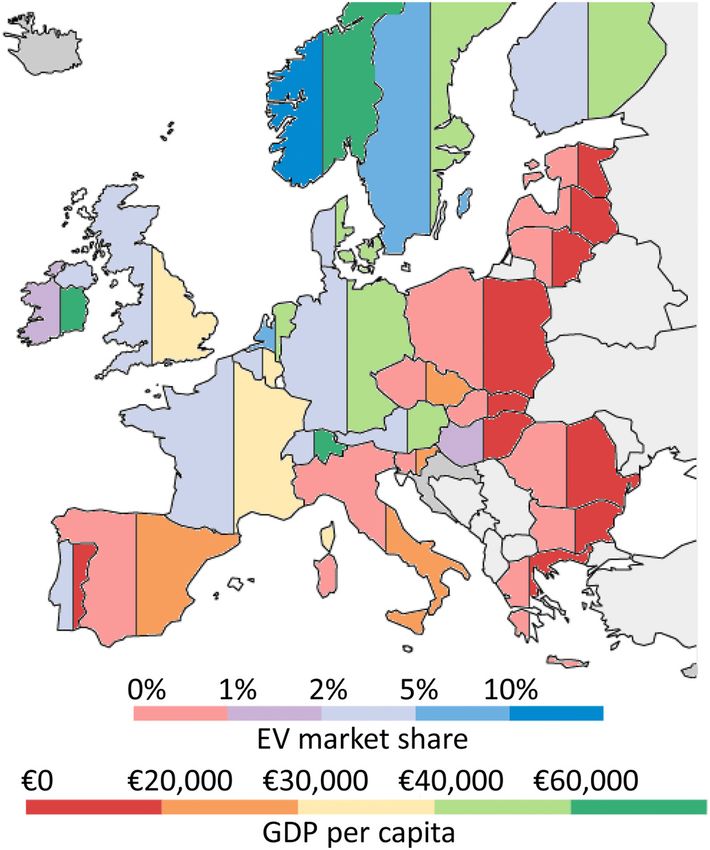
Ö. Gönül et al. Renewable and Sustainable Energy Reviews 143 (2021) 110913
Table 1
The EV-related announcements of the manufacturers (adopted from Refs. [59,
61]).
Manufacturers Announcement
BMW 25 new EV models and 15–25% of total sales in 2025.
BJEV-BAIC 0.5 million EV sales in 2020 and 1.3 million in 2025.
Chongqing 21 new BEV and 12 new PHEV models and 1.7 million sales by
Changan 2025 (100% of total sales).
Dongfeng Motor 6 new EV models and 30% EV sales share in 2022.
Geely 1 million EV sales in 2020.
GM 20 new EV models by 2023.
Nio 0.15 million EV sales in 2021 and enter the European market
after the H2 of 2021.
Maruti Suzuki 35 thousand sales in 2021 and 1.5 million in 2030.
Mercedes Benz 100 thousand sales in 2020, 10 new EV models by 2022.
PSA Group 0.9 million sales in 2022.
SAIC Motor 0.2 million by 2020 and 1 million sales by 2025.
Tesla Around 0.5 million sales in 2019, 0.5 million annual production
capacity for Model 3, and a new model in 2030.
Toyota 1 million BEV and FCEV sales around 2030.
Volkswagen 0.4 million EV sales in 2020, up to 3 million EV sales in 2025,
80 new EV models by 2025, and 22 million cumulative sales by
2030.
Fig. 3. The top countries in the market share of EVs in 2019.
Volvo 50% of the group’s sales to be BEV by 2025.
vehicle market (Fig. 3) Norway is the leading country in this respect with
an EV share of 49.1% in 2019 [53–56]. By 2025, the country aims to ban
the sale of all fossil fuel cars and apply high taxes to high-emission cars
and low taxes to low emission cars [57]. The other EU countries provide
various tax reductions and incentives as well, as detailed in the next
section. Although these measures positively affect EV sales in some
countries, in others, the desired level has not been reached yet [58].
Norway’s success is not only due to the country’s effective policies
but also the high purchasing power of the country. EV sales are generally
higher in economically more developed countries where they are more
affordable. Fig. 4 shows the correlation between GDP per capita and EV
market share in EU countries [53]. The countries with GDP per capita
below € 29,000 have EV market share of less than 1%, whereas, the
countries with GDP per capita above € 42,000 have a market share of
more than 3.5%. Norway has the largest EV market share (49.1%)
among the EU countries with its GDP per capita of € 73,200. Portugal
serves as a good example as to how state policies and policy design can
impact EV sales. Despite its lower GDP per capita in Europe, Portugal has
a relatively high EV share of 3.4%.
2.2. EV targets
With the increasing trend of EVs, existing ICEV manufacturers have
started to introduce new EV models in recent years. Most of the major
manufacturers announced their targets in the industry over the next
5–10 years [59]. As presented in Table 1, besides well-known automo
tive giants, many new manufacturers have recently emerged in the
global market, looking to take a share. Especially Chinese original
equipment manufacturing (OEM) companies Chongqing Changan,
Fig. 4. Correlation between GDP per capita and EV market share in Dongfeng Motor, and Geely have announced ambitious targets. The
EU countries.
emergence of new manufacturers is due to the fact that EVs have less
moving parts compared to ICEVs, their components are relatively easier
expected to catch up with ICEV sales in the coming 20 years. Fig. 2 to manufacture and repair, and the EV market is a new market waiting to
shows the future trend of EV sales and their proportion in global sales. be exploited [60].
According to Bloomberg New Energy Finance (BNEF) EV Outlook 2020
report, the EV sales will reach approximately 26 million in 2030 and 55
2.3. Charging technology and infrastructure
million in 2040, which account for 30% and 58% of the global sales
respectively [52]. Also, BNEF estimates that EV sales will increase
Battery charging technologies can be categorized as conductive
significantly in China, the USA, and Europe until 2035, and after that,
charging, wireless (inductive) charging, battery swapping, and mobile
the number of sales will start to increase in the rest of the world. For
charging, in terms of energy transfer modes (Fig. 5). In conductive
instance, China’s 40% share in global sales in 2035 is expected to fall to
charging, power is transferred through a conductor. This technology can
35% in 2040 [52].
be realized with on-board and off-board chargers. On-board chargers are
Today, European states come to the fore among the EV sales in the
located inside EVs and this type of charging is utilized for slow charging
3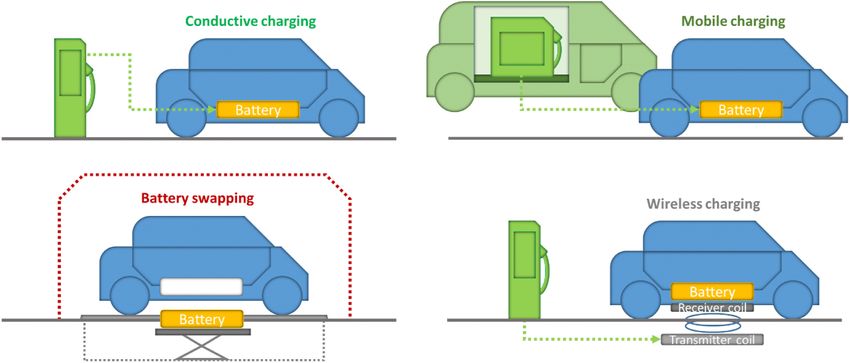
Ö. Gönül et al. Renewable and Sustainable Energy Reviews 143 (2021) 110913
Fig. 5. EV charging technologies.
Table 2
EV charging modes.
Mode Charging Voltage Max Connection Specifications
type (V) current
(A)
#1 AC (slow) 120 16 Standard No communication
socket between EV and
charging points. It
might be unsafe.
#2 AC (slow) 240 32 Via special The cable equipped
cable with In-cable
Control and
Protection Device
(IC-CPD)
#3 AC (semi- 250 32–250 Special Commonly used for
fast) cable public EVCSs which
through the also supply control,
EVCS communication,
and protection
processes
#4 DC (fast) 600 400 Dedicated For DC charging
socket AC/DC converter
through located in the EVCS.
EVCS All control,
communication, Fig. 6. The total number of charging stations in EU countries.
and protection
operations actualize
within EVCS drivers instantly exchange their depleted batteries with full ones without
waiting for long charging times. In battery swapping, drivers do not
worry about battery life or maintenance since all processes are per
[62]. On the other hand, off-board chargers are located outside EVs at formed by service suppliers [66]. However, the main drawback is that
stationary points and provide fast charging. Today, the most used there is no standardization of battery types. Since each EV model or
charging type is conductive charging and it consists of different modes. brand have different battery size and design, this type of service is
The widely accepted IEC 62196 standard (Plugs, socket-outlets, mainly model- or brand-specific [67]. On the other hand, swappable
vehicle couplers, and vehicle inlets – Conductive charging of EVs) cat batteries most of the time belong to energy companies, and therefore,
egorizes four charging modes for EVs in terms of charging types, voltage battery swapping has a reducing effect on the high sticker prices of EVs.
and current levels (Table 2) [34]. The mode 1 charging type, in which Mobile charging has recently emerged as an alternative to fixed
EV is directly connected with a wall plug, is not valid in some countries stations. Mobile charging stations are on the go and do not require
due to safety problems [63]. Other types of charging gain importance infrastructure investments. In this charging scheme, a driver requests a
according to the place of use. Mode 2 is generally used in private homes mobile charging unit via a mobile application and through a data center,
or office buildings and provides slow charging [42]. Mode 3 is a and a system operator immediately fulfills the request [68]. A mobile
semi-fast version of AC charging used in EVCSs to supply the demand charging unit constitutes of a charger on a minivan. This scheme is not
fast. Mode 4 which is DC fast charging type used commercially which widely used and prices may be higher than other options due to the
offers significant gains in terms of battery charging duration. Yet, it service tailored to a driver’s request.
requires special design and infrastructure facilities. The number of EVCSs is on the rise as well, along with the number of
Inductive or commonly known as wireless charging utilizes an EVs. In Europe, the total number of EVCSs which were 2379 in 2011,
electromagnetic field to transfer power to EV battery. Whereas this increased dramatically in 2015 and reached the limit of 50,000. After
technique does not require plugging and unplugging, the major disad 2015, the number increased by more than 3 times and reached 165,000
vantages are high power loss, low efficiency, and low energy transfer as of 2019 (Fig. 6). Besides, the number of fast-charging stations have
ability [64,65]. started to increase in recent years. While there was no fast charging unit
Battery swapping or exchanging is another concept in which the in the EU countries in 2011, their number reached 3396 in 2015 and
4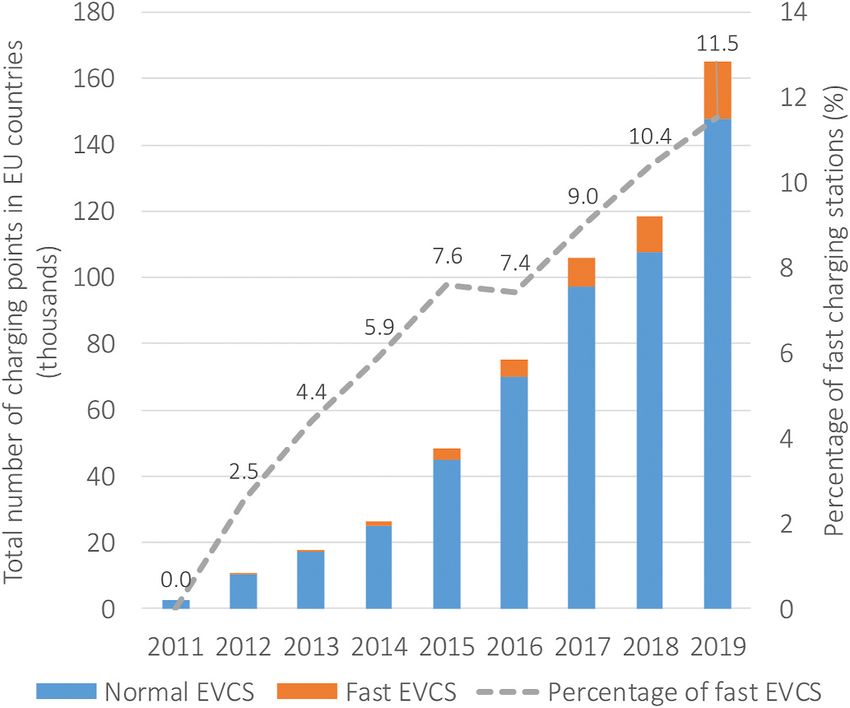
Ö. Gönül et al. Renewable and Sustainable Energy Reviews 143 (2021) 110913
2.4. Battery technology and market
The energy required to drive electric motors in EVs is supplied by
batteries, and the development of high specific energy batteries and the
gradual decrease in prices can undoubtedly be considered as the most
critical stages in the development and widespread use of EV technology.
The energy density or specific energy of the battery pack should be at a
reasonable level, and technology that offers high specific energy should
also be at acceptable prices. The change in average lithium-ion battery
pack prices in the last decade is given in Fig. 7 [73]. While the average
battery pack price was 1182.9 USD/kWh in 2010, it decreased to 156
USD/kWh in 2019. In the EV market, the average specific energy of EV
battery cells is 240–300 Wh kg− 1 [74]. Lithium ferro phosphate (LFP),
lithium cobalt oxide (LCO), lithium manganese oxide (LMO), nickel
cobalt aluminum (NCA), and nickel manganese cobalt (NMC) are the
most common cathodes used in EV batteries. In Table 3, the EV battery
technologies are compared according to different criteria [75]. In recent
years, nickel-based technology has been preferred for price-performance
because the nickel content offers high energy density and low price. 16%
of EVs used NMC cathodes (NMC 622 and above) in 2019 compared to
7% in 2018. Besides, the use of LFP cathode technology declined from
Fig. 7. Li-ion battery pack price trend [73]. 9.1% in 2018 to 4.6% in 2019 [74]. On the other hand, there are some
new researches on battery technologies such as metal-air battery [42],
became 17,056 in 2019 [69]. graphene battery [76], solid-state battery [77], aluminum battery [78],
The number of EVCSs in the United States (24,943) is lower than in and lithium-sulfur battery to reduce charging time, to improve life span
Europe [70], whereas, in China, the number is twice of Europe according and to provide higher energy density [79].
to the Chinese Electric Vehicle Charging Infrastructure Promotion
Agency (EVCIPA). As of January 2019, there exist 330,000 public EVCSs
in China [71]. 2.5. Incentives
The reason for the increase in the number of fast-charging units is
that the drivers want to adapt to new technology without losing their EV incentives applied in selected countries are presented in Table 4
ongoing habits and the current refueling comfort they have with ICEVs. [71,80–83]. Purchase subsidies and tax benefits are the main two in
Fast charging shortens the fueling duration and especially becomes a centives today for EVs. All countries except China, Norway, and Turkey
necessity during long trips. Yet, compared to a few minutes of fueling provide purchase subsidies, and all countries except Canada apply tax
duration of ICEVs, the duration of fast charging is still longer, and EVCSs benefits. Almost half of the countries provide incentives for EV pro
should further be developed in this regard [72]. duction and charging infrastructure. Spain and the United Kingdom
apply all the above-mentioned incentives.
In addition to incentives, a set of emission reduction targets have
Table 3
Comparison of different EV battery technologies (adopted from Ref. [75]).
Technology Safety Life span Performance Cost Specific energy Specific power
LFP High High Medium Medium Low High
LCO Low Low Medium Medium High Low
LMO Medium Low Low Medium Medium Medium
NCA Low Medium Medium Low High Medium
NMC Medium Medium Medium Medium High Medium
Table 4
The EV incentives in selected countries.
Country Purchase subsidies Tax benefits Production Infrastructure Planned ICEV sales ban after:
Austria + + + – 2020
Canada + – – + 2030 (Vancouver)a, 2040 (British Columbia)
China – + + + –
Finland + + – – –
France + + + – 2040, 2030 (Paris)a
Germany + + + – 2030
Italy + + – + 2030 (Milan)a
Japan + + – + –
Norway – + – – 2025
Portugal + + + – –
Slovenia + + – – 2030
Spain + + + + 2040, 2030 (Madrid, Barcelona)a
United Kingdom + + + + 2035, 2030 (Liverpool, London, Birmingham, Greater Manchester)a
Turkey – + – – –
USA + + – + 2030 (Seattle, Los Angeles, West Hollywood)a
a
In these cities, electric buses by 2025 and ICEVs by 2030 are planned to be banned according to the C40 Fossil-Fuel-Free Streets Declaration.
5
Ö. Gönül et al. Renewable and Sustainable Energy Reviews 143 (2021) 110913
Table 5 been assigned by the EU for passenger cars. Between 2015 and 2019, a
The total vehicle retail sales in Turkey in 2019 [87]. target of 130 g CO2/km was determined in the EU fleet-wide. This target
Automobile Light commercial vehicles was reached earlier in 2018 with 120 g CO2/km [84]. For 2021 and
onwards, the EU assigned a new target. Beginning in 2021, the average
Domestic 157,178 48,891
Imported 230,078 42,913 emissions of all newly registered cars of a manufacturer will be below
Total sales 387,256 91,804 95 g CO2/km and the manufacturers that do not comply with the defined
limits will pay € 95 for each g/km of target exceedance. These goals are
also the basis of the transition process to EVs and facilitate the transition
Table 6 to new technology.
EV sales between 2016 and 2020 in Turkey (not included Tesla sales) [88].
3. Current status of EV and EVCS market in Turkey
Type 2016 2017 2018 2019 2020a
BEV 44 77 155 222 82 Turkey is at the crossroads between Europe and Asia and connects
PHEV 83 27 39 39 17
HEV 867 4424 3837 10976 3218
the Black Sea and the Mediterranean Sea. Its geographical location along
Total 994 4528 4031 11237 3317 with its competitive, skilled, and cheap workforce are among the factors
a
that have made Turkey one of the leading automotive production bases
Sales in the first quarter of 2020.
in Europe. In 2019, approximately 1.5 million vehicles were manufac
tured in Turkey [85], which ranked the country 4th in Europe after
Germany, Spain, and France [86].
Furthermore, Turkey is one of the countries with a dynamic vehicle
Table 7
BEV models sold in Turkey and their specifications.
Model Top speed (km/h) Nominal range (km) Battery Capacity (kWh) Electric motor power (kW) Motor torque (Nm) Charging time
Tesla Model X Performance (SR) 250 437.7 100 375 (rear) 660 (rear) 13.5 h (7.4 kW)
193 (front) 330 (front) 4.5 h (22 kW)
1 h (100 kW)
Tesla Model S Performance (SR) 250 524.6 100 375 (rear) 650 (rear) 13.5 h (7.4 kW)
193 (front) 330 (front) 4.5 h (22 kW)
1 h (100 kW)
Tesla Model 3 Performance AWD 261 481.2 79.5 211 (rear) – 10.7 h (7.4 kW)
147 (front) 3,6 h (22 kW)
0.8 h (100 kW)
BMW i3s Roadstyle 160 246 42.2 135 270 5.7 h (7.4 kW)
1.9 h (22 kW)
0.4 h (100 kW)
Jaguar i-Pace 200 376.6 90 147 (rear and front) 348 (rear and front) 12.2 h (7.4 kW)
4.1 h (22 kW)
0.9 h (100 kW)
Renault ZOE R110 135 395 52 80 225 7 h (7.4 kW)
2.4 h (22 kW)
0.5 h (100 kW)
Smart EQ 130 150 17.2 60 160 2.3 h (7.4 kW)
0.8 h (22 kW)
a
(100 kW)
a
DC charging not supported.
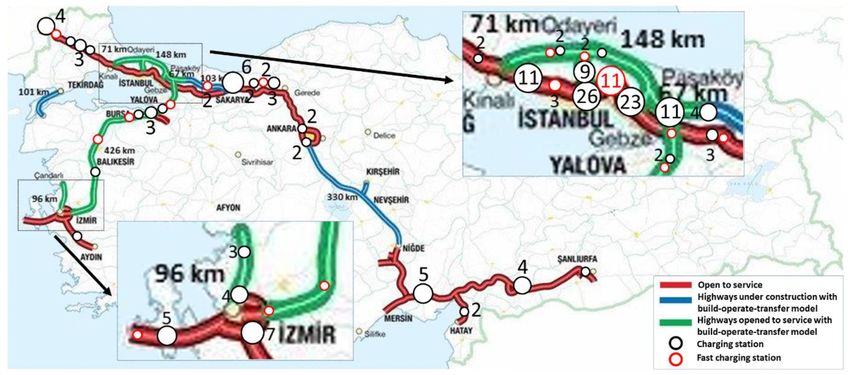
Fig. 8. EVCS density map of Turkey.
6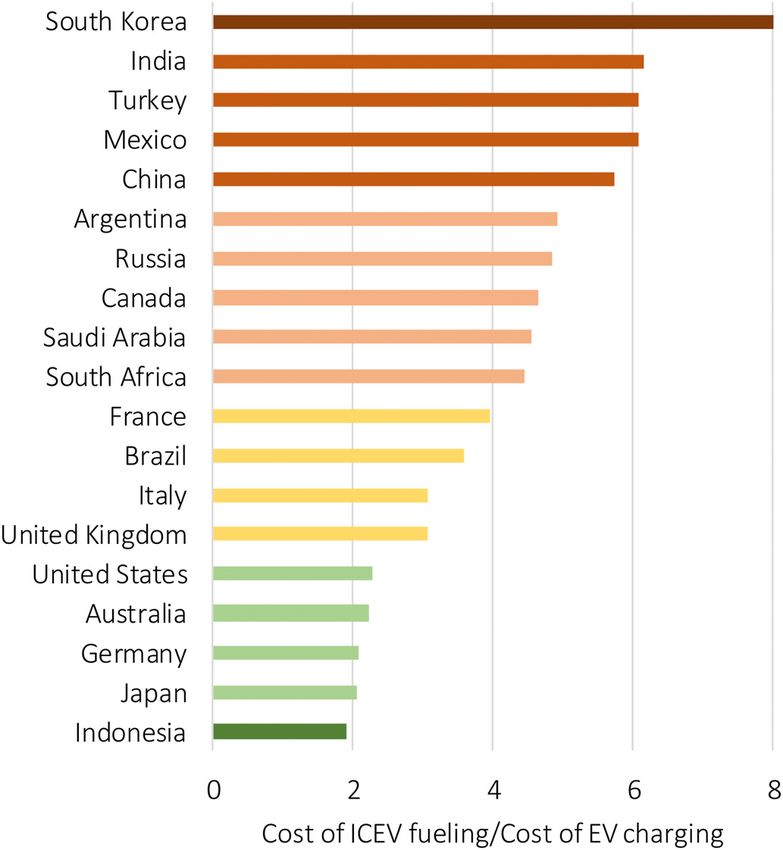
Ö. Gönül et al. Renewable and Sustainable Energy Reviews 143 (2021) 110913
Table 8 Table 9
SCT rates applied in Turkey in terms of vehicle types. The companies operating in EV-related sub-sectors in Turkey.
Type Motor power or engine volume Tax-free price SCT rate EV related Participants Company activities
(%) technologies
ICEV Below 1600 cm3 Below 70000 TLa 45 Electric drive DMA [97] - Conversion of Toyota Corolla to
Between 70000 TL 50 systems electric drive
and 120000 TL Hexagon Studio - Electric and electronic system analysis
Above 120000 TL 60 [98] and hardware design
Between 1600 cm3 and 2000 cm3 Below 170000 TL 100 - Vehicle modeling and simulation,
Above 170000 TL 110 Hardware-in Loop (HIL) validation
Above 2000 cm3 160 Mekatro [99] - Electric motor design for EVs and e-
HEV Electric motor above 50 kW and Below 85000 TL 45 bikes
motor cylinder below 1800 cm3 Between 85000 TL 50 - Design of power drive systems for EVs
and 135000 TL and e-bikes
Above 135000 TL 60 Battery and Togitek [100] - Custom lithium battery pack design
Electric motor above 100 kW and Below 170000 TL 100 management - Embedded system design for EVs
motor cylinder below 2500 cm3 Above 170000 TL 110 systems - Battery management system design
Motor cylinder above 2500 cm3 160 Batron energy - Battery production for motorcycles, e-
BEV Below 85 kW 3 [101] bikes, and scooters
Between 85 kW and 120 kW 7 DMA [102] - Developing battery management
Above 120 kW 15 algorithms for EVs
a - Strategic agreement with CALB
TL: Turkish lira. Altınay e- - Battery system design for land, sea,
mobitech [103] and air vehicle for civil and military
market. The total vehicle retail sales in 2019 are given in Table 5 [87]. use
EVCSs Sharz [104] - By agreeing with the company
As seen, more than 40% of the retail sales consist of domestic vehicles.
Voltrun, they opened EVCSs to the
Despite its strong automotive industry and the fact that domestic vehicle common use of their customers
production has an important place in the country’s market, Turkey has - Design and production of AC, DC,
failed to create a domestic car brand for its domestic market or global residential and mobile EVCS
e-şarj [105] - The company makes EVCS
market until now.
installations at certain points by
Today, almost all vehicle sales in the Turkish domestic market belong agreeing with Aytemiz petrol station
to ICEVs. In this regard, Turkey falls behind the global EV trend. The EV company
sales in Turkey, released by the Turkey Electric and Hybrid Vehicle Voltrun [106] - Design and production of personal and
Association (TEHAD) are given in Table 6 [88] and the EV models sold in commercial EVCS
g-charge [107] - Design and production of EVCS
Turkey are presented in Table 7 [89]. Among all EVs, HEV sales are
- An agreement with Tesla to establish
higher in Turkey due to lower cost, long past in the market, their do Supercharger charging station in
mestic production in Turkey, and compatibility with usage habits in Turkey
terms of long driving range and fueling style. Besides, sufficient EV in Zes [108] - Provides personal and public EVCS
centives have not been introduced yet, and also EVCSs have not become - The company made an agreement with
Turkish Petroleum Petroleum
widespread. As it is not possible to change user habits at once, HEVs are Distribution Corporation (TPPD) for
more acceptable in social psychology [90]. However, BEV sales are in an EVCS installations in petrol stations
upward trend, albeit slowly and they are likely to reach higher sales in
the market in the future [91].
One of the reasons why the use of EVs has not become widespread in Beginning from 2011, several legal arrangements have been intro
Turkey is the non-homogeneous spread of EVCS infrastructure in the duced in Turkey for EVs and their charging infrastructure. Among these,
country. Fig. 8 shows the density of EVCSs across Turkey (based on the some tax reductions have been provided as mentioned above. Yet, EVs
data of the top 5 EVCS companies). Currently, the EVCS network is have not received enough attention until so far, due to insufficient
mainly located in the most populated cities of the country, such as charging infrastructure, high prices, and unfamiliarity of the technology
Istanbul, Ankara, and Izmir. The GDP per capita is higher in the western to the customers.
provinces (so is the affordability of EVs), where the bulk of the industrial The chronological arrangements can be sorted as follows;
facilities and large conglomerates are located. Accordingly, the majority
of EVCSs are concentrated in the same part. - In 2011, Turkey has put in the place the first EV incentive. With this
The correlation between GDP per capita and EV ownership in EU arrangement, the SCT rate (which varies between 45 and 160% for
countries is also applicable to Turkey [53]. 25 of 81 provinces in Turkey ICEVs) has been determined between 3 and 15% for EVs depending
(which have low GDP per capita) do not have a single EVCS. Most of on motor capacity and all BEVs have been exempted from MVT. The
these provinces without any EVCS are located in the eastern provinces. SCT discount has included only BEVs, and HEVs were not able to
Therefore, an EV user is likely to have trouble with EV charging during benefit from this discount [92].
travel from the western part to the eastern part of the country. - In 2013, it was made possible to establish EVCSs in areas and gas
stations that were technically approved by electricity distribution
companies [93].
4. EV-related regulations in Turkey
- In 2018, the MVT rate, which was fixed to 0% previously, was
determined as 25% of MVT given by ICEVs of equivalent power [94].
In Turkey, the general classification of taxes paid for motor vehicles
- In 2018, it was made compulsory to deploy EVCSs in private car
is divided into three types: value-added tax (VAT), special consumption
parks and shopping mall car parks in proportion to 1/50 of the
tax (SCT), and motor vehicle tax (MVT). SCT rate is determined ac
maximum vehicle capacity [95].
cording to the engine volume, vehicle type, and tax-free sales price of a
vehicle (Table 8). While ICEV and HEV users pay SCT between 45 and
160%, this rate is between 3 and 15% for BEV users. Although lower
taxes provide a serious advantage for BEVs, the high prices of BEVs do
not reflect positively on the user side.
7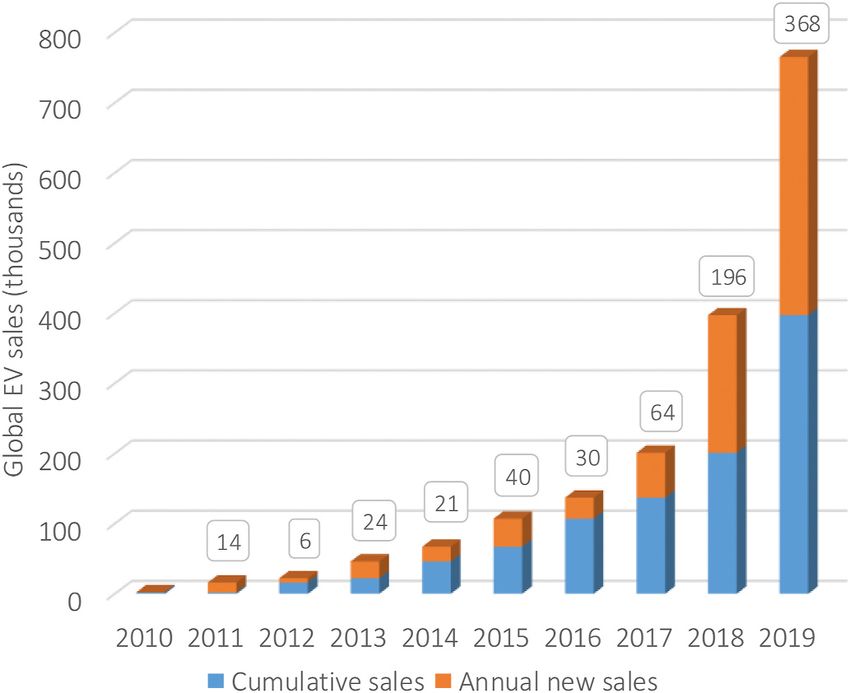
Ö. Gönül et al. Renewable and Sustainable Energy Reviews 143 (2021) 110913
Table 10
Electric car and bus models in Turkey.
Vehicle Company Model Top speed (km/ Nominal range Electric motor power Max. motor torque Battery capacity
type h) (km) (kW) (Nm) (kWh)
Electric car DMA [97] DMA Basic 160 280 62 330 36
DMA Plus 160 400 62 330 53
DMA Sport 200 400 84 350 53
Electric bus Karsan [109,110] Jest 70 105 125 290 44
Atak – 300 230 2400 220
Temsa [111] MD9 – 230 250 2600 200
Electricity
Bozankaya [112, Trambus 18 – – 240 – 33
113] SILEO S10 75 280 240 – 230
Otokar [114] Doruk Electra 90 280 103 475 170
5. EV research and developments in Turkey
Table 11
Announced features of EV prototype.
5.1. Private sector participants
C-SUV 200 hp C-SUV 400 hp
As stated in Section 3, Turkey has qualified facilities in the auto Top speed 180 km/h 180 km/h
motive industry. Automotive production, as well as spare parts supply, 0–100 km/h acceleration 7.6 s 4.8 s
are the leading export items of the country [96]. In addition, the Nominal range 300 km 500 km
Charging time %80 charge (30 min) %80 charge (30 min)
country’s qualified and cheap workforce can be considered among the
factors that keep the country dynamic in this sector. Ford, Honda, Fiat,
Toyota, Renault, and Hyundai have production facilities and also R&D due to its qualified labor force and developed automotive industry.
departments in Turkey. All of these companies work on ICEVs, except Moreover, EV-related research activities are conducted in universities
Toyota which manufactures an HEV model. and public facilities. Yet, due to reasons such as lack of private sector
Besides, many companies, whether in ICEV or EV sectors, work in encouragement or difficult and laborious bureaucratic processes, some
partnership with domestic or foreign companies. In EV-related sectors, products cannot start mass production and cause the idea or prototype to
the companies operate in subjects such as motor driving systems, battery disappear in the mid or short term.
management systems (BMSs), and EVCSs. In Table 9, some of the com EVT Motor was founded by academics in 2012 within Hacettepe
panies operating in EV-related sub-sectors and their services are University Technopark as an R&D and manufacturing company of
summarized. automobile technologies. The company managed to produce an electric
Among the electric drive system and BMS companies, DMA and sports car prototype (EVT S1) powered by Lithium Iron Phosphate bat
Hexagon Studio have conducted several innovative studies. DMA’s tery and with a range of 300 km and a maximum speed of 180 km/h
works are concentrated on battery management, claiming BMSs as the within 3.5 years [115]. Considering the year of the study, it can be seen
most important part of EVs. The company signed a strategic agreement as a very important and innovative initiative. However, due to the lack
with CALB (China Aviation Lithium Battery) in 2015, and a company of support for mass production, EVT Motor ended its activities.
named CADMA was established in China and its knowledge in BMS was Besides the negativities, some innovative activities are carried out.
exported abroad. Hexagon Studio is one of the leading companies in the One of these is a competition called “Efficiency Challenge Electric
automotive sector in Turkey and conducts R&D studies on EVs, espe Vehicle” which is organized annually by The Scientific and Technolog
cially on hardware design and battery management. Furthermore, the ical Research Council of Turkey (TUBITAK), where the main theme is the
other companies continue their activities as partners of many EV-related vehicle efficiency and performance [97]. An average of 30 universities
projects both for civil and military use. annually attend this competition, providing important know-how to
Besides the EV-based sub-component companies, many companies students with workshops and seminars.
work on charging infrastructure in Turkey (Table 9). According to the
data of the five largest domestic EVCS companies, there are 627 EVCSs 5.3. Domestic EV prototype
located in Turkey that belong to them. Moreover, EVCS companies
continue their operations to improve charging infrastructure, and Despite the country’s developed automotive industry, the lack of a
among them, e-şarj and Zes make cooperation agreements with petrol domestic car brand has been a point of criticism to the governments in
station companies. Turkey for years. With EVs, a different dimension is formed in vehicle
Moreover, there are various initiatives on EVs in Turkey (Table 10). technology and Turkey aims to get a share of this market. Hereby, a
For example, DMA has developed three EV models by modifying Toyota consortium was established in 2017 under the proposal of the Presi
Corolla, installing electric motors on these cars, and applying their own dency with 4 companies (BMC, Anadolu Group, Kök Group, and Zorlu)
battery management systems. They have reached a range of 400 km in and TOBB (the Union of Chambers and Commodity Exchanges of
their latest version. Besides, there are many companies engaged in the Turkey) as a coordinator. As a result of the subsequent studies, a com
production of electric buses in Turkey. Some of them are in the testing pany named TOGG (Turkey’s Automobile Joint Venture Group) was
phase and some are actively used. The electric buses, whose usage is founded in 2018 and actions have started for the domestic EV prototype
relatively less in Turkey, are mostly exported to Europe. Bozankaya’s [116]. At the end of 2019, two different prototypes developed by TOGG
“SILEO” is in active use in Germany and Luxembourg. If the use of are introduced as C-SUV and C-Sedan models. However, it was
electric buses in public transportation increases in Turkey, it can be announced that the C-SUV model will be produced firstly due to market
ensured that the public awareness and interest is increased. preferences [117]. The factory location for production has been deter
mined as Bursa-Gemlik [118] and it is planned to launch the first vehicle
by 2022. The described features of the vehicle are given in Table 11.
5.2. Universities & public facilities
Turkey has the potential to produce and export various EV products
8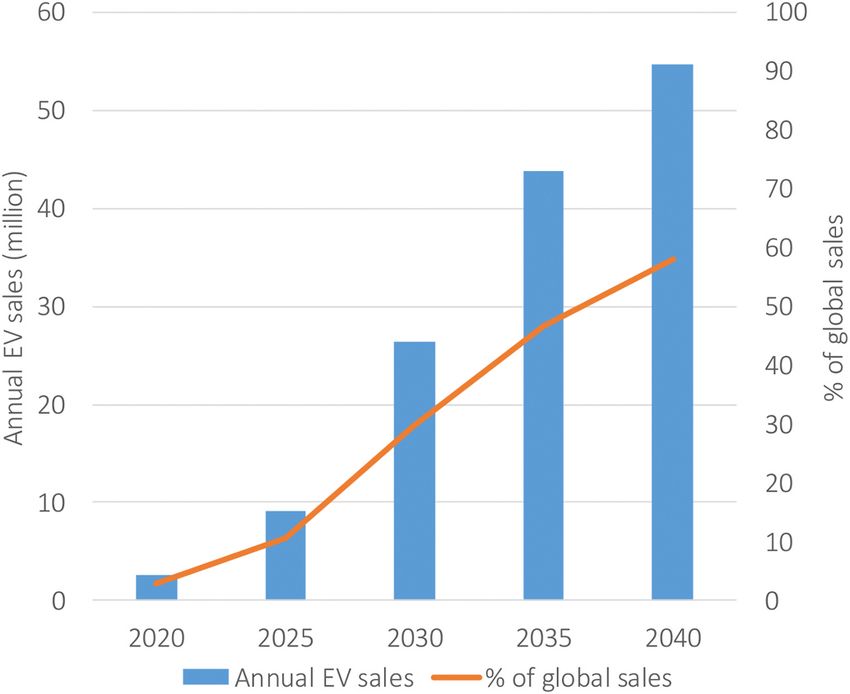
Ö. Gönül et al. Renewable and Sustainable Energy Reviews 143 (2021) 110913
gasoline costs belong to the EU countries (Italy, France, Germany,
United Kingdom) and South Korea which imports oil and generally re
flects high taxes on gasoline. While in oil-poor countries ICEV fueling for
100 km driving costs above $ 12, it costs less than $ 5 in oil-rich
countries. The highest and lowest ICEV fueling costs belong to Italy ($
14.81) and Indonesia ($ 3.53), respectively.
The EU countries take the lead in electricity prices as well, which
leads to higher EV charging costs in these countries. EV charging for 100
km driving costs between $ 6.51 (Germany) and $ 0.93 (Saudi Arabia)
among G20 countries. It should be noted that the calculation is made
over flat rates of the countries, and with the use of time-based pricing,
the charging costs can further be reduced.
To understand the EV charging benefit, the cost of ICEV fueling is
compared to the cost of EV charging in all G20 countries as presented in
Fig. 10. The countries with high gasoline prices and low electricity prices
are ranked the highest in this comparison (red bars). South Korea has the
highest fueling/charging cost ratio among all G20 countries making the
country the most suitable for EV transition in terms of fueling cost,
whereas Turkey is ranked 3rd. ICEV fueling costs more than six times of
EV fueling in Turkey. In this respect, high gasoline prices along with low
Fig. 9. Cost comparison of EV home charging and ICEV fueling for 100 km electricity prices become a reason for Turkey to facilitate its EV
driving in G20 countries. transition.
7. Discussions
The discussion part is examined in four sub-sections for better un
derstandability of the shortcomings of EV and EVCS sectors. Firstly, a set
of recommendations are presented for EVs in Turkey. Then, the prob
lems and potential solutions to the EVCS infrastructure are discussed.
After that, an assessment of renewable energy integration of EVs and
related fields is made. Lastly, the discussion is summed up with a SWOT
analysis and priority roadmap for EVs and subsectors in Turkey.
7.1. EVs in Turkey
EVs will be a part of our daily lives in the near future. Yet, the speed
of their penetration into the vehicle market will not be the same in every
country. The main determining criteria here are the incentives and
sanctions, as well as the purchasing power in a country.
The main incentives applied worldwide for EVs are purchase sub
sidies, tax discounts, manufacturing incentives, and charging
infrastructure-related incentives. Besides, many countries announce
their ICEV sell ban dates. As of today, Turkey only applies tax discounts
(VAT, SCT, MVT). Although tax reduction can be considered as a strong
incentive, the low purchasing power in Turkey requires additional
measures to stimulate the EV market.
From the point of view of the “free market”, it can be said that EV
transition is not necessarily required to be fast in a country. However,
along with global factors, such as the threat of CO2 emissions, there are
local factors in Turkey that demand a fast transition to EVs, which are:
Fig. 10. The ratio of cost of ICEV fueling to cost of EV charging for equal
driving range in G20 countries. (1) The country’s energy dependency on imported fossil resources
and high gasoline prices in the country (i.e. ranked 2nd highest in
the world in 2012).
6. The cost comparison EV charging and ICEV fueling
(2) The fact that Turkey aims to unveil a local car brand and take a
share in the new and expanding EV market, which requires to rely
The price difference between charging and fueling varies depending
on a domestic market on a large scale.
on the electricity and gasoline prices of a country. In Fig. 9, the fuel cost
(3) The fact that Turkey is already an automative manufacturing base
graph for EV home charging (Nissan Leaf) and ICEV gasoline fueling
of many global firms. A strong domestic demand for EVs will be a
(Nissan Versa) in G20 countries is compared for 100 km driving. The
factor for these firms to shift their EV facilities to Turkey.
household electricity prices and gasoline prices of 2019 are taken from
Refs. [119,120]. Nissan Leaf and Nissan Versa consume 18.6 kWh/100
To that end:
km and 7.8 L/100 km, respectively [121,122].
As seen in Fig. 9, EV charging costs less than ICEV fueling in all G20
• In addition to tax reduction, Turkey can apply the other above-
countries. The lowest gasoline prices belong to oil-rich countries
mentioned incentive mechanisms, as well as can set targets and
(Indonesia, Saudi Arabia, Russia, the United States). The highest
timelines for phase-outs of ICEVs (Table 4).
9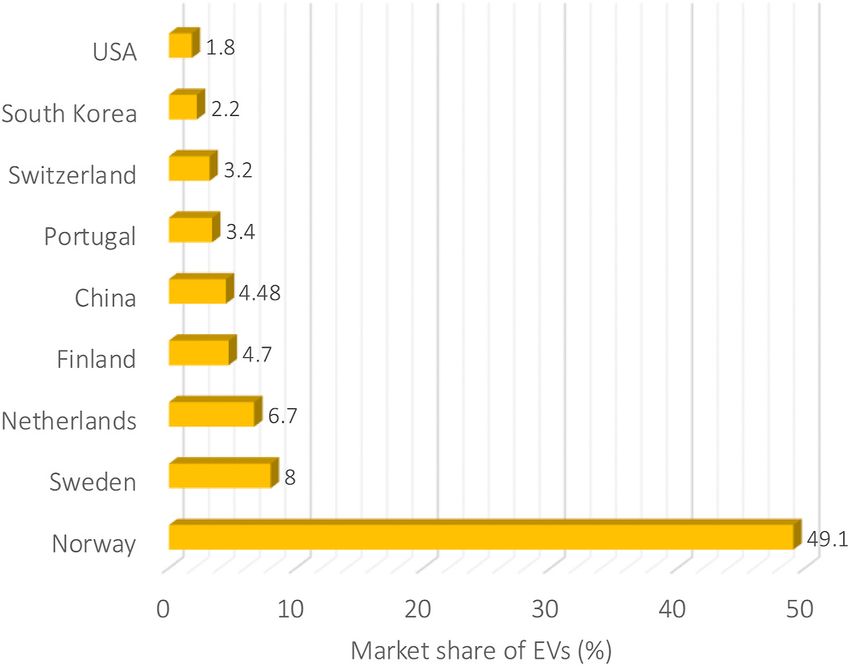
Ö. Gönül et al. Renewable and Sustainable Energy Reviews 143 (2021) 110913
Fig. 11. The distribution of EVCSs along the highways.
• Moreover, apart from the major incentives that mainly functions to in France [127]. Although this rate seems positive compared to
reduce the purchase price of EVs, minor incentives such as free on- other countries, it should be noted that EVCSs are not distributed
street parking or free or reduced bridge tolls for EVs can attract homogeneously in Turkey. Almost 20% of EVCSs are located in
drivers, which are applied in other countries [123,124]. Istanbul. 25 of 81 provinces in Turkey do not have any EVCS, and
• The high cost of ownership is one of the major barriers in Turkey. EV the majority of them are concentrated in the eastern provinces.
costs can be further decreased by purchase subsidies, at least at the Lack of an adequate charging infrastructure prevents uninter
current infancy stage. By doing so, the higher purchase rate of EVs rupted transportation and makes drivers suffer from “range
can lead to their higher visibility which also helps to exponentially anxiety” [128].
overcome another main problem: the lack of information and unfa • Infrastructure studies should be carried out in provinces
miliarity about EVs in Turkey. without EVCS, primarily with the support of local government
• The latter can also be dealt with by information campaigns and ac and with incentives and directions to be developed by the
tivity studies, especially in the fields of driving range, charging, and relevant ministry for the private sector.
pricing. Besides, EV fleets in public transportation and public ser • There is a regulation that allows EVCSs to be installed at petrol
vices can strongly promote EVs and increase their visibility. More stations [93]. Companies can use this as an advantage to ensure
over, unlike drivers, passengers are not reluctant to use EVs in public faster distribution and shorten the selection of the site to be
transportation. On the contrary, they highly support e-transportation installed.
even if they need to pay for more [125]. Here, another advantage of (5) The distance between the eastern and western ends of Turkey is
Turkey is the presence of several domestic electric bus manufacturers approximately 1660 km and it is known that EVs and ICEVs have
in the country which can lead to achieving the transition to serious differences in range and charging/refueling times. As a
e-transportation at lower costs. comparative example, on a long journey of 1500 km, an ICEV
• Furthermore, tax deductions or incentives per vehicle can be applied driver needs to visit a petrol station once, while an EV driver
to the companies, operating in Turkey (Ford, Fiat, Honda, Hyundai, needs to visit an EVCS a minimum of three times under existing
Renault, and Toyota) in case they produce EVs in Turkey. This may battery technologies. Especially, if the EVCSs do not support fast
also be beneficial to increase the know-how in the country. Alter charging, the driver needs to wait for longer each time during the
natively, the government may provide facilities such as free factory charging process.
area allocation or tax relief to attract foreign investors producing EVs • To eliminate the disadvantaged position of EV drivers
in Turkey. regarding the refueling time and number of stops, the fast
• In Turkey, there are more than 23 million vehicles and the share of charging station network should be expanded as much as
EVs accounts for only 0.1% of the total market. The transportation possible. For instance, fast public charging points per 100 km
sector is highly responsible for CO2 emissions and environmental tax highway is less than 1 station (0.76) in Turkey (Fig. 11),
may be imposed due to the use of ICEVs to encourage the use of EVs. whereas it is 20 stations in EU-countries [129].
• In addition to fast-charging stations, another recommended
way to shorten the charging time is “battery swapping sta
7.2. EVCSs in Turkey
tions”. In this concept, passengers exchange their depleted
batteries with full ones and continue their journeys without
As EVs become a part of our lives, not only our type of mobility but
waiting for charging. Here, drivers do not own batteries of their
also our way of fueling is changing with EVCSs. Yet, the drivers are
EVs and rent the service from companies. This causes a
concerned about the availability of an easily accessible charging infra
reduction in EV prices as well, due to the high cost of batteries
structure. They want to access an EVCS just as they can easily access a
[130]. However, different battery sizes and designs of manu
petrol station and refuel their ICEVs.
facturers limit the applicability of battery swapping. Although
this method seems like a distant solution in Turkey in the
(4) Today, the number of petrol stations in Turkey is more than
short-term due to the underdeveloped market, it can offer a
13,000 [126], whereas the number of EVCSs is much less than
quick battery replacement process to e-taxi and public fleets
this. The distribution of EVCSs is not homogeneous across the
that use the same EV models in the medium-term [131]. Also,
country. As shown in Fig. 11, the majority of the EVCSs exist in
in Turkey, both state institutions and the “Chamber of Cab
highly populated regions or cities. While EVCS density per 100
Drivers” declared their willingness to support TOGG.
km of paved road is around 3 stations in Turkey, it is 19.3 in the
Netherlands, 3.5 in China, 2.8 in Germany, 2.3 in Japan, and 1.5
10Ö. Gönül et al. Renewable and Sustainable Energy Reviews 143 (2021) 110913
Therefore, in the case of high customer demand for TOGG EVs, Table 12
battery swapping stations can become attractive in Turkey. SWOT analysis of EVs in Turkey.
(6) In Turkey, EVCS companies offer their services, such as EVCS (S)trengths (W)eaknesses
maps, through mobile applications. This process requires regis
- Highly developed automotive industry - The low purchasing power in the
tration and becoming a member. The companies also charge non- in Turkey (ranked 4th in sales in country to afford the high cost of EVs.
member drivers for additional fees for EVCS usage. All of these Europe) along with its qualified and - Although the country is an automotive
compels EV users to become members of a number of EVCS cheap labor force. production base, most of the raw
companies. - Governmental and public willingness materials are imported.
to have a “Local Brand Vehicle”. - The lack of regulatory authority.
• The establishment of a common mobile platform for EVCSs that - Turkey’s dynamic domestic - The lack of sufficient charging
all EV users can access, see the station occupancy levels, get automotive market. infrastructure.
directions to alternative stations, and even pay online can help - Higher potential for EV-RES integra - The non-homogeneous distribution of
to overcome this problem. tion (high solar and wind potential in EVCSs across the country (EVCSs are
Turkey). concentrated in the western part).
(7) Another problem with EVCSs in Turkey is the differences in the
- The limited availability of home
payments (pricing of charging) and the absence of a regulatory charging due to very low number of
agency. Currently, each company sets a separate charging tariff. detached houses in urban areas in
• Regarding the arrangement of the tariffs, Energy Market Reg Turkey.
ulatory Authority (EMRA) can be provided as a regulator for - The lack of different types of incentives
other than tax reduction.
EVCSs as it regulates the oil prices. - The limited tariff rates (only flat rate
• Besides, lack of regulatory authority in other EVCS-related is and TOU).
sues (grid, standards, system management) should also be
(O)pportunities (T)hreats
eliminated.
(8) EV batteries have quite large capacities, and charging EVs can - High gasoline prices in Turkey. - High competition in the global market
- Cheap electricity prices in Turkey. due to the easier manufacturing of EVs.
draw high power from the grid. Taking into account the large - The fact that the EV market is a new - Conservative ICEV users.
penetration of EVs, their adverse effects on the grid network market ready to be exploited and - A state-funded EV brand project can
should also be carefully evaluated. Charging EVs from houses or Turkey can unveil a local car brand. harm the competition in the domestic
EVCSs can cause different effects. Problems such as overloading, - New job opportunities. market.
- The presence of electric bus - The lack of public awareness and
overheating, increased losses, voltage drop, frequency regulation,
manufacturers in Turkey. information about EVs (i.e. pricing,
shutdown, and harmonics may occur in the connected substation - The aıutomative firms which operate driving range, refueling, etc.).
[132–135]. These effects cause damage to the infrastructure and in Turkey can shift their EV facilities to - Unexpected load on the grid due to
can impede new investments and bring extra costs. Turkey (as Toyota did for HEVs) variable and uncertain consumer
• SHURA Energy Transition Center released a report in 2019 to - Open and flexible to new business behavior.
models. - The rise in electricity demand.
evaluate the impact of EVs on the distribution network in - Chance to control GHG emissions. - Investment cost of EVCSs and needs for
Turkey. The report expects the number of registered EVs in an extra infrastructure.
Turkey to reach between 1 and 2.5 million by 2030. In the case
of 2.5 million vehicles in pilot areas with a 10% prevalence, it is
evaluated that uncontrolled charging can increase the peak (10) As discussed in (8), EV batteries can affect the power grid
load by 12.5%, but if smart charging methods were applied, the adversely due to huge capacities, or referring to (9), they can be
increase can be 3.5% [136]. used to shave peak demand and stabilize renewables’ intermit
• The relevant ministries and organizations should make pro tency [137]. At this point, the importance of intelligent energy
jection studies on EV penetration and the grid infrastructure management systems emerges.
should be strengthened according to the projections, and in • An accurate SOC estimation constitutes the base of a battery
vestment should be made in areas that are considered to be energy management system. An aging battery begins to lose its
weak. EV integration with renewables can be incentivized as cyclable lithium and other materials in time. Besides, its in
detailed in the next section. ternal resistance increases with a capacity loss. The term, state
of health (SOH) is used to compare an aged battery’s storage
7.3. EV integration with renewables, EV charging tariffs, and V2G in and electrical energy delivery abilities with a new one.
Turkey Therefore monitoring of SOH of batteries is crucial to prevent
failure and accidents as well as extend the useable lifetime
The high solar and wind energy potential might be another advan [138–140].
tage of Turkey regarding EVs. By the implementation of smart charging • Undoubtedly, the new battery-related subsectors or applica
infrastructure and EV-RES integration, the cost of EV charging from tions (refurbishing and second-life, recycling etc.) will come
renewables can become lower in Turkey than the other countries. out with increased EV penetration [141]. Increasing on-site
renewable consumption as a stationary system [142], grid
(9) The excess solar generation during midday hours can be used for frequency regulation [143], back-up storage system [144], and
EV charging, and the storage capability of the EVs can be a so enabling demand-side effectiveness can be exemplary appli
lution to overcome the “duck curve” problem, as well as an EV cations [74].
battery can stabilize the intermittent nature of RESs in Turkey. • Taking into account Turkey’s current renewable energy struc
• To effectively utilize the integration with RESs, Turkey should ture and grid conditions, a detailed analysis can be performed
introduce other price-based tariffs than the currently available by the researchers. In addition, considering the potential of the
time-of-use (TOU) rate, such as real-time pricing (RTP) in the country, exemplary business models and applications can be
medium-term. Or, price-based rates exclusively for EVs should made by entrepreneurs for the second-life market.
be provided as started to be applied in different countries with
reduced rates during the off-peak period. Although the off-peak In a coordinated system, the negativities caused by EV charging can
period is usually the night time, in locations such as California be reduced as much as possible. In this way, investments and resources
or Australia, the new off-peak has started to become midday can be managed better.
due to high PV generation.
11Ö. Gönül et al. Renewable and Sustainable Energy Reviews 143 (2021) 110913
Table 13
The proposed priority roadmap for EVs and subsectors in Turkey.
Short term (1–3 years) Medium term (4–10 years) Long term (10+ years)
EV • Comprehensive regulation covering EV and all sub-sectors • Increasing the public e-transportation (e- • Bringing the local EV brand to the
• Increasing public awareness of e-mobility buses, e-taxis etc.) global
• Purchase subsidy and tax reductions • Being an EV production center as in
ICEV
EVCS • Common mobile platform • Improving fast charging facilities • Investment planning with detailed
• Country-wide distribution to eliminate range anxiety analysis of grid effects
Battery • Developing intelligent battery management system and • Production of domestic battery cell and • Improving the second-life battery inte
technologies encouraging researchers on the subject incentives for new technologies gration with renewables
(11) PV car parks are a good solution for reducing the adverse effects especially with the use of EVs in public fleets and public transportation.
of EV charging on the grid. Yet, the current car parks equipped In addition, taking into account the global car manufacturing companies
with PVs in Turkey are mostly without EVCSs and only serve to that operate in Turkey, various opportunities such as tax reduction or
sell electricity to the grid. incentives can be provided, in case they shift their EV facilities to
• Additional feed-in tariff incentives [145] or grants [146] can be Turkey.
provided for PV car parks in Turkey, as applied in other Moreover, various steps should be taken on the development of the
countries (especially in northern Turkey which is densely EVCS infrastructure before 2022, taking into account that the absence of
populated, needs more infrastructure investments, and has a sufficient number of EVCSs is one of the serious barriers to EV adop
lower solar radiation). This can also provide lower grid infra tion. Also, determining a regulatory authority related to EVCSs, estab
structure investments with lower capacity increase. lishing a common mobile platform that unites and provides access to all
(12) In the short-term, V2G seems like a less effective solution in EVCSs, improvement of the grid infrastructure, and integration of RESs
Turkey due to the low electricity prices in the country (i.e. 5th with EVCSs are other issues that should be further improved. Lastly, and
cheapest household electricity prices among 37 countries in perhaps the most important of all, Turkey needs a clear roadmap for EVs
Europe in 2019) [147], and the current high cost of EV battery to resolve the uncertainty for investors and consumers in the sector.
replacement [148]. Therefore, relevant ministries and non-governmental organizations
should work together to establish targets and take steps accordingly.
7.4. SWOT analysis and EV roadmap of Turkey To sum up, an overall assessment of the EV and EVCS market in
Turkey’s context is presented in this study, and its findings are expected
Lastly, a SWOT (strengths, weaknesses, opportunities, and threats) to help decision/policy-makers, industry stakeholders, and researchers
analysis is made to summarize the discussion part and evaluate Turkey’s regarding the challenges and opportunities for EVs in Turkey.
competitive position considering internal and external factors in EV
transition and future EV industry (Table 12). CRediT author statement
After evaluating Sections 7.1-7.3 and considering Turkey’s current
conditions, a roadmap for EV and EV-related sub-sectors in Turkey can Ömer Gönül: Conceptualization, Resources, Visualization, Writing -
be determined in the short-, medium- and long-term as shown in review & editing. A. Can Duman: Conceptualization, Resources, Visu
Table 13. The matters included in Table 13 have been identified as a alization, Writing - review & editing. Önder Güler: Conceptualization,
priority to adapt the global EV technology trends and improve the Supervision, Review & editing.
infrastructure. These implications also coincide with the results of the
workshop held with the experts of the EV sector in cooperation with Declaration of competing interest
TEHAD and EY (Ernst & Young) [149]. As remarkable outputs of this
workshop, “lack of authority to determine the control rules and standard The authors declare that they have no known competing financial
of EVCS” and “high EVCS investment costs” were seen as the major interests or personal relationships that could have appeared to influence
barriers in particular. Besides, “range anxiety” and “poor public the work reported in this paper.
awareness” are also identified as other obstacles.
References
8. Conclusion
[1] Number of passenger cars and commercial vehicles in use worldwide from 2006
to 2015. Statista; 2017. https://www.statista.com/statistics/281134/number-of-
EVs, which are expected to be the vehicle technology of the future, vehicles-in-use-worldwide/. [Accessed 21 February 2020].
have increased their share in the vehicle market in recent years. [2] Mahmoudzadeh Andwari A, Pesiridis A, Rajoo S, Martinez-Botas R, Esfahanian V.
A review of Battery Electric Vehicle technology and readiness levels. Renew
Currently, their adoption in countries highly depends on the policies and Sustain Energy Rev 2017;78:414–30. https://doi.org/10.1016/j.
incentives provided by the governments. Turkey has not fully adopted rser.2017.03.138.
the EV technology yet, and there are still deficiencies in incentives, [3] Production statistics-overview. Int Organ Mot Veh Manuf 2019. http://www.oi
ca.net/production-statistics/. [Accessed 21 February 2020].
regulations, and policies. [4] Estimated worldwide automobile production from 2000 to 2018. Statista; 2019.
In this review, the state of the EV and EVCS market in Turkey, as well https://www.statista.com/statistics/262747/worldwide-automobile-productio
as EV-related sub-sector activities and existing legislative regulations n-since-2000/. [Accessed 21 February 2020].
[5] CO2 emissions from transport (% of total fuel combustion). World Bank; 2019. htt
were examined considering the current status of EVs in the world and ps://data.worldbank.org/indicator/EN.CO2.TRAN.ZS. [Accessed 25 January
the EU. Although Turkey has provided various tax discounts and made 2020].
several regulatory changes, there is no roadmap relating to the EV and [6] Sims R, Schaeffer R. Climate change 2014: mitigation of climate change. Intergov
Panel Clim Chang; 2014. https://www.ipcc.ch/site/assets/uploads/2018/02/ip
EVCS goals.
cc_wg3_ar5_chapter8.pdf. [Accessed 11 January 2020].
Currently, the public in Turkey is focused on the “local brand EV”. [7] Poullikkas A. Sustainable options for electric vehicle technologies. Renew Sustain
The prototype is introduced at the end of 2019 and the car is planned to Energy Rev 2015;41:1277–87. https://doi.org/10.1016/J.RSER.2014.09.016.
be released by 2022. However, the acceptance of EVs is still low in the [8] Huang Y, Wang H, Khajepour A, Li B, Ji J, Zhao K, et al. A review of power
management strategies and component sizing methods for hybrid vehicles.
country. Until the release, the consumer awareness of EVs and their Renew Sustain Energy Rev 2018;96:132–44. https://doi.org/10.1016/J.
visibility should further be increased with information campaigns, and RSER.2018.07.020.
12You can also read


