Renewable Energy and Jobs - Annual Review 2021 - mmmiiillllllionionion jobs jobs 2020
←
→
Page content transcription
If your browser does not render page correctly, please read the page content below

Renewable Energy and Jobs
Annual Review 2021

                 million jobs
                 i n 2020

                          SPECIAL EDITION
                          Labour and Policy Perspectives

                                           In Collaboration with

                                                 www.irena.org
© IRENA 2021
Unless otherwise stated, material in this publication may be freely used, shared, copied, reproduced, printed and/or stored,
provided that appropriate acknowledgement is given of IRENA as the source and copyright holder. Material in this publication
that is attributed to third parties may be subject to separate terms of use and restrictions, and appropriate permissions from
these third parties may need to be secured before any use of such material.
ISBN: 978-92-9260-364-9
Citation: IRENA and ILO (2021), Renewable Energy and Jobs – Annual Review 2021, International Renewable Energy Agency,
International Labour Organization, Abu Dhabi, Geneva.

ABOUT IRENA                                                                              ABOUT ILO
The International Renewable Energy Agency (IRENA) serves as the principal                The only tripartite U.N. agency,
platform for international co-operation, a centre of excellence, a repository of         since 1919 the ILO brings together
policy, technology, resource and financial knowledge, and a driver of action             governments, employers and workers
on the ground to advance the transformation of the global energy system. A               of 187 member States, to set labour
global intergovernmental organisation established in 2011, IRENA promotes                standards, develop policies and devise
the widespread adoption and sustainable use of all forms of renewable energy,            programmes promoting decent work
including bioenergy, geothermal, hydropower, ocean, solar and wind energy, in            for all women and men.
the pursuit of sustainable development, energy access, energy security, and low-
carbon economic growth and prosperity.
www.irena.org                                                                            www.ilo.org

ACKNOWLEDGEMENTS
Under the guidance of Rabia Ferroukhi, this report was authored by Michael Renner, Celia García-Baños (IRENA) and Arslan
Khalid (consultant), with valuable contributions from Ulrike Lehr, Mirjam Reiner, Samah Elsayed, Divyam Nagpal (IRENA)
and Laura Elkatiri (consultant). The report greatly benefitted from modelling work on the socio-economic footprint of the
energy transition undertaken by Ha Bui, Hector Politt (E3ME, Cambridge Econometrics) and Xavier Casals (consultant), and
hydropower jobs modelling contributed by Maximilian Banning (GWS).
IRENA expresses gratitude for valuable contributions made by colleagues at the International Labour Organization (ILO),
including Moustapha Kamal Gueye, Marek Harsdorff, Olga Strietska-Ilina and Hae Kyeung Chu. The authors also thank IRENA
national focal points for country data, and Renata Grisoli (UNDP) for data on Brazil’s bio-ethanol workforce.
For further information or to provide feedback, go to publications@irena.org
Download from www.irena.org/publications

DISCLAIMER
This publication and the material herein are provided “as is”. All reasonable precautions have been taken by IRENA to
verify the reliability of the material in this publication. However, neither IRENA, ILO, nor any of their officials, agents, data
or other third-party content providers provides a warranty of any kind, either expressed or implied, and they accept no
responsibility or liability for any consequence of use of the publication or material herein.
The information contained in the publication does not necessarily represent the views of IRENA, ILO or all of their
Members. The mention of specific companies or certain projects or products does not imply that they are endorsed
or recommended by IRENA or ILO in preference to others of a similar nature that are not mentioned. The designations
employed and the presentation of material herein do not imply the expression of any opinion on the part of IRENA or ILO,
concerning the legal status of any region, country, territory, city or area or of its authorities, or concerning the delimitation
of frontiers or boundaries.

IRENA HEADQUARTERS
Masdar City
P.O. Box 236, Abu Dhabi, United Arab Emirates
www.irena.org
FO R E WO R D
The year 2020 demonstrated that not even a global pandemic can slow the advance of renewable
energy. It also revealed the tight connections between environments, economies and human well-
being. These, and the rapidly rising challenges of climate change, reinforce the need for a just
and inclusive transition toward a clean, reliable energy supply and decent and climate-friendly
jobs. That transition is well under way: Last year jobs in the renewable energy sector grew to
12 million.
The 1.5°C pathway put forward by the International Renewable Energy Agency (IRENA) in its World Energy
Transitions Outlook will lead to 122 million energy sector jobs globally by 2050 (of which 43 million will be in
renewables) and will set the conditions for long-term economic resilience, development and equality. Solar
photovoltaics will provide the most jobs by 2050 (20 million), followed by bioenergy, wind and hydropower.
Renewable energy employment has been on an upward trajectory since IRENA’s first jobs report in 2012.
Then as now, solar photovoltaics has led the field, accounting for some 4 million jobs today. Large-scale
solar facilities feed power to the grid, while small, off-grid solar applications offer much-needed access to
electricity to remote and energy-poor communities. Although off-grid sales took a hit from COVID-19 in 2020,
off-grid solutions will continue to power farming, food processing, education and health care.
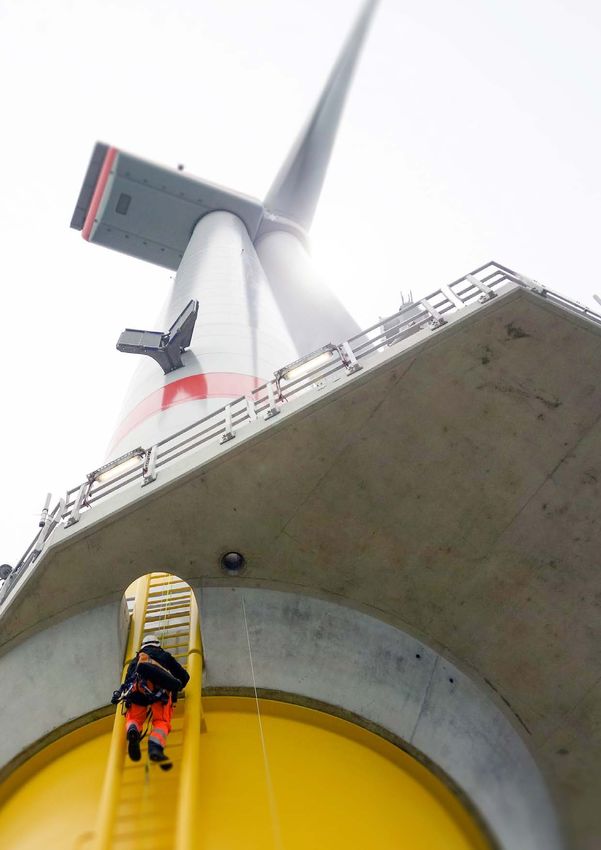
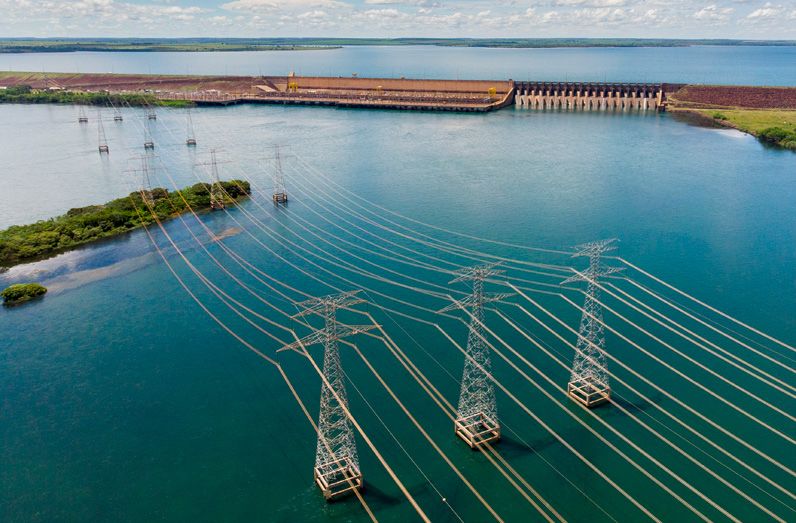
Bioenergy employed some 3.5 million people and hydropower another 2.2 million. Wind energy follows with
1.25 million jobs, with a growing number in operations and maintenance and in offshore wind energy. The wind
sector’s workforce is still male dominated; only a fifth of workers are women, comparable to the traditional
oil and gas industry. The renewable energy sector as a whole shows a better gender balance (32% women).
Yet, much remains to be done to ensure that the industry benefits fully from women’s skills, talents and ideas.
The energy transition has revealed the need to expand skills in all regions of the world to create a capable
renewable energy workforce. Meeting that need will require more vocational training, stronger curricula and
greater training of trainers. Making use of digital innovations in teaching is another task, especially in light of
the pandemic.
Decent jobs will not be created automatically in the energy transition; ambitious policy support and
investments in a future-oriented, climate-safe and just energy transition will need to be sustained and
expanded. IRENA is working to operationalise policy commitments for job creation in the sector.
Comprehensive policy frameworks grounded in effective
social dialogue must use labour market incentives to open
new possibilities for workers who lose jobs in conventional
energy, along with industrial and enterprise policies to leverage
existing domestic industries. Social protection measures may
be needed in the interim and subsequently. The ILO tripartite
Guidelines for a just transition towards environmentally
sustainable economies and societies for all offer an important
framework to further promote decent work and social justice in
the energy transition, addressing all aspects from the quantity
to the quality of employment.
The ongoing energy transition is poised to be one of history’s Francesco Guy Ryder
great success stories if the world is indeed able to accelerate La Camera
increase its speed and scale through a holistic approach. Director-General Director-General
International Renewable International Labour
Energy Agency Organization
3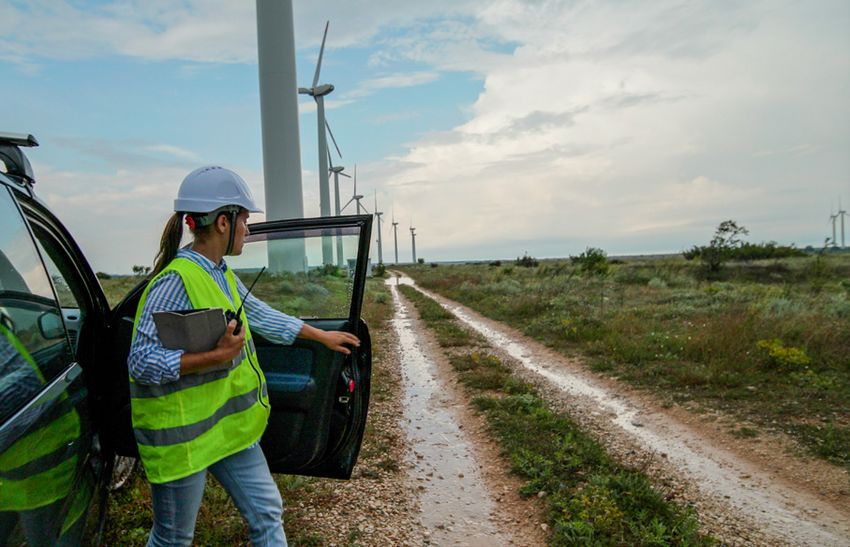
RENEWA B LE EN ER GY AN D J O B S – A NNUA L RE VI E W 2 0 2 1

4
TA B L E O F C O N T ENT

CONTENTS
Foreword             ................................................................3
Key Facts and Key Projections . . . . . . . . . . . . . . . . . . . . . . . . . . . . . . . . . . . . . . . . . . . . . . . . 9
RENEWABLE ENERGY AND JOBS: ANNUAL REVIEW 2021 . . . . . . . . . . . . . . . . . . . . . 10

CHAPTER 1           RENEWABLE ENERGY JOBS: MAIN FINDINGS . . . . . . . . . . . . . . . . . . . . . 11
                    The complex impact of COVID-19 . . . . . . . . . . . . . . . . . . . . . . . . . . . . . . . . 15
                    Renewable energy employment by technology . . . . . . . . . . . . . . . . . . . 20
                    Renewable energy employment in selected countries . . . . . . . . . . . . . 34

CHAPTER 2 EMPLOYMENT FOR A CLIMATE-SAFE FUTURE:
          OUTLOOK FOR THE ENERGY TRANSITION . . . . . . . . . . . . . . . . . . . . . . . 52
                    Future jobs in renewables . . . . . . . . . . . . . . . . . . . . . . . . . . . . . . . . . . . . . . . 54
                    Future jobs in the overall energy sector . . . . . . . . . . . . . . . . . . . . . . . . . . 59
                    Policy needs and opportunities . . . . . . . . . . . . . . . . . . . . . . . . . . . . . . . . . . 62

CHAPTER 3 SKILLS NEEDS FOR THE ENERGY TRANSITION . . . . . . . . . . . . . . . . . . . 65
                    Occupational patterns and skill levels . . . . . . . . . . . . . . . . . . . . . . . . . . . . 66
                    Skills synergies and misalignments in the energy transition . . . . . . . . 70
                    Policies to support the skill side of the energy transition. . . . . . . . . . . 75
                    Skills and a just transition . . . . . . . . . . . . . . . . . . . . . . . . . . . . . . . . . . . . . . .80
                    Investment in transition training funds . . . . . . . . . . . . . . . . . . . . . . . . . . . 83

CHAPTER 4 THE JOBS AGENDA FOR A JUST TRANSITION . . . . . . . . . . . . . . . . . . . . 84
                    What kinds of jobs are needed for a just transition? . . . . . . . . . . . . . . . 84
                    A comprehensive policy framework for jobs and a
                    just energy transition . . . . . . . . . . . . . . . . . . . . . . . . . . . . . . . . . . . . . . . . . . . 87

                    REFERENCES . . . . . . . . . . . . . . . . . . . . . . . . . . . . . . . . . . . . . . . . . . . . . . . . . . 92

                                                                                                                                                                   5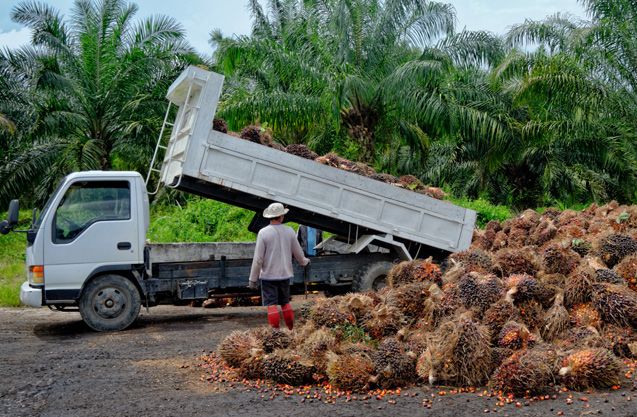
RENEWA B LE EN ER GY AN D J O B S – A NNUA L RE VI E W 2 0 2 1

                              List of boxes
                              In Focus Box 1. Building a diverse workforce . . . . . . . . . . . . . . . . . . . . . . . . . . . . . . . . . 14
                              In Focus Box 2. Jobs and livelihoods in the access sector . . . . . . . . . . . . . . . . . . . . . 31
                              In Focus Box 3. Jobs in battery storage and green hydrogen . . . . . . . . . . . . . . . . . . 32
                              In Focus Box 4. Management-labour co-operation in US offshore wind
                                              development . . . . . . . . . . . . . . . . . . . . . . . . . . . . . . . . . . . . . . . . . . . . . . . 43
                              In Focus Box 5. IRENA’s World Energy Transitions Outlook. . . . . . . . . . . . . . . . . . . . . 53
                              In Focus Box 6. Post-COVID recovery and job creation . . . . . . . . . . . . . . . . . . . . . . . . 58
                              In Focus Box 7. Jobs implications under the ILO’s sustainability
                                              scenario to 2030 . . . . . . . . . . . . . . . . . . . . . . . . . . . . . . . . . . . . . . . . . . . . 61
                              In Focus Box 8. Transitioning workers from offshore oil and gas to wind:
                                              UK findings . . . . . . . . . . . . . . . . . . . . . . . . . . . . . . . . . . . . . . . . . . . . . . . . . 71
                              In Focus Box 9. Skills synergies between offshore oil and gas and
                                              offshore wind . . . . . . . . . . . . . . . . . . . . . . . . . . . . . . . . . . . . . . . . . . . . . . . 72
                              In Focus Box 10. Skill delivery pathways . . . . . . . . . . . . . . . . . . . . . . . . . . . . . . . . . . . . . . 76
                              In Focus Box 11. National occupational standards in India . . . . . . . . . . . . . . . . . . . . . . 79
                              In Focus Box 12. How can countries effectively build the skills and human
                                               capacities for a just transition to net-zero? . . . . . . . . . . . . . . . . . . . .80
                              In Focus Box 13. Renewable energy wages: Findings from the United States . . . . . 86
                              In Focus Box 14. The Annual Review series and IRENA’s work on the
                                               socio-economic benefits of the energy transition . . . . . . . . . . . . . . 91

                              List of tables
                              Table 1. COVID-19’s impacts on employment in segments of the
                                       renewable energy value chain . . . . . . . . . . . . . . . . . . . . . . . . . . . . . . . . . . . . . . . 16
                              Table 2. Estimated direct and indirect jobs in renewable energy
                                       worldwide, by industry (thousand jobs), 2019–20 . . . . . . . . . . . . . . . . . . . . . 35
                              Table 3. Renewable energy jobs worldwide in the 1.5°C Scenario
                                       and differences with the PES, 2030 and 2050 . . . . . . . . . . . . . . . . . . . . . . . . 54
                              Table 4. Top trades in oil and gas, wind and solar projects,
                                       United States . . . . . . . . . . . . . . . . . . . . . . . . . . . . . . . . . . . . . . . . . . . . . . . . . . . . . . 74

6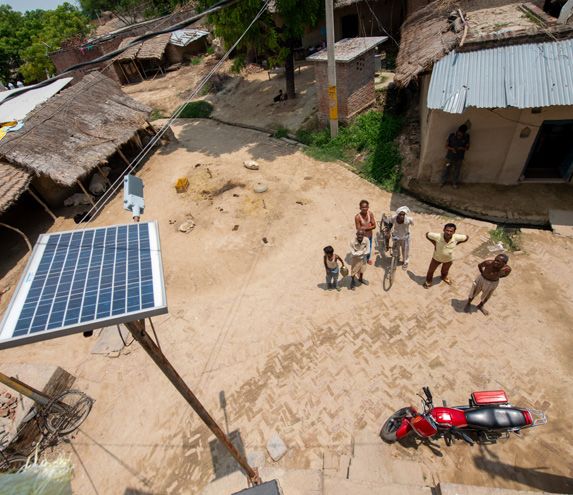
L IS T O F F IG U RE S

List of figures
Figure 1.         Global renewable energy employment by technology, 2012-20 . . . . . . . . 11
Figure 2. Factors influencing renewable energy employment . . . . . . . . . . . . . . . . . . 12
Figure 3. Women’s share in oil and gas, renewables, and wind power,
          with breakdown by STEM, non-STEM and administrative
          positions in renewables . . . . . . . . . . . . . . . . . . . . . . . . . . . . . . . . . . . . . . . . . . . . 18
Figure 4. Global renewable energy employment by technology . . . . . . . . . . . . . . . 20
Figure 5. Solar PV employment: Top ten countries . . . . . . . . . . . . . . . . . . . . . . . . . . . . 21
Figure 6. Liquid biofuels employment: Top ten countries . . . . . . . . . . . . . . . . . . . . . .23
Figure 7.         Wind employment: Top ten countries . . . . . . . . . . . . . . . . . . . . . . . . . . . . . . .25
Figure 8. Hydropower employment by country, 2020 . . . . . . . . . . . . . . . . . . . . . . . . 29
Figure 9. Renewable energy employment in selected countries . . . . . . . . . . . . . . . 34
Figure 10. IRENA’s PES and 1.5°C Scenarios . . . . . . . . . . . . . . . . . . . . . . . . . . . . . . . . . . .53
Figure 11. Jobs in renewable energy, by technology, in the 1.5°C Scenario
           and PES, 2030 and 2050 . . . . . . . . . . . . . . . . . . . . . . . . . . . . . . . . . . . . . . . . . 56
Figure 12. Renewable energy jobs, by segment of value chain, in the
           1.5°C Scenario and PES, 2030 and 2050 . . . . . . . . . . . . . . . . . . . . . . . . . . . . .57
Figure 13. Energy sector jobs by technology (left) and segments of value
           chain (right) under the PES and 1.5°C Scenario, 2030 and 2050. . . . . . . .59
Figure 14. Jobs created and destroyed in an energy sustainability
           scenario to 2030 . . . . . . . . . . . . . . . . . . . . . . . . . . . . . . . . . . . . . . . . . . . . . . . . . . 61
Figure 15. Human resource requirements for workers in solar PV,
           wind energy (onshore and offshore) and solar water heaters . . . . . . . . . 66
Figure 16. Renewable energy jobs, 2050, by selected technologies
           and occupational categories . . . . . . . . . . . . . . . . . . . . . . . . . . . . . . . . . . . . . . .67
Figure 17. Occupations most in demand across industries in a global
           energy sustainability scenario, 2030 . . . . . . . . . . . . . . . . . . . . . . . . . . . . . . . 68
Figure 18. Distribution of energy sector jobs by educational level . . . . . . . . . . . . . . . 69
Figure 19. Skill-delivery pathways . . . . . . . . . . . . . . . . . . . . . . . . . . . . . . . . . . . . . . . . . . . .76
Figure 20. Applications of information and communications
           technology for skill delivery . . . . . . . . . . . . . . . . . . . . . . . . . . . . . . . . . . . . . . . .78
Figure 21. Sector focus of India’s Skills Council For Green Jobs . . . . . . . . . . . . . . . . . .79
Figure 22. An enabling policy framework for a just and inclusive energy
           transition . . . . . . . . . . . . . . . . . . . . . . . . . . . . . . . . . . . . . . . . . . . . . . . . . . . . . . . .87
Figure 23. Jobs in the just energy transition: Challenges and policies . . . . . . . . . . . 90
Figure 24. IRENA’s knowledge base on renewable energy employment
           and the socio-economics of the energy transition . . . . . . . . . . . . . . . . . . . . 91

                                                                                                                                                                   7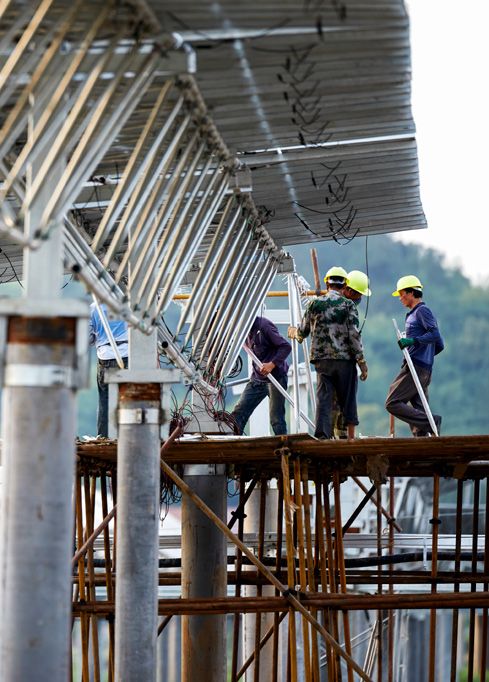
KEY NUMBERS

    12     million renewable
           energy jobs in 2020

    39 %   in China

     4     million jobs in the
           solar PV industry

           of renewable

    32 %
           energy jobs are
           held by women

8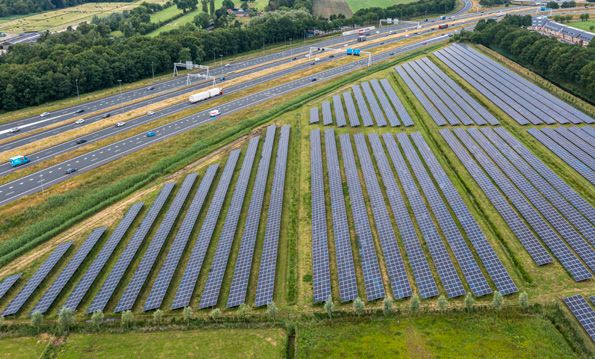
Annual Review 2021

KEY FACTS
R Renewables fared better than conventional energy during the COVID-19 pandemic, but
  impacts were uneven among individual countries, technologies and segments of the value
  chain. Employment in 2020 was shaped first by delays and later by surges in activity.
R Worldwide employment in renewable energy was estimated at 12 million in 2020, up from
  11.5 million in 2019.
R At 4 million workers, the solar PV industry employs a third of the total renewable energy
  workforce.
R Sales of off-grid solar PV equipment suffered because of COVID-19. Companies managed to
  avoid layoffs in many cases.
R Biofuels jobs worldwide fell slightly to 2.4 million (from 2.5 million), owing to COVID-19–driven
  reductions in demand, lower prices for conventional transport fuels and some adverse policy
  changes.
R Wind power supports 1.25 million jobs. The offshore segment is gaining prominence, as
  multiple countries build or expand their domestic industrial base.
R The integration of local content and local employment remains a challenge, particularly in
  wind energy, and requires further efforts in contracting arrangements, technical development
  and co-operation, and local capacity development.
R Decent jobs – good wages, safe workplaces and workers’ rights – are a must for a just
  transition. Outcomes depend on enforcing internationally recognised labour standards,
  national legislation and collective bargaining arrangements in individual industries.
R Women account for one-third of the global renewables workforce, but their participation
  varies widely among countries and industries. The pandemic has had a negative impact on
  gender equity.
R Along with gender equity, adequate opportunities for youth and greater inclusion of minorities
  and marginalised groups are the keys to developing a workforce that reflects society at large.

KEY PROJECTIONS
Under IRENA’s 1.5°C-                  Jobs in the energy sector             As is the case today, solar will
compatible global pathway,            as a whole will grow to               make up the largest share of
the renewable energy sector           122 million in 2050 under             renewable energy jobs in 2050,
could account for 38 million          the 1.5°C pathway, compared           with 19.9 million jobs, followed
jobs by 2030 and 43 million by        with 114 million under current        by bioenergy (13.7 million),
2050, double the number under         policies and pledges.                 wind (5.5 million) and
current policies and pledges.                                               hydropower (3.7 million).

                                                                                                               9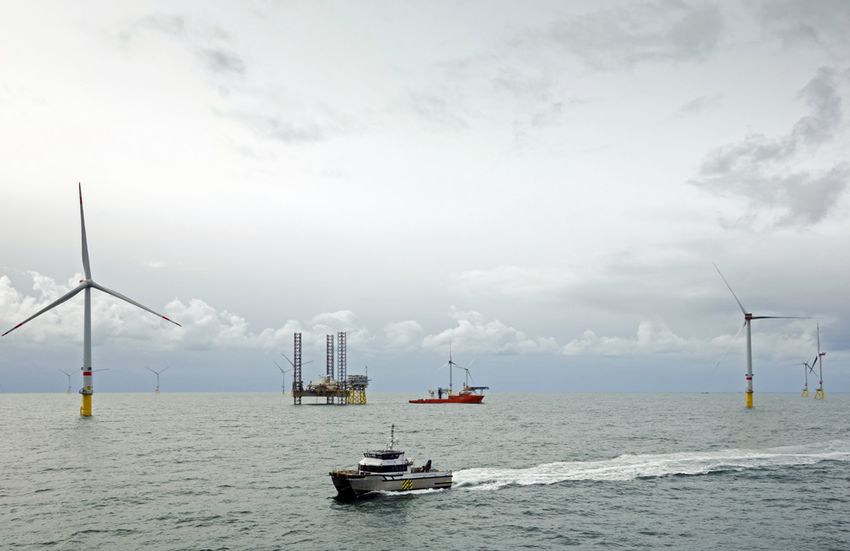
RENEWA B LE EN ER GY AN D J O B S – A NNUA L RE VI E W 2 0 2 1

                              RENEWABLE
                              ENERGY JOBS
                               Annual Review 2021

                               This eighth edition of IRENA’s Renewable Energy and Jobs – Annual Review series provides
                               the most recent estimates of renewable energy employment. It is part of IRENA’s ongoing
                               effort to refine and improve underlying data. In addition to IRENA’s employment factor
                               calculations, the reported job numbers are based on a wide range of studies and reports
                               by government agencies, industry associations, non-governmental organisations and
                               academic experts, with information of varying focus, detail and quality.

                               This special edition, co-published with the International Labour Organization, expands on
                               the scope of earlier editions. Following a discussion of impacts of the COVID-19 pandemic,
                               Chapter 1 surveys the renewable energy employment landscape as of 2020, with findings
                               at the global level and for individual industry segments. It then discusses employment
                               results for selected countries in relation to deployment trends, policy contexts and
                               pandemic impacts, with an eye to job quality as well as job numbers.

                               The need to accelerate the energy transition through expanded use of renewables
                               is evident in the face of a growing number of extreme weather events and other
                               repercussions of climate change. Ambitious policy action in response to these realities will
                               translate into more jobs in renewables, as indicated by IRENA’s World Energy Transitions
                               Outlook. Chapter 2 offers key employment findings from the Outlook’s scenarios for 2030
                               and 2050. Education and skills training, including efforts to retrain workers from fossil fuel
                               industries, will be essential to building the workforce of the future. Chapter 3 presents
                               key challenges and opportunities in this regard. Skills training is among the broad array
                               of policies needed to create large numbers of good jobs, develop a diverse workforce
                               and address other aspects of the unfolding energy transition. Finally, Chapter 4 examines
                               priority actions within a holistic policy framework and considers the kinds of jobs that are
                               likely to be created.

10
C H A PT E R 1
Chapter 1. RENEWABLE
ENERGY JOBS:
MAIN FINDINGS
The renewable energy sector employed 12 million people, directly and indirectly, in 2020.1
The number has continued to grow worldwide over the past decade. The solar photovoltaic
(PV), bioenergy, hydropower and wind power industries have been the largest employers.
Figure 1 shows the evolution of IRENA’s renewable energy employment estimates since 2012.2
Figure 1. Global renewable energy employment by technology, 2012-20
Million
jobs
12 0.27
0.18
Solar
0.82
0.18 0.82 photovoltaics
0.24 0.16 0.80 1.25
10 0.20 0.81 1.17 Bioenergy a
0.94 0.83 1.16
0.19 1.15 2.18
0.76 1.96
0.23 1.08 1.16 2.05 Hydropower b
8 0.50 1.03 1.99
0.83 2.16 2.06
0.22 2.04 3.52 Wind energy
0.89 3.58
2.21 3.18
6 3.05 Solar heating /
0.75
2.74 cooling
1.66 2.99 2.88
2.50 Others c
4
2.40 3.68 3.75 3.98
3.37
3.09
2.77
2 2.27 2.49
1.36
0
2012 2013 2014 2015 2016 2017 2018 2019 2020
7.3 8.5 9.5 10.0 10.1 10.5 11.1 11.5 12.0 Total
a Includes liquid biofuels, solid biomass and biogas.
b Direct jobs only.
c “Others” includes geothermal energy, concentrated solar power, heat
pumps (ground based), municipal and industrial waste, and ocean energy. Source: IRENA jobs database.
1 Data are principally for 2019–20, with dates varying by country and technology, including some instances where only earlier information is available. The data
for hydropower include direct employment only; the data for other technologies include both direct and indirect employment wherever possible.
2 The jobs numbers shown in Figure 1 reflect what was reported in each earlier edition of this series. IRENA does not revise estimates from previous years in
light of information that may become available after publication of a particular edition.
11RENEWA B LE EN ER GY AN D J O B S – A NNUA L RE VI E W 2 0 2 1
These employment trends are shaped by a multitude of factors (see Figure 2). Key among
them is the rate at which renewable energy equipment is manufactured, installed and put
to use (largely a function of costs and overall investments). Costs, especially of solar and
wind technologies, continue to decline. With relatively steady annual investments, lower
costs have translated into wider deployment. An increase in investments would boost
future job creation, even allowing for growing labour productivity. Policy guidance and
support remain indispensable for establishing overall renewable energy roadmaps, driving
ambition, and encouraging the adoption of transparent and consistent rules for feed-in
tariffs, auctions, tax incentives, subsidies, permitting procedures and other regulations.
Figure 2. Factors influencing renewable energy employment
TECHNOLOGY ADVANCES
AND FALLING COSTS /
INVESTMENT TRENDS
• Rising competitiveness
• Lower costs enable more
COVID-19 deployment per dollar spent
RESPONSES AND DEPLOYMENT:
RECOVERY EFFORTS NEW AND
• Impacts along supply chain
CUMULATIVE
• Renewables versus
CAPACITY
fossil fuel dynamics • Jobs in project development;
• Stimulus and job manufacturing; sales;
retention construction and installation
• Remote work • Jobs in operations
arrangements and maintenance
POLICY
RENEWABLE ENERGY CHANGES IN
AMBITION
EMPLOYMENT LABOUR
• Deployment,
integrating, and
CREATION INTENSITIES
enabling policies • Automation;
• Industrial policies; use of drones;
trade policies; artificial intelligence
skill-training; labour • Economies of scale
market measures; • Learning effects
gender SUPPLY CHAIN
policies STRUCTURES
• Commodity, technology and
trade dependencies
• Geographic footprints
• Localisation efforts
12C H A PT E R 1
The geographic footprint of renewable energy employment – the physical location of
the jobs – depends on the dynamism of national and regional installation markets; on
technological leadership, industrial policy and domestic content requirements; and on the
resulting depth and strength of the supply chain in individual countries. As the industry
changes and matures, policy instruments must be fine-tuned.
Creating a skilled workforce – project managers, scientists, engineers, technicians,
electricians, welders, pipefitters, truck drivers, crane operators and many others – is also
essential. Balancing skills demand and supply requires close co-ordination among industry,
government and educational and training institutions to attract a broader and more
diverse set of candidates for the future workforce (see In Focus Box 1). The need for labour
inputs and skills changes over time as technologies mature, the scale and complexity of
operations grows, learning takes effect and automation progresses, raising demand for
people with backgrounds in fields such as artificial intelligence, computer science and
engineering, and telecommunications radio telemetry, among others.
13RENEWA B LE EN ER GY AN D J O B S – A NNUA L RE VI E W 2 0 2 1
In Focus Box 1.
Building a diverse workforce
One of the key elements of a just energy transition Many companies have introduced measures to
is ensuring that the workforce includes people from include people with disabilities. For example, in Hull
underrepresented and marginalised groups. Population (United Kingdom, UK), Siemens Gamesa partnered
groups of particular concern in this context are women, with Pathway Plus in 2017 to offer internships and
minorities, people with disabilities, low-income people, subsequent employment to students with disabilities.
youth and older workers. For many, the challenge is In Canada, the same company announced a multiyear
magnified where energy access is lacking. accessibility plan for 2017–21 to remove accessibility
Targeted education and training will play a key role in barriers for employees and customers and to align
addressing disparities and promoting inclusion. Early operations with the Accessibility for Ontarians with
exposure to renewable-energy-related topics and Disabilities Act. Another firm, Électricité de France, is
careers through school curricula is vital to inspire young a member of the International Labour Organization’s
people of all backgrounds to pursue education, training Global Business and Disability Network; it has
and a career in the sector. This requires adequately established multistakeholder networks to support
employees with disabilities and monitor progress on
integrating renewable energy into national curriculum
disability-related action plans (ILO, 2019b).
frameworks, as well as training for teachers and career
advisors. Other important measures for diversifying the Diversifying the energy workforce is not only a
talent pipeline include scholarships and funded training question of equity and progress toward a just
opportunities, mentorship schemes and targeted transition; it also allows the renewable energy sector
apprenticeship programmes. As an example, the to draw from a wider and deeper pool of talent. The
United States (US) Energy Department's programme size of this talent pool will be increasingly important
for Minority University Research Associates encourages as the renewable energy sector expands and demands
minority students to pursue careers in science and growing numbers of people with technical, business,
technology and supports research faculty (including administrative, economic, legal and other skills.
principal investigators) from selected institutions in their Indications are that the sector may soon confront
research projects (US DOE, 2012). The department’s shortages of well-trained and experienced individuals,
Equity in Energy initiative expands the inclusion of even as wages rise. Moving toward a more diverse,
minorities, women, veterans and formerly incarcerated inclusive workforce therefore represents a tremendous
persons (US DOE, 2021d). opportunity for renewable energy.
14C H A PT E R 1
The complex impact of COVID-19
The COVID-19 pandemic loomed over the global economy for most of 2020 and 2021,
affecting both the volume and structure of energy demand. Employment, including in the
energy sector, has been deeply affected by repeated lockdowns and other restrictions
which put pressure on supply chains and constrained economic activity. Across the
global economy, millions of jobs were lost and many others put at risk. According to the
International Labour Organization (ILO, 2021), 8.8% of global working hours were lost in
2020, equivalent to 255 million full-time jobs. Available information indicates that women
were more affected than men, given that they tend to work in sectors more vulnerable to
economic shocks. This comes on top of a long-standing imbalance in the energy sector,
including renewables, i.e. a marked gender inequality. A two-page feature on this topic
begins on page 18.
In renewable energy as elsewhere in the economy, the ability of companies and
industries to cope with the pandemic and comply with social-distancing requirements
in the workplace varies enormously. Companies and government agencies face not
only the direct health impacts of the virus, such as sick and quarantined workers or
temporary factory shutdowns, but also the economic repercussions of border closures
and interruptions in deliveries of raw materials and components.
Project delays and supply disruptions prompted some rethinking of complex international
supply chains. The pandemic also caused organisations and institutions to consider remote
working arrangements, although the ability to implement them differs enormously across
industries and among occupational groups. Generally, however, the ability of employees
to use videoconferencing and other software to work in far-flung locations rather than
in specific buildings and hubs may well affect where jobs will be created in the future.
Available information suggests that, overall, renewable energy fared well compared
with conventional energy 3 – indeed, far better than expected. Worldwide, the more than
260 gigawatts (GW) of renewables installed during 2020 expanded cumulative capacity
by about 10%, a substantial uptick from the 180 GW added in 2019. Solar and wind power
fared exceptionally well, accounting for a combined 238 GW of total additions in 2020.
Solar PV added 127 GW, up from 98 GW in 2019; wind additions doubled from 58 GW to
111 GW. By contrast, bioenergy power capacity expanded by less than half the pace set in
2019 (2.5 GW compared to 6.4 GW) (IRENA, 2021a). And biofuels demand fell significantly
in some countries, owing to lower costs of conventional fuels.
Notwithstanding the generally impressive performance, uncertainties and disruptions
dotted the way. Impacts varied by renewable energy technology, by segment of the
renewables value chain (see Table 1) and by end-use sector.
3 Hit hard by the reduction in oil use, many oil companies cut back on exploration, laid off workers and wrote off assets; others merged or folded. In the United
States, for example, about 90 000 jobs out of the 640 000 in the mining, quarrying and oil and gas extraction sector were lost during 2020 (US BLS, 2021).
15RENEWA B LE EN ER GY AN D J O B S – A NNUA L RE VI E W 2 0 2 1
Table 1: COVID-19’s impacts on employment in segments of the renewable
energy value chain
Segment of value chain Magnitude of impact Comments
Project planning Low Many job roles lend themselves to remote
working arrangements.
Manufacturing and High in short term Factory workers, technicians and engineers
procurement have been heavily affected by temporary
factory closures.
Transport and logistics High in medium term This segment was heavily affected by parts
shortages, social distancing measures,
quarantines and border controls.
Construction and High The segment was hit by lockdowns and
installation delays; limits on numbers of workers
allowed on-site; and social distancing
requirements. The shock waned in the
second half of 2020.
Operations and Low to medium Energy generation is an essential service,
maintenance and the physical space available at wind
and solar farms often allows for social
distancing. But border closures and
quarantine rules restricted travel to some
project sites.
Technology Magnitude of impact Comments
Distributed renewables Very high Demand was affected by lower incomes
and social-distancing requirements.
Biofuels High Demand was cut by a drop in transport
volume, moderated by a rise in blending
mandates in some countries.
Source: Adapted and updated from IRENA, 2020a.
16C H A PT E R 1
In many countries a cycle was established in which delays were followed by surges of
activity. This reflected the newfound reality in which countries’ varying degrees of success
in reducing COVID-19 infections alternated with a resurgence of cases. But some of the
late surge was also driven by developers rushing projects to meet permitting deadlines
(some of which were extended in response to pandemic delays) or reacting to impending
changes in policies, such as expiring tax credits, phaseouts of subsidies or cuts in feed-in
tariffs. In a sense, the pandemic further amplified the ups and downs seen in the sector in
ordinary years.
Due to the mobility constraints inherent in the COVID-19 policy response, transport energy
demand was far more affected than electricity use. This played to renewables’ advantage,
in that the bulk of renewable capacity has been installed in the power sector, whereas
renewables’ role in transport fuels remains quite small for the time being. An added wild
card were the extreme swings in the price of oil during parts of the year, triggered by
oversupply and a price war among some major producers. Cheaper petroleum fuels had
the effect of diminishing demand for biofuels, as mentioned earlier.
Experiences diverged not only by end-use sectors, but also by country, with implications
for local employment. The lion’s share of new renewables capacity installed in 2020 was
added in China, already the dominant country in the field. In the wind sector, China’s share
of new installations was 65%; in solar PV it was 39% (IRENA, 2021a). Collectively, the rest
of the world still managed to add record amounts of capacity, but this was distributed
unevenly. Some countries, like India, installed far less than in previous years, while others,
like the United States, added unparalleled amounts despite the pandemic. For still others,
particularly in Europe, the record was mixed.
Off-grid renewable power was among the categories that performed less well, with
capacity additions during 2020 at a considerably lower level than in 2019, the last
pre-COVID year. COVID-19’s impacts came on the heels of other challenges to off-grid
development, such as limited funding. Off-grid solar sales plummeted in many developing
countries, as discussed in the next section.
17RENEWA B LE EN ER GY AN D J O B S – A NNUA L RE VI E W 2 0 2 1
Gender inequality in renewable energy workplaces
The COVID-19 pandemic has had a significant impact IRENA’s surveys have found that women account for
on women all over the world, amplifying or preserving only 32% of the overall renewable energy workforce
the inequities they confront every day. At home, and 21% of the wind workforce. When it comes to roles
women have more domestic chores due to the impact in science, technology, engineering and mathematics
of the pandemic. At work, they still represent a small (STEM), these figures are even lower: 28% and 14%,
share of the labour force. respectively (see Figure 3). While this demonstrates
that women have a much stronger presence in
The gender dimensions of renewable energy are
renewable energy than in the energy sector as a
seldom captured in national economic statistics, as
whole and in oil and gas, it confirms that they remain
gender-disaggregated data are especially hard to find.
underrepresented. Reports from countries such
Seeking to address this situation, IRENA undertook an
as Canada, Germany, Italy, Spain and the United
initial gender analysis in its report Renewable Energy
States all indicate that fewer than 30% of jobs in the
and Jobs (IRENA, 2013), followed by similar surveys
renewable energy sector are held by women
in 2016 (IRENA, 2016a), 2017 (BNEF, CEBC and
IRENA, 2017) and 2018 (IRENA, 2019). In 2020, IRENA IRENA’s analysis also finds that women are more
published a report on gender aspects in wind energy likely to be employed in lower-paid, non-technical,
(IRENA, 2020b) and in 2022 will release a new report administrative and public relations positions than
focused on the solar PV industry. in technical, managerial or policy-making positions
Figure 3: Women’s share in the oil and gas, renewables, and wind power workforce, with
breakdown by STEM, non-STEM and administrative positions in renewables
21% 32%
Women‘s share in wind energy:
Admin 35%
Non-STEM 20% Average share in Average share in
wind energy renewable energy
STEM 14%
Women‘s share
in segment
Administrative
professionals 45%
Non-STEM
professionals 35%
STEM
professionals
28%
0 10 20 30 40 50 Jobs (%)
22%
Average share in oil and gas
Note: STEM = science, technology, engineering and mathematics.
Based on: IRENA, 2019, 2020b.
18C H A PT E R 1
(IRENA, 2013). This contrasts sharply with the fact Workers employed by organisations that have fairness
that women represent more than half of university policies in place reported 10% lower levels of perceived
students and almost half of the labour force in the barriers to female employment. Reported perceptions
countries under study (Pearl-Martinez, 2015). of barriers were also lower among people entitled to
paid maternity leave (9%), those who benefit from
Both IRENA’s analyses and the rest of the literature
gender targets (8%) and those with access to training
are quite clear about the fact that women face a
opportunities (7%). The availability of paternity leave
series of barriers that make them less likely than men
and childcare facilities also had a significant positive
to take up a career in renewable energy. And when
impact on the perception of barriers to female
women do join, they confront attitudes, perceptions
employment, although relatively few employers in the
and structural obstacles that can make it difficult for
sample offered these benefits (IRENA, 2019).
them to stay in the workforce and to advance in their
careers. These barriers are not exclusive or specific Efforts are needed not just in the modern energy
to the energy sector, of course; they are found in the sector but also where access to energy is limited.
economy and society at large. But because women Respondents to IRENA’s survey noted that cultural and
make up such a large share of the talent pool for social norms, lack of gender-sensitive programmes and
renewable energy, dedicated measures are needed to policies, and lack of skills and training opportunities are
ensure equal access to job opportunities and capital key barriers that prevent women from participating in
for women-led enterprises. the decentralised renewable energy workforce.
IRENA’s work highlights policies in progress that can Policies and programmes should mainstream gender
help increase the share of women in the workforce. equity at all levels to ensure women are eligible to
These include equal-pay legislation; policies to participate in the workforce. For example, the multi-
accommodate caregiving responsibilities and institutional Sustainable Energy for All initiative aims
provide better work-life balance for all employees, to build the capacity of female energy leaders through
such as parental leave and part-time work; access to its Women at the Forefront Training Programme
education and training programmes through post- (SEforAll, 2021). The programme encompasses four
secondary courses, internships, scholarships and strategic activities: an internship programme; a
apprenticeships; and gender targets and quotas to mentorship programme that matches female energy
ensure a critical mass of female employees at all levels access professionals with mentors; technical training
of management, as well as in technical and operational that aims to train 1 750 young women in the skills
roles. In many cases policies on the books must be needed for careers in the access workforce; and
better enforced, and underlying social and cultural sponsored participation in industry events.
norms need to be addressed.
Renewable Energy and Jobs
DECEMBER 2013
19RENEWA B LE EN ER GY AN D J O B S – A NNUA L RE VI E W 2 0 2 1
Renewable energy employment by
technology
This section presents estimates for employment in solar PV, liquid biofuels, wind and
hydropower. Less information is available for other technologies such as solid biomass and
biogas, solar heating and cooling, concentrated solar power (CSP), geothermal energy and
ground-based heat pumps, waste-to-energy, and ocean or wave energy. Most of these
other technologies also employ fewer people (see Figure 4). Observations on off-grid and
mini-grid developments are also offered here, as well as glimpses at other energy transition
technologies (battery storage and green hydrogen).
Figure 4: Global renewable energy employment by technology
Solar
photovoltaic 3 975
Liquid biofuels 2 411
Hydropower 2 182
Wind energy 1 254
Solar heating/
cooling 819
Solid biomass 765
Biogas 339
Geothermal
energy 96
Municipal and
industrial waste 39
CSP 32
Others 105
0 500 1 000 1 500 2 000 2 500 3 000 3 500 4 000
Jobs (thousands)
Note: CSP = Concentrated solar power. "Others" include tide, wave and ocean energy, and jobs not broken down by individual renewable energy
technologies.
Source: IRENA Jobs database.
20C H A PT E R 1
Solar photovoltaic
4.0
Worldwide, solar PV added 127 GW of new capacity in 2020, up from
98 GW in 2019. More than 60%, almost 78 GW, was added in Asia, principally
in five countries (China, Viet Nam, India, the Republic of Korea and Japan);
million jobs
Europe installed 20.8 GW, the United States another 15 GW, Australia 4.4 GW and
Brazil 3.3 GW (IRENA, 2021a).
By the end of the year, strict pandemic lockdowns had ended in most countries, allowing
construction to resume. In China and the United States, for example, more than 40% of
the year’s installations took place in the last quarter. In Europe, by contrast, activities were
more evenly spread, with the last quarter being the weakest (Izquierdo et al., 2021).
IRENA estimates global solar PV employment at close to 4 million in 2020, up from
3.8 million in 2019.4 The global total includes an estimate of 342 000 off-grid jobs for South
Asia and parts of Africa. Of the leading ten countries shown in Figure 5, seven are in
Asia, two in the Americas and one in Europe. Together, the top ten accounted for almost
3.4 million jobs, or 85% of the global total. Among all countries, Asian nations held 79.4%
of the world’s PV jobs, reflecting the region’s dominance in manufacturing and strong
Figure 5: Solar PV employment: Top 10 countries
Million jobs
2.3
2.2 58 %
of PV
jobs
2.1
Top 10:
2.0
85%
of PV jobs
0.3
0.2
0.1
0
ina
es
an
ia
m
h
il
sia
y
a
az
ali
an
es
Ind
Na
tat
p
lay
Ch
str
Br
lad
rm
Ja
dS
t
Ma
Au
Vie
Ge
ng
ite
Ba
Un
Source: IRENA jobs database.
4 The countries for which IRENA’s database contains solar PV employment estimates represent 701 GW of cumulative installations in 2020, or 99.1% of the
global total. They represented 99.6% of new installations in 2020.
21RENEWA B LE EN ER GY AN D J O B S – A NNUA L RE VI E W 2 0 2 1
presence in installations. The Americas had 8.8% of all jobs; Europe held a 6% share (with
members of the European Union accounting for 4.9%); and the rest of the world another 6%.
China, the leading producer of PV equipment and largest installation market, accounted
for about 58% of PV employment worldwide, or some 2.3 million jobs (CNREC, 2021).
Japan added less capacity in 2020 than the previous year; IRENA estimates that jobs there
fell to 220 000 in 2020, from 241 000 in 2019. Employment in all solar technologies in
the United States dropped 6.7% in 2020, from some 240 000 to about 231 000 workers.
India’s on-grid solar employment is estimated at 93 900 jobs, with another 69 600 in
off-grid settings, for a total of 163 500 jobs. PV employment in Europe is estimated at
239 000 in 2020, of which 194 000 are in EU members states.
The industry is increasingly consolidated. In 2019, the leading ten firms supplied 83%
of global polysilicon and 95% of wafers. Given lower barriers to entry, cell and module
production are less concentrated, with 59% and 60% shares, respectively, for the top ten
(Ladislaw et al., 2021; BNEF, 2021a).
Employment in the main components of the solar PV manufacturing value chain is highly
concentrated in a few countries, with China in a dominant position. In 2019, two-thirds of
the world’s polysilicon output was produced by Chinese firms (some operating outside of
China), with another 14% each by companies headquartered in Germany and the Republic
of Korea (but the Korean plants closed in 2020), and 5% in the United States. Backed by
strong domestic polysilicon supplies, more than 90% of the world’s wafer manufacturing
capacity is in China. Chinese companies (with factories in China and Southeast Asia) also
contributed 78% of the world’s cell production and 72% of module output. China is also
home to the largest manufacturers of key module components like glass and aluminium
frames (Ladislaw et al., 2021; BNEF, 2021a). While Asia-based producers had a 95% share
of c-Si (mono- and poly-crystalline silicon) PV module production in 2020, Europe had a
3% share and North America 2% (Fraunhofer ISE, 2021).
The Fraunhofer Institute for Solar Energy Systems (Fraunhofer ISE, 2020) proposes
creation of a 10 GW PV production capacity in Europe, arguing that Europe’s technological
leadership can once again make it competitive in PV manufacturing. Manufacturing
now is highly automated, but up to 7 500 jobs could be created in the European value
chain – from wafers to modules. In addition, installation of PV systems creates about
3 500 full-time jobs per gigawatt of capacity.
22C H A PT E R 1
Liquid biofuels
2.4
Global biofuels production fell from 161 billion litres in 2019 to 151 billion in 2020,
a drop of 6%, reflecting the pandemic’s effect on transport energy demand
and the fact that lower crude oil prices made biofuels less competitive. Ethanol output fell
million jobs
8%, while biodiesel production (much smaller in volume than ethanol) held almost steady.
The United States and Brazil remained the world’s dominant ethanol producers, with a
combined 83% share, while biodiesel production was more spread out geographically,
with Indonesia, the United States and Brazil producing 45% of the global total and the
European Union another 31% (REN21, 2021).
IRENA estimates worldwide biofuels employment in 2020 at 2.4 million, a slight decline
from 2019. Fuel processing requires relatively few people, and the bulk of jobs are in the
agriculture supply chain, planting and harvesting feedstock. But many of the latter are
casual and seasonal in nature, rather than full-time, formal jobs. There are also distinctions
between plantation workers and independent farmers, with varying levels of labour
productivity.
Latin America accounts for 44.4% of all biofuel jobs worldwide and Asia (principally
Southeast Asia) for 33.6%. The more mechanised agricultural sectors of North America
and Europe translate into smaller employment shares – 11.8% and 10%, respectively.
Figure 6 shows the top ten countries, which together account for about 91% of global
estimated employment.
Figure 6: Liquid biofuels employment: Top 10 countries
Million jobs
0.9
0.8
36%
of biofuel
jobs
0.7 Top 10:
0.6
91%
of biofuels
jobs
0.5
0.4
0.3
0.2
0.1
0
il
sia
tes
bia
d
sia
ina
nd
ia
ia
az
n
an
Ind
ila
la
lay
e
Sta
Ch
lom
Br
on
m
Po
a
Ma
Th
Ro
Ind
d
Co
ite
Un
Source: IRENA jobs database.
23RENEWA B LE EN ER GY AN D J O B S – A NNUA L RE VI E W 2 0 2 1
Highly mechanised operations in the United States required a direct and indirect labour
force of about 271 000 people in 2020. Labour intensity is also relatively low in the
European Union, where biofuels employment was estimated at about 239 000 jobs in
2018, the most recent year for which complete data are available (EurObserv’ER, 2020).
Other producing countries depend much more on human labour. With about 871 000 jobs,
Brazil remains the world’s biggest liquid biofuels employer. According to revised estimates,
Colombia’s biofuels output declined for a second year in a row to 950 million litres in 2020
(USDA-FAS, 2020f). Employment factor calculations suggest that the number of people
involved was down more than 10%.5 As is true for biofuels producers in Southeast Asia,
Colombia’s 194 000 jobs in the supply chain are not all full-time equivalent (FTE) jobs.
Indonesia’s biodiesel employment remained virtually unchanged from 2019 at about
475 000, but the sector was buffeted by highly contradictory forces. While COVID-19
restrictions reduced the overall consumption of diesel fuels, a rise in the nation’s biodiesel
blending mandate from 20% to 30% was estimated to have lifted 2020 biofuels
consumption by 20%. At the same time, exports collapsed, owing not only to the
pandemic but also to unfavourable price trends vis-à-vis conventional diesel and 8-18%
countervailing duties imposed by the European Union in 2019.6 Preliminary estimates put
overall production at 7.8 billion litres, a slight increase over 20197 (USDA-FAS, 2020a).
Malaysia’s 2020 biodiesel production was projected at 1.25 billion litres, a 16% drop
reflecting lower domestic and export demand due to the COVID-19 pandemic and lower
prices for fossil-based diesel. The government also decided to defer to mid-2021 its plan
to increase the blending mandate from 10% biofuel to 20% (USDA-FAS, 2020b). IRENA
estimates that the biodiesel sector accounted for about 73 700 jobs in 2020, down about
15 000 from the previous year.8
The chief objective of Thailand’s biofuels development plan is to increase farm incomes
through higher feedstock demand for molasses, cassava and palm oil. However, ethanol
and biodiesel price subsidies will be phased out gradually between 2020 and 2022
(USDA-FAS, 2020c). With production up less than 2%, IRENA estimates biofuel jobs in
Thailand at 138 700 in 2020.
Because of COVID-19 measures, the Philippines’ ethanol production is estimated to
have declined by 20% and biodiesel by 30% (USDA-FAS, 2020d). Biofuels employment
is estimated by IRENA at 28 900 jobs. Direct jobs in biofuels processing were reported
at only 2 887. Processing plants suffered COVID-19–related shutdowns driven by mobility
restrictions and the resulting reduced demand for fuel. Construction of new plants
was also delayed by problems with procuring necessary equipment and manpower
(REMB DOE, 2021).
5 The estimate breaks down into 91 164 jobs in ethanol and 82 250 jobs in biodiesel.
6 The European Union explained that it acted in response to growing concerns over the environmental impact of palm oil and Indonesia’s biodiesel subsidies. In
December 2019, the Indonesian government filed a complaint against the tariffs with the World Trade Organization (Jong, 2020).
7 The 2020 edition of the Annual Review reported 2019 production of 8 billion litres, but estimates were subsequently revised downward to 7.7 billion litres
(USDA-FAS, 2020a).
8 Malaysia’s biodiesel production figures for several years were revised by USDA-FAS (2020b), causing deviations from the job estimates reported in previous
editions of the Annual Review.
24C H A PT E R 1
Wind
1.3
COVID-19 notwithstanding, by the end of 2020 the wind energy sector
saw a strong expansion. Capacity additions almost doubled to 111 GW, from
58 GW added in 2019. China added by far the most (72 GW), followed by the United States
million jobs
(14 GW). Ten other countries installed more than 1 GW each (IRENA, 2021a).
The COVID-19 pandemic caused numerous disruptions, including in the supply of raw
materials and other inputs. For example, balsa – a material used in blades – was in short
supply because of severe pandemic impacts in Ecuador. In response, some companies
invested in balsa production in countries like Papua New Guinea, while others switched
to PET plastics (Barla, 2020).
Overall employment in onshore and offshore wind grew slightly to 1.25 million jobs
worldwide in 2020, from 1.17 million in 2019.9 IRENA’s gender survey indicated that women
hold about a fifth of these jobs (IRENA, 2020b). Most wind employment is concentrated
in a relatively small number of countries. China alone accounts for 44% of the global
total. Asia represented 54% of global wind jobs in 2020, while Europe accounted for 27%
(of which EU members 21%), the Americas for 17%, and Africa and Oceania for less
than 3%. The top ten countries shown in Figure 7 together employ 1 million people. Five
countries are European, three are in the Americas and two are Asian.
Figure 7: Wind employment: Top 10 countries
Million jobs
0.60
0.50 44%
of wind
jobs
0.40 Top 10:
80%
of wind
jobs
0.30
0.20
0.10
0
s
ina
es
y
m
ia
il
ark
ain
o
nd
az
an
xic
Ind
do
tat
Sp
Ch
nm
Br
rla
rm
Me
ing
dS
the
De
Ge
dK
ite
Ne
Un
ite
Un
Source: IRENA jobs database.
9 The countries for which IRENA’s database has estimates of wind power employment represent 95% of global capacity and cover 95% of
new installations in 2020.
25RENEWA B LE EN ER GY AN D J O B S – A NNUA L RE VI E W 2 0 2 1
In addition to the geographical distribution of wind farms, the industry’s equipment
manufacturing footprint affects where jobs are created. Job creation depends to some
extent on countries’ ability to establish a strong local supply chain, including through
investment in manufacturing, grids, and, for offshore projects, port infrastructure and
specialised vessels. It also depends on countries’ varying abilities, and political will, to apply
performance requirements such as local content rules.
Of the almost 800 factories worldwide that produce wind-turbine components, 45% are
in China and 31% in Europe, 7% in India, 5% in Brazil and 4.5% in the United States, Canada
and Mexico (Wind Europe, 2020). Close to 40 countries manufacture components, but
only a few (China, Germany, India, Spain and the United States) produce the full range
(i.e. nacelles, blades, towers, generators, gearboxes and bearings) (BNEF, 2021b).
Europe’s wind-power employment depends more on export markets than is true in other
regions. In 2019, companies in Denmark, Germany and Spain accounted for three quarters
by value of all wind-turbine exports. By contrast, employment at Chinese wind companies
depends mainly on the strength of the domestic market, as is true for companies in the
United States (BNEF, 2021b).
For nacelle production, firms in China, Denmark, Germany, India and the United States
held a combined 98% of the world market in 2019. Blade and tower production is also highly
concentrated. Close to 40% of the plants manufacturing generators are in China, with a
similar share in Europe. Companies in Europe, Japan and the United States supply most
high-quality bearings for onshore and offshore wind turbines (BNEF, 2021b). Manufacturing
of gearboxes is more geographically dispersed owing to increasing outsourcing, including
to lower-wage countries such as India (Barla, 2020; Wind Europe, 2020).
26C H A PT E R 1
Upstream, among key materials used in wind turbines, steel production is dominated by
China, while concrete production is largely locally sourced. Glass-fibre-reinforced plastic
for blades is produced principally in China, Japan, the United States and Europe. Two-
thirds of the production of rare earths (used in the direct-drive generators that account
for 10% of the global onshore market but 70% of the offshore market) is in China (BNEF,
2021b); some African countries are also important sources of minerals and metals inputs.
Boom-bust cycles and policy changes have encouraged consolidation among equipment-
producing companies. In 2019, the top ten turbine manufacturers had an 84% global
market share, up from 74% five years earlier. Just 15 manufacturers supply half of global
demand for blades; the total number of blade producers has fallen by a third since 2016,
as smaller suppliers have been squeezed on cost, research and development spending
and lack of a global presence (GWEC, 2020b). The US wind-turbine market is highly
concentrated, with just three companies accounting for 98% of the 2020 total.10
With falling costs and ambitious deployment plans, the offshore wind market is coming
into its own. Offshore wind farms require more labour than onshore wind farms.
Construction and installation are more complex, involving not just the usual towers,
blades and turbines, but also complex foundations and installation vessels, as well as
substations and undersea cables to bring electricity onshore. Many of these functions
can leverage the capabilities found in the offshore oil and gas sector (GWEC, 2020a).
Europe is the leader in offshore installations and technology development, with a
robust supply chain in countries bordering the North Sea and Baltic Sea (GWEC,
2020a). Developing an adequate logistics infrastructure is also critical. This includes
improvements in port infrastructure to support warehousing, staging for assembly and
transport, and installation and operations vessels.
For both offshore and onshore wind, the Global Wind Energy Council (GWEC, 2021a)
projects that an additional 480 GW of capacity will be installed globally between 2021
and 2025. This will create some 3.3 million jobs along the entire value chain (including in
operations and maintenance over the course of typical 25-year project lifetimes).
The Global Wind Organisation and the Global Wind Energy Council (GWO and GWEC,
2021) estimate that the wind capacity that is expected to be added in 2021–25 will
require 480 000 trained workers in the construction, installation, and operations and
maintenance segments (308 000 onshore and 172 000 offshore). Training capacity –
150 000 workers at the end of 2021 – thus needs to be expanded significantly to ensure
safe and quality work.
10 GE Renewable Energy had a 53% share of 2020 installations, followed by
Vestas (35%) and Siemens Gamesa Renewable Energy (10%) (American
Clean Power, 2021).
27You can also read