RENEWABLE ENERGY AUCTIONS
←
→
Page content transcription
If your browser does not render page correctly, please read the page content below

RENEWABLE ENERGY AUCTIONS :
                 A Global Overview
                                        Wikus Kruger, Anton Eberhard & Kyle Swartz
                 Management Programme in Infrastructure Reform and Regulation (MIR)

          Report 1: Energy and Economic Growth Research Programme (W01 and W05)
                                                          PO Number: PO00022908

                                                                         May 2018
                                                                        Version 1.1

www.gsb.uct.ac.za/mir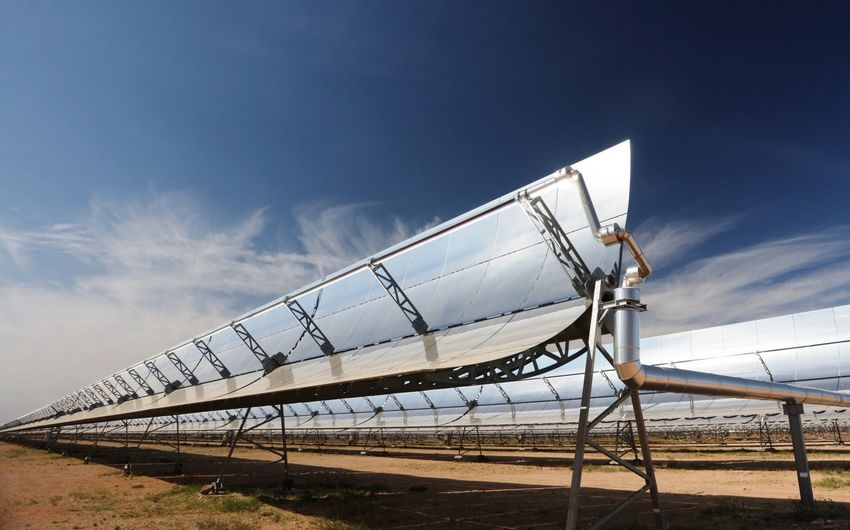
Renewable Energy Auctions:
A Global Overview
Report 1: Energy and Economic Growth Research Programme (W01 and W05)
PO Number: PO00022908

May 2018
Version 1.1

Wikus Kruger, Anton Eberhard & Kyle Swartz
Management Programme in Infrastructure Reform and Regulation (MIR)

Acknowledgements:
We would like to acknowledge the valuable contributions to this report provided by the following individuals:
Olankule Alao, Henrique Pereira, Andrea Isidori, Martin Pardina, Alejandro Jadresic, Frank Wouters, Hugo Lucas,
Vinay Rustagi, Pablo del Rio, Nadia Taobane, Pedro Sanchez, Jamal Alhammad, Surbhi Goyal, Mauricio
Tolmasquim.
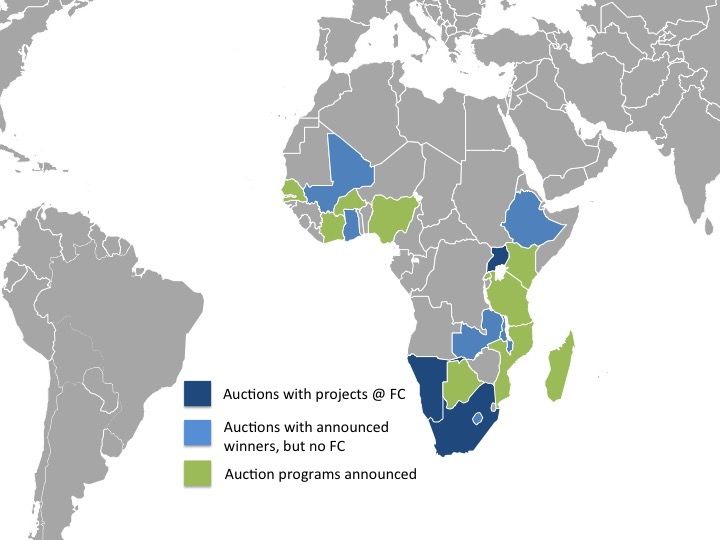
Table of Contents

INTRODUCTION..................................................................................................................................................................7
PRIVATE POWER INVESTMENT AND PROCUREMENT IN SUB-SAHARAN AFRICA .............................................................. 11

RENEWABLE ENERGY AUCTIONS: ANALYTICAL FRAMEWORK ...................................................................... 14
AUCTION DESIGN.................................................................................................................................................................. 14
RENEWABLE ENERGY AUCTION IMPLEMENTATION: KEY ELEMENTS ............................................................................... 16
RENEWABLE ENERGY AUCTIONS IN SUB-SAHARAN AFRICA ............................................................................................. 17

RENEWABLE ENERGY AUCTIONS: A GLOBAL TOUR............................................................................................ 21
REGIONS, COUNTRIES AND KEY DESIGN ELEMENTS ANALYSED.......................................................................................... 24
LATIN AMERICA ................................................................................................................................................................... 24
ARGENTINA .................................................................................................................................................................................................. 25
BRAZIL .......................................................................................................................................................................................................... 28
CHILE ............................................................................................................................................................................................................ 31
MEXICO ......................................................................................................................................................................................................... 33
PERU ............................................................................................................................................................................................................. 36
MIDDLE EAST AND NORTH AFRICA (MENA) .................................................................................................................... 39
MOROCCO ..................................................................................................................................................................................................... 39
SAUDI ARABIA ............................................................................................................................................................................................. 41
UNITED ARAB EMIRATES (UAE) ............................................................................................................................................................ 42
EUROPE ................................................................................................................................................................................ 45
GERMANY ..................................................................................................................................................................................................... 45
SPAIN ............................................................................................................................................................................................................ 48
DENMARK..................................................................................................................................................................................................... 50
ASIA ...................................................................................................................................................................................... 52
INDIA ............................................................................................................................................................................................................. 52
ANALYSIS: PRICE OUTCOMES .............................................................................................................................................. 55

CONCLUSION: GLOBAL RENEWABLE ENERGY TRENDS & BEST PRACTICE ................................................. 60
AUCTION DESIGN ................................................................................................................................................................. 60
AUCTION IMPLEMENTATION ............................................................................................................................................... 65
TRENDS, LESSONS & IMPLICATIONS FOR SUB-SAHARAN AFRICA .................................................................................... 68

REFERENCES..................................................................................................................................................................... 71

APPENDIX A: AUCTION DESIGN ANALYSIS FRAMEWORKS............................................................................... 81

APPENDIX B: INTEGRATED ANALYSIS FRAMEWORK......................................................................................... 85

APPENDIX C: INDEXATION AND INCENTIVE FACTORS FOR ARGENTINIAN PROJECTS ........................... 86
List of Figures
Figure 1: Installed Generation Capacity in sub-Saharan Africa, 1990-2015. Source: Authors'
    calculation, based on EIA data, 2017. .................................................................................................................. 7
Figure 2: Investments in sub-Saharan African power generation sector, 1994 - 2013 (Five year
    moving average). Source: Eberhard et al., 2016. ............................................................................................ 8
Figure 3: Cumulative private (IPP) MW installed per technology in sub-Saharan Africa, 1975 -
    2017. Source: Authors' calculations. .................................................................................................................... 9
Figure 4: Cumulative private (IPP) MW installed for Solar PV, Onshore Wind and Small Hydro,
    1994 - 2017 in sub-Saharan Africa. Source: Authors' calculations ........................................................ 9
Figure 5: Procurement method of IPPs in Sub-Saharan Africa. Source: Authors’ calculations......... 10
Figure 6: Countries in sub-Saharan Africa using renewable energy auctions. Source: Authors’ data.
     ........................................................................................................................................................................................... 17
Figure 7: Renewable energy capacity growth by type of policy defining remuneration levels.
    Source: IEA, 2018. ..................................................................................................................................................... 21
Figure 8: Announced minimum or average auction prices for utility-scale (> 10MW) solar PV
    projects, 2015 – 2018. Source: Authors’ calculations ............................................................................... 22
Figure 9: Announced minimum or average auction prices for utility-scale (> 10 MW) onshore
    wind, 2015 – 2018. Source: Authors’ calculations ...................................................................................... 23
Figure 10: Solar Irradiation Levels vs. Auction Prices for Case Study Countries. Source:
    GlobalSolarAtlas, 2018............................................................................................................................................ 58
Figure 11: Auction prices vs. Year of expected COD. ........................................................................................... 58
Figure 12: Relating RE auction design elements to outcomes (Source: del Rio, 2017b) ..................... 82
Figure 13: Integrated Analysis Framework............................................................................................................. 85
List of Tables
Table 1: Main features and outcomes of renewable energy auctions in Sub-Saharan Africa ............ 18
Table 2: Overview of the RenovAr renewable energy auction programme in Argentina ................... 25
Table 3: Overview of the renewable energy auction programme in Brazil ............................................... 29
Table 4: Overview of the renewable energy auction programme in Chile ................................................ 32
Table 5: Overview of renewable energy auction programme in Mexico .................................................... 34
Table 6: Overview of the renewable energy auction programme in Peru ................................................. 36
Table 7: Overview of renewable energy auction programme in Morocco ................................................. 39
Table 8: Overview of renewable energy auction programme in Saudi Arabia ........................................ 41
Table 9: Overview of renewable energy auction programme in the United Arab Emirates .............. 43
Table 10: Overview of the renewable energy auction programme in Germany ..................................... 45
Table 11: Overview of renewable energy auction programme in Spain .................................................... 48
Table 12: Overview of renewable energy auction programme in Denmark ............................................. 50
Table 13: Overview of the renewable energy auction programme in India.............................................. 53
Table 14: Summary of global solar PV auctions – ranked by USD price (low to high) ......................... 56
Table 15: Summary of Case Studies' Auction Demand Features .................................................................... 61
Table 16: Summary of Case Studies' Winner Selection Criteria ..................................................................... 63
Table 17: Summary of Case Studies' Sellers' and Buyers' Liabilities ........................................................... 64
Table 18: Summary of Case Studies' Bankability and Risk Mitigation Measures ................................... 65
Table 19: Summary of Case Studies' Auction Implementation Agencies ................................................... 66
Table 20: Summary of the impact of design elements on the auction success criteria. Source: del
    Rio, 2017 ....................................................................................................................................................................... 83
Table 21: Indexation factors for RE projects in Argentinian auction ........................................................... 86
Table 22: Annual incentive factors for RE projects in Argentinian auction .............................................. 87
Acronyms AFDB African Development Bank BRICS Brazil, Russia, India, China and South Africa CA Connection Agreement CCGT Close Cycle Gas Turbine CELs Clean Energy Certificate CSP Concentrated Solar Power DA Direct Agreement DN Direct Negotiation EU European Union FODER Fund for the Development of Renewable Energy GDP Gross Domestic Product GW Gigawatt IA Implementation Agreement ICB Internationally Competitive Bidding IRENA International Renewable Energy Agency kWh Kilowatt hour MENA Middle East and North Africa MW Megwatt MWh Megawatt (hours) OCGT Open Cycle Gas Turbine PPA Power Purchase Agreement PPP Public-Private Partnerships PV Photovoltaic RAB Regulated Asset-Based system RE Renewable Energy REFiT Renewable Energy Feed-In Tariff RRR Reasonable Rate of Return SSA Sub-Saharan Africa USDc United States Dollar Cent VAT Value Added Tax
Introduction
The Sub-Sahara African electricity sector stands out for all the wrong reasons. It is the world region with
the lowest per capita electricity consumption – 181 kWh per person each year, or 3% of the European
average. Half of the region’s installed generating capacity (45 GW) is found in one country – South Africa
– with the remaining 45 GW spread among the other 45+ countries in the region. To put this into
perspective: a single European country – Spain (110 GW) – has more installed power than Sub-Saharan
Africa. This lack of generation capacity constrains economic growth and social development in the region,
with 2 out of every 3 people lacking access to electricity (Findt, Scott & Lindfeld, 2014; IEA, 2014;
African Development Bank Group, 2017; The World Bank, 2017). While there has been some growth in
the installed capacity in the region, much of this has only taken place in the last 10 years (Figure 1) at a
rate far below what is required (Castellano et al., 2015).

       100
       90
       80
       70
       60
  GW

       50
       40
       30
       20
       10
        0
             1990
                    1991
                           1992
                                  1993
                                         1994
                                                1995
                                                       1996
                                                              1997
                                                                     1998
                                                                            1999
                                                                                   2000
                                                                                          2001
                                                                                                 2002
                                                                                                        2003
                                                                                                               2004
                                                                                                                      2005
                                                                                                                             2006
                                                                                                                                    2007
                                                                                                                                           2008
                                                                                                                                                  2009
                                                                                                                                                         2010
                                                                                                                                                                2011
                                                                                                                                                                       2012
                                                                                                                                                                              2013
                                                                                                                                                                                     2014
                                                                                                                                                                                            2015
                                                SSA                   SSA-RSA                       2 per. Mov. Avg. (SSA-RSA)

Figure 1: Installed Generation Capacity in sub-Saharan Africa, 1990-2015. Source: Authors' calculation, based
on EIA data, 2017.

Independent power projects (IPPs) – built, financed, owned and operated by the private sector – have
become one of the fastest growing sources of investment in the region’s power sector (along with Chinese
investments) (Figure 2). The majority of these IPPs have been directly negotiated and are thermal-based,
with over 65% of installed IPP capacity coming from gas turbines (OCGT and CCGT), diesel/HFO and
coal. Most IPP capacity is concentrated in about a handful of countries, with only a few having more than
500MW installed: Nigeria (1980 MW), Ghana (1643 MW), Kenya (1079 MW), Cote D’Ivoire (866 MW),
Uganda (577 MW), Senegal (549 MW) and Zambia (517 MW). In terms of the number of projects, the
picture looks more or less the same, with only a few countries hosting five projects or more: Uganda (27),
Kenya (17), Namibia (16), Senegal (9), Mauritius (9), Ghana (8), Cote D’Ivoire (6) and Nigeria (5).
Adding South Africa’s recent (2011 - 2018) IPP additions might distort this picture (92 projects
contributing 6300+ MW), but also emphasises the importance of this investment trend for the region’s
power sector.
$2 000.00
$1 800.00
$1 600.00
Investment in $ millions
$1 400.00
$1 200.00
$1 000.00
$800.00
$600.00
$400.00
$200.00
$-
94 95 96 97 98 99 00 01 02 03 04 05 06 07 08 09 10 11 12 13
19 19 19 19 19 19 20 20 20 20 20 20 20 20 20 20 20 20 20 20
Sum of IPP Investments Sum of China Flows (private & public)
Arab (private & public) ODA (OECD)
DFIs (Multilateral)
Figure 2: Investments in sub-Saharan African power generation sector, 1994 - 2013 (Five year moving
average). Source: Eberhard et al., 20161.
Recent data shows that a rapidly growing portion of these IPPs is renewable energy-based (Figure 3 and
Figure 4), many of which have been competitively procured (Figure 5) (Eberhard, Gratwick, Morella, et
al., 2017). Whilst several African countries have started down the path of setting up competitive
procurement programs for large-scale renewable energy projects, less than a handful have successfully
realised investments. Those that have succeeded – mainly South Africa and Uganda - are now reaping
considerable benefits, primarily in the form of clean, low-cost energy wholly financed, built and operated
by the private sector (Kruger & Eberhard, 2016). This coincides with a global surge of low-cost utility-
scale renewable energy projects, competitively procured through long-term contracts with the private
sector (IRENA, 2017a). These three trends – the surge in private power investment, the growth in
competitively priced renewable energy projects, and the use of competitive procurement (auctions) for
IPPs – represent important departures from the status quo in the Sub-Saharan region.
1 DFI = Development Finance Institutions; ODA = Official Development Aid.3000
Cumulative MW installed
2500
2000
1500
1000
500
0
75
94
96
97
98
99
01
02
03
04
05
06
07
08
09
10
11
12
13
14
15
16
17
19
19
19
19
19
19
20
20
20
20
20
20
20
20
20
20
20
20
20
20
20
20
20
Coal HFO
MSD/HFO CCGT
OCGT Solar, PV
Wind, Onshore Hydro, Small (90
80
70
Number of Projects
60
50
RSA
40
SSA
30
20
10
0
REFIT DN ICB
Figure 5: Procurement method of IPPs in Sub-Saharan Africa. Source: Authors’ calculations3.
Auctions, although quite recent, have already delivered more investment in RE at lower prices than any
other procurement or contracting method for the region. Previously, feed-in tariffs were the most
widespread RE support mechanism, but delivered little investment in Sub-Saharan Africa 4 (SSA).
Running effective auctions requires dynamic least-cost power sector planning5, considerable procurement
and contracting capacity, and can involve significant transaction costs. These costs are however easily
offset by the benefits of lower tariffs; recent research has shown that competitively procured power
projects in sub-Saharan Africa – whether thermal or renewable based – are contracted at much lower
prices than directly negotiated, or feed-in tariff-based projects (Eberhard et al, 2016). Auctions still risk
attracting too little bidding interest, leading to higher prices; as well as delays in reaching financial close
and construction, especially if there has been “low balling” in bid prices (del Río, 2017a; Lucas, Del Rio
& Sokona, 2017; Mora et al., 2017). While these are important risks to consider, experience has shown
that a well-designed and -implemented program can effectively mitigate these risks (Naude & Eberhard,
2016).
3 REFIT = Renewable Energy Feed-In Tariff; DN = Direct Negotiation; ICB = Internationally Competitive Bidding; SSA
= Sub-Saharan Africa; RSA = Republic of South Africa.
4 Namibia is a recent exception to this rule, having procured 14 IPPs (5 MW each) through its feed-in tariff program.
However, the Namibian regulator has indicated that the country will be moving towards auctions on the back of recent
results from its first solar PV auction, which delivered renewable capacity at a much cheaper price.
5 The planning needs to be dynamic in the sense that it requires regular (perhaps annual) updating to keep track of
developments in the sector. Planning needs to be least-cost in that it seeks to match future power demand requirements
using the least-expensive new power generation sources available (given policy limitations). Ideally this plan is legally
binding and all power sector investments are required to conform to this plan. The South African Integrated Resource
Planning approach is a useful example of such a planning approach.Private power investment and procurement in sub-Saharan Africa Studies on private power investment in Sub-Saharan Africa have mainly concentrated on the identification of success factors for IPP development and implementation. Research by Woodhouse, (2005) and Eberhard & Gratwick (2013a, 2011, 2013b) has identified more than 40 such success factors in an emergent, bottom-up manner through the use of comparative case studies. While these IPP success factors have been empirically-derived, they correspond with the risks, barriers and bankability requirements identified in the project finance, PPP and infrastructure finance literature (Babbar & Schuster, 1998; Pollio, 1998; Thobani, 1999; Grimsey & Lewis, 2002; Farrell, 2003; Jamali, 2004; Bonetti, Caselli & Gatti, 2010; Siemiatycki & Farooqi, 2012; Annamalai & Jain, 2013; Collier, 2014; Collier & Cust, 2015; Estache, Serebrisky & Wren-Lewis, 2015). These factors are grouped into five sub- categories at the country level (stable country context; clear policy framework; transparent, consistent and fair regulation; coherent power system planning; and competitive bidding practices); and seven sub- categories at the project level (favourable equity partners; favourable debt arrangements; creditworthy off-taker; secure and adequate revenue stream; credit enhancement and other risk management and mitigation measures; positive technical performance; and strategic management and relationship building). Further recent analyses of IPP investments in Africa by Eberhard et al., (2017a, 2017b, 2016) has in particular emphasized the importance of two country-level factors as critical for accelerating investment: least-cost power planning, linked to the timely initiation of competitive procurement for power generation. This emphasis is supported by theoretical assertions and empirical evidence from literature on procurement theory and infrastructure investment (Estache & Iimi, 2008; Bajari, McMillan & Tadelis, 2009; Chong, Staropoli & Yvrande-billon, 2014; Estache, 2016) and points to the need to further develop procurement design and implementation as part of the literature on IPP investment in sub-Saharan Africa. This contribution should be focused at the “programme” level, complementing the “country” and “project” levels of analyses thus far employed. A body of literature that is both useful and timely for informing IPP success factor analysis at the programme level is the growing field of renewable energy auction design. Auctions have been used to sell a variety of goods and services for centuries. One of the earliest written accounts of an auction mechanism being used was when the Praetorian Guard sold the Roman Empire in A.D. 193. Auctions have also made an important contribution in theoretical terms – informing our understanding of pricing theory, competitive markets and game theory. As a public sector procurement mechanism, (reverse) auctions are particularly popular (Klemperer, 2004). Electricity auctions – technology neutral and technology specific (e.g. renewable energy) – have now become standard practice for procuring new power for many countries across the world – including several African countries. In the electricity sector, (reverse) auctions have been used to procure power for more than two decades. The first auctions took place in Brazil, Canada, Chile, China, Ireland, Portugal and the UK (Lucas, Ferroukhi & Hawila, 2013). The second wave of power sector reforms (2004) were introduced (mostly in Latin America) in a context where many low- to middle-income countries were struggling to increase new electricity supply – and needed a new way of attracting generation capacity. Investors were more interested in bidding for long-term contracts than constructing merchant plants that had to compete to sell power. Auctioning off these long-term agreements to the lowest bidder proved to
be effective at increasing power generation capacity at low cost (Hochberg, 2018). In the renewable
energy field, auctions are fast becoming the dominant policy mechanism for procuring new capacity
(REN21, 2016; IRENA, 2017b).

Renewable energy auction design is an area of growing scholarly interest. Historically, the majority of
publications on renewable energy auctions tried to answer whether auctions or feed-in tariffs are the more
appropriate support policy for renewable energy technologies (Del Río & Mir-Artigues, 2014; Toke,
2015; Ngadiron & Radzi, 2016a; Aquila et al., 2017), and as such was primarily coming from the global
North. While evidence of the global rise and drastic impacts of RE auctions (IRENA, 2017b; REN 21,
2017) seem to have accelerated scholarly interest in this question, we have seen a concurrent increase in
publications looking specifically at RE auctions design elements, an area that until recently was the
primary domain of so-called “grey literature” (GIZ & Ecofys, 2013; Azuela & Barroso, 2014; IRENA &
CEM, 2015; Meyer, Tenenbaum & Hosier, 2015; Tietjen, Blanco & Pfefferle, 2015; IRENA, 2017b;
Tongsopit et al., 2017).

Recent scholarly publications on RE auction design have mainly focused on developing a more
theoretically-informed understanding of how specific auction design elements (e.g. auction volume,
auction frequency, auction type and price rule, ceiling price, pre-qualification requirements, penalties)
affect price and investment outcomes (Shrimali, Konda & Farooquee, 2016; del Río, 2017a; Gephart,
Klessmann & Wigand, 2017; Kreiss, Ehrhart & Haufe, 2017; Dobrotkova, Surana & Audinet, 2018).
These articles have therefore been principally drawing from economic theories in their analyses and
conclusions. Where authors have made use of empirical evidence, this has mostly been based on high-
level, large-N comparative case studies (e.g. del Río, 2017).

Country-specific RE auction case studies and recommendation documents have been making important
contributions to auction design literature, including on Brazil (Rego & Parente, 2013; Hochberg, 2018)
South Africa (Eberhard, Kolker & Leigland, 2014; Montmasson-Clair & Ryan, 2014; WWF international,
2014) and India (Shrimali, Konda & Farooquee, 2016). While these BRICS member states were
considered trailblazing renewable energy market pioneers two or three years ago, the most exciting
frontier markets have since moved on to places like Zambia, Senegal, Dubai and Mexico. There is thus a
natural lag built into the literature as best practice seems to constantly move into deeper frontier territory.
The implication is that our ability to explain auction outcomes in these new best practice cases is limited
to what has gone before. We therefore need to draw on the RE auction design literature, but also allow
these new cases to contribute important new information on what makes for an effective RE auction
program.

The expansion of RE auction literature furthermore needs to not only consider design elements, but also
auction implementation success factors. This includes considerations such as the institutional setting and
capacity of the procurer; the political support for and coordination of the program; and the implementation
process (consultation & responsiveness; transparency of evaluation etc.). These implementation factors
have been identified in some of the empirical literature on RE auctions in the sub-Saharan region
(Fergusson, Croft & Charafi, 2015; Meyer, Tenenbaum & Hosier, 2015; Eberhard & Kåberger, 2016;
Kruger & Eberhard, 2016; Lucas, Del Rio & Sokona, 2017). Many of these elements have also been
identified as contributing to the success of Public-Private Partnerships (PPPs) and general infrastructure
investment and procurement processes in developing countries, yet has largely failed to show up in RE
auction design literature (Estache & Iimi, 2012; Nel, 2013, 2014; Collier & Cust, 2015; Liu, Wang &
Wilkinson, 2016; Hilmarsson, 2017). There is thus a need to identify and develop a more complete and
sophisticated understanding of these auction implementation elements, based primarily on empirical
evidence from RE auctions in the sub-Saharan region.

This report provides a global overview of renewable energy auction design and implementation trends,
with the aim of informing the design of the analytical framework and the consequent analysis African
case studies. It also offers an important introduction to the world of renewable energy auctions.
Renewable Energy Auctions: Analytical Framework
Different frameworks have been proposed to analyse the design, implementation and success of
renewable energy auctions (Appendix A: Auction Design Analysis Frameworks). While there is no
prioritised measure of auction success in the literature (Hochberg, 2018), most analyses are primarily
interested in the resulting auction prices and project realisation rates6 (IRENA & CEM, 2015; Tongsopit
et al., 2017; Winkler, Magosch & Ragwitz, 2018). Other proposed measures of success include the
diversity of bidders/winners, technologies and locations; the impact on the local value chain; and social
acceptance/impact (GIZ, 2015; Lucas, Del Rio & Sokona, 2017; Mora et al., 2017; Hochberg, 2018). For
the purposes of this report, we will focus primarily on price and, where available, project realisation
outcomes. The in-depth country case studies (future reports) will in addition focus more explicitly on the
additional measures of success identified in the literature (Appendix B: Integrated Analysis
Framework).

Auction design
Renewable energy auctions have been analysed by a wide variety of researchers and organisations
(Azuela, Barroso & Cunha, 2014; Del Rio & Linares, 2014; Kylili & Fokaides, 2015; GIZ, 2015; IRENA
& CEM, 2015; Ngadiron & Radzi, 2016b; Shrimali, Konda & Farooquee, 2016; Eberhard & Kåberger,
2016; Cassetta et al., 2017; Lucas, Del Rio & Sokona, 2017; Mora et al., 2017; Tongsopit et al., 2017;
del Río, 2017a; Kreiss, Ehrhart & Haufe, 2017; Winkler, Magosch & Ragwitz, 2018; Hochberg, 2018;
Kruger & Eberhard, 2018). While there are differences between the analytical frameworks used, these
differences mainly relate to how different elements are classified and/or the a priori prioritisation of
certain elements (see Appendix A: Auction Design Analysis Frameworks). We have distilled these
frameworks based on analyses of the literature and empirical evidence from the region, resulting in the
following auction design analytical framework:

One of the first auction design decisions is on project site selection: whether the project site is to be
chosen by the government (often through the procuring agency), or by the project developers. For
renewable energy plants, the proposed project site is of fundamental importance given the geographic
specificity of most renewable energy resources. Government-led project site selection is usually the result
of concerns regarding grid stability and transmission costs in weak and/or small grids, as well as uncertain
or risky land tenure arrangements. Governments might also want to pre-select a project site with the
intention of lowering risks (and thereby the tariff) for the project, as well as shortening the project
realisation period (Fergusson, Croft & Charafi, 2015; del Río, 2017a; Lucas, Del Rio & Sokona, 2017).
Government site selection most often also overlaps with some site preparation by the procurer, including
the provision of transmission infrastructure and key permits (incl. environmental impact assessment).
While in theory a government-led site selection approach might lead to reduced risk profile for projects,
research has shown that a poorly executed site selection and preparation strategy increases developer
risks, resulting in poor project realisation (Kruger, Strizke & Trotter, n.d.).

Auction demand is mainly concerned with how much is being procured (volume), and how that is
divided between technologies, bidders, regions, projects and time periods. Auction volume is a key

6 Realization rate refers to the degree to which procured projects are built on time. A simple metric for determining
the realization rate is: Volume procured/Volume commissioned.
determinant of the level of competition (and therefore pricing) in an auction, and should be clearly
informed by an integrated planning framework. The auction volume can also be bid out in a technology
neutral manner (where all technologies compete against each other – incl. fossil fuels; or where only
renewable energy technologies compete against each other), or through using technology specific demand
bands. The latter option is often preferred where there are concerns regarding supply security in the power
system and therefore a need for a diversification of sources. Auction demand can also be set in terms of
capacity (MW) or energy (MWh). Project size limits also ensure increased competition, but might still
result in higher prices due to reduced economies of scale. The auction volume can also be divided across
regions – perhaps based on grid capacity studies or other policy objectives. Different types of bidders
(e.g. small, local vs. large, international) might also be provided with specific demand bands to achieve
certain policy goals. Finally, auction demand can be spread over several rounds of auctions; evidence
from various analyses clearly shows the positive impacts, especially in terms of price and localisation,
resulting from regular, scheduled auction rounds (Eberhard & Naude, 2016a; International Renewable
Energy Agency, 2017; Lucas, Del Rio & Sokona, 2017; Kruger & Eberhard, 2018).

Qualification and compliance requirements are meant to increase project realisation rates and ensure
that other policy objectives are achieved. This can be structured as a one-stage or a two-stage (pre-
qualification round) process: a two-stage process reduces the administrative burden and transaction costs
for bidders and policy-makers, but might also result in longer procurement timelines. Reputation
requirements are usually concerned with establishing the financial health and technical expertise of the
bidding entity; setting these requirements too high might result in lower competition, while setting these
too low might result in low project realisation rates. Qualification requirements are further interested in
ensuring that the projects being procured conform to international technology standards; that the site is
secured, permitted and that grid access is ensured (where this is not being provided by the
government/procurer); that the project conforms to local and/or international environmental and social
performance standards; and that the project meets any local economic development requirements (e.g.
local content; shareholding thresholds; job creation etc.)

The winner selection process is primarily concerned with establishing the process of and criteria for
selecting auction winners. It therefore concerns the bidding procedure: whether the auction is based on a
sealed bid process (the most popular and simpler choice) (del Río, 2016), a dynamic process (e.g. a
descending clock auction7), or a combination of the two. Auctioneers also need to decide whether (and at
what level) to set ceiling prices for the auction (and whether to disclose these); whether winners will be
selected based only on price, or other criteria as well (e.g. economic development commitments, location);
and whether winners will be paid at the price that they bid, or at a uniform or clearing price8.

Seller and buyer liabilities cover a range of issues that aim to reduce the risks for bidders and the
auctioneer. These include the use of bid bonds (to ensure that bidders are committed to signing the
contracts); a clear and realistic auction and contract schedule (incl. lead times between contract award

7 In a descending clock auction, the auctioneer starts by setting a ceiling price, and asking bidders how much volume
they are willing to sell at this price. The price is then lowered until the quantity offered is equal to the quantity to be
procured (Maurer & Barroso, 2011).
8 While in practice most renewable energy auctions are pay-as-bid, the uniform pricing option is theoretically better
suited to the auction since bidders are incentivized to reveal their true costs (Hochberg, 2018).
and project commissioning); the remuneration profile of the contracts (e.g. whether prices are fixed,
indexed to inflation or another metric, or varying with market prices); how projects are penalised for
underperformance and delays (incl. the use of completion bonds); and how liabilities for transmission
delays are to be distributed (incl. deemed energy payments).

Bankability and risk mitigation refers to elements that enhance the profile of the program from the
perspective of potential lenders into the renewable energy projects. A key element is the provision of high
quality, standardised, non-negotiable contracts that have been tested with lenders for bankability. These
contracts include the Power Purchase Agreement (PPA), Implementation Agreement (IA), Direct
Agreements (DA) and Connection Agreements (CA). Auctions in challenging jurisdictions or where off-
takers face financial difficulties often also come with credit enhancement and loan/payment security
measures, such as sovereign guarantees, letters of credit, and guarantee mechanisms offered by
international financial institutions (e.g. MIGA and PRG cover from the World Bank). A key requirement
in attracting international financing to auctions (especially where local capital markets are limited in size
or unfamiliar with the technology) is to offer payment contracts in hard currency (e.g. US dollar). While
hard currency payments open up programs to international lenders, it also exposes off-takers (and, in turn,
governments) to substantial fiscal risks due to currency depreciation (Duve & Witte, 2016).

Renewable Energy Auction Implementation: Key elements
The ability of a well-designed auction to deliver successful outcomes depends on how well it is
implemented. Renewable energy auction implementation is an area that has received less attention as
compared with auction design, yet appears to be of at least equal importance in determining renewable
energy auction outcomes (Eberhard & Naude, 2016a; del Río, 2017a; Lucas, Del Rio & Sokona, 2017;
Tongsopit et al., 2017; Kruger & Eberhard, 2018).

Successful auction implementation is firstly a function of the overall enabling environment, manifest
primarily through high-level political support not only for the program, but also for a capable, mandated,
authorised auctioneer that is able to coordinate across government departments. An enabling environment
is furthermore created through the establishment of clear, supportive policy and planning framework. It
is moreover important that the procurement programme is well-resourced: designing and implementing a
renewable energy auction is a complex and resource-intensive process requiring extensive financial, legal
and technical expertise. The costs involved in setting up and running the program is however offset by
the low prices achieved. A further requirement concerns the need for grid planning coordination, with the
grid operator’s continuous inputs being essential to ensuring that the overall system costs of the auction
are minimal.

The implementation process primarily concerns a commitment to fairness, transparency and trust. This
is achieved through the establishment of the aforementioned respected auctioneer; through continuous
open dialogue with bidders; and through ensuring that the bidding process (incl. evaluation) is done in a
secure and transparent manner.
Renewable Energy Auctions in sub-Saharan Africa
In sub-Saharan Africa, at least 18 countries are currently in the process of developing and implementing
a renewable energy auction programme; more than half of these programmes were launched in 2017
alone.

Figure 6: Countries in sub-Saharan Africa using renewable energy auctions. Source: Authors’ data9.

Many African countries have struggled to successfully address the risks and costs involved in renewable
energy auctions, resulting in potentially poor outcomes. Additionally, many countries are desperate for
affordable power generation investment, yet cannot afford the “school fees” involved in a poorly designed
and implemented auction programme. There is thus an important need to learn from and distil current
experiences with renewable energy auction programmes in and for the African context.

9   Note: FC = Financial Close.
Table 1: Main features and outcomes of renewable energy auctions in Sub-Saharan Africa

                     South          Uganda*        Zambia*       Ghana         Namibia*         Malawi          Ethiopia       Senegal
                     Africa*
    Year             2011 - 2018    2014           2016          2016          2017             2017            2017           2018
    Auction          6,300 MW       4 x 5 MW       2 x 50MW      1 x 20MW      1 x 37 MW        Max        80   1 x 100 MW     2 x 30 MW
    Demand           (4 rounds)     Solar PV       Solar PV      Solar PV      Solar PV         MW Solar        Solar PV       Solar PV
                     Multiple RE                                                                PV        (4x
                                                                                                sites)
    Site Selection   Developer      Developer      Selected by   Developer     Selected by      Substations     Selected by    Selected by
                                    (3km - grid)   govt.         (input from   govt./ utility   identified      govt.          govt.
                                                                 offtaker)                      by govt.
    Local Content    40% min        None           None          20%           None (but        5% develop      15%            None
                                                                               30% local        ment       &
                                                                               share-           construction
                                                                               holding)         20% O&M
    Evaluation       70:30 Price:   70:30 Price:   Price         Not clear     70:       30     Price           70:30 Price:   Price
                     Economic       Technical                                  Price:                           Technical
                     Develop-                                                  Technical
                     ment
    PPA              20 Years       20 Years       25 Years      20 Years      20 Years         25 Years        20 Years       20 Years
    Guarantees       Sovereign      Sovereign      Sovereign     Sovereign     None             Sovereign       Sovereign      Sovereign
                                    & Liquidity    & Liquidity   & Liquidity                    & Liquidity                    & Liquidity
    Winning Price    4,7*           16,37          6,02          11,47         6,02             7,35 – 10,35    Below          4,7
    (USDc/ kWh)                                                                                 (TBC)           US$c6
                                                                                                                (TBC)
    Currency         ZAR            US$/EUR        US$           US$           NA$              US$             US$            US$
    Financial        Yes            Yes            Yes/No        No            Yes              No              No             No
    Close

Table 1 provides an overview of some of the main features and outcomes in renewable energy auctions
in sub-Saharan Africa. A few important points are worth highlighting:

-      The majority of auctions focus on a single technology: solar PV. According to Lucas, Del Rio &
       Sokona, (2017), this is mainly due to the fact that the technology is modular (meaning that relatively
       small plants are still feasible), relatively simple and quick to build, and – recently – relatively cheap.
       These features make solar PV an ideal option for many African jurisdictions, especially when
       considering the excellent solar resources in most African countries. However, solar PV also faces
       challenges when it comes to the integration of this variable resource in small, weak grids – as is the
       case in many African countries (Lucas, Del Rio & Sokona, 2017; Trotter, McManus & Maconachie,
       2017).

-      Apart from South Africa, auction demand is relatively small, usually concentrated in one or two
       projects that are bid out. This is in contrast with international trends, where larger volumes, often
       spread across multiple projects, is the norm (del Río, 2017a). Considering the small sizes of most
       African power systems, this is not a surprising outcome.

-      Linked to the point above is the issue of site selection: with the exception of South Africa, project
       sites are in the main selected and prepared by the government or its off-taker. Given the
abovementioned small and weak grids, as well as the uncertainties around land tenure and permitting
in many African jurisdictions, this is a practical design choice meant to lower risks (and therefore
costs) as well as speed up implementation (although whether this is the outcome in practice needs to
be further investigated) (Lucas, Del Rio & Sokona, 2017).
- Apart from South Africa, local content requirements are minimal. This might reflect the prioritisation
of cost-effective pricing as the main objective of most auction programs in the region, as well as the
realisation that local supply chains are as yet unable to provide many of the services and products
needed to support stringent local content requirements.
- Similarly, price is the main evaluation criterion used in the winner selection process for most auctions
(again, with the exception of South Africa and also Uganda) – again reflecting the prioritisation of a
low tariff.
- A key feature of most African auctions – which is somewhat of an exception when looking at global
practice – is the presence of credit enhancement and de-risking mechanisms such as loan and payment
guarantees, escrow accounts and put-call options. These mechanisms are often provided by or in
partnership with multilateral development organisations and are crucial in ensuring the bankability of
these auctions – oftentimes due to the poor financial health of off-takers and the low credit ratings of
sovereigns. This is also one of the design features of auctions that is most valued by the private sector
in the region (Lucas, Del Rio & Sokona, 2017). An important exception to this rule is Namibia, which
has offered no sovereign guarantee.
- Namibia and South Africa are also the two countries that are remunerating their projects in local
currency. All other auctions offer remuneration in hard currency – usually US dollar. This is a further
requirement for improving the bankability of the long-term contracts in countries that often face rapid
currency depreciation, and which do not have local capital markets deep and/or experienced enough
to finance these projects (Eberhard & Naude, 2016b). Host countries of these projects are in turn
exposed to significant foreign currency risk, which has been identified by some as one of the key
long-term risks facing renewable energy projects in developing countries (Duve & Witte, 2016).
- Prices across the region vary considerably – from more than USDc 16/kWh in Uganda to less than
USDc 5/kWh in South Africa and Senegal. Some of these outcomes can be explained by the sizes of
the projects, the timing of the auction (and, critically, the commissioning date of the projects), the
amount of de-risking in the program, and the presence of concessional finance (Meyer, Tenenbaum
& Hosier, 2015; Kruger & Eberhard, 2016; Lucas, Del Rio & Sokona, 2017; Dobrotkova, Surana &
Audinet, 2018). Still, this is a key measure of an auction’s effectiveness and further case-specific
analysis is needed to improve our understanding of drivers of these prices and how they interact with
auction design and implementation elements.
- A further measure of auction success is the realisation rate of projects: whether projects get built, and
do so on time. Due to the relatively recent nature of many of the auctions in the region, there is
unfortunately not that much data available as yet on this outcome since many of the projects procured
have not yet reached their expected commissioning dates. A useful proxy is however the date that aproject reaches financial close, since this usually marks the point at which construction starts and where most risks have been sufficiently addressed from the financiers’ perspective. While it is again quite early for some of the projects in this regard, it is noteworthy that only South Africa, Uganda, (one project in) Zambia and Namibia have reached financial close. While there have been delays in some jurisdictions, it needs to be pointed out that on average IPPs take around seven years to reach financial close in sub-Saharan Africa. The timelines represented by these auctioned renewable energy projects are much shorter – even when delays occur.
Renewable Energy Auctions: A Global Tour
Auctions are now officially the preferred procurement method for contracting renewable energy capacity
globally, and set to grow in prominence (Figure 7). Despite the costs and risks involved, more than 67
countries worldwide have embarked on, or are busy developing, renewable energy auctions – up from 5
countries in 2005. At the same time, we are also seeing the rapid development of sub-national auction
programs at state/provincial and municipal/local government level (REN 21, 2017). The volume of
auctioned renewable energy capacity, completed and announced in 2017, reached a record 50,6 GW
globally – up from 33,6 GW in 2016. This brings the cumulative capacity of renewable energy auctioned
since 2003 to 137,3 GW10. The majority of renewables-based investment (incl. through auctions) has
been taking place in the developing world, marking a significant shift in the global renewable energy
market (McCrone et al., 2018).

Figure 7: Renewable energy capacity growth by type of policy defining remuneration levels. Source: IEA, 2018.

Auctions have introduced a significant shift in global electricity markets. The rising prominence of
auctions is primarily due to the introduction of competition in the procurement process, causing
significant downward pressure on renewable energy project prices (Solar PV - Figure 8; Onshore Wind
- Figure 9). The lowest renewable energy prices globally are currently being announced in auctions in
developing countries (Dobrotkova, Surana & Audinet, 2018). The result is that the least-cost new build
electricity generation capacity options in many developing countries are now renewable energy based
(CSIR, 2016; Dezem, 2016; McCrone et al., 2017).

10 This excludes 60.8 GW of renewable electricity auctioned in Chile between 2006 and 2017, because it was not
allocated on a GW basis.
Traiffs (US$c/kWh) 10.0
14.0
0.0
2.0
4.0
6.0
8.0
calculations
Canada Ontario LRP I Programme 140 MW March 2016
12.0 11.6
Ghana 20 MW Auction Sept 2016
Ghana 50 MW Auction 2016
9.6
Germany PV Auction II 150 MW Aug 2015
Brazil A3 auction 834 MW Aug 2015
Malaysia LSSPV Projects Auction 451 MW Jan 2017
Mauritius Solar PV Farms Auction 10-15 MW (179) Dec…
Germany PV Auction III 204 MW Dec 2015
8.9
Brazil A4 auction 929 MW Nov 2015
India - Uttarakhand Auction 171 MW Oct 2015
Jamaica 33 MW RE sources May 2016
Israel Timna Solar Farm 60 MW Jul 2016
India - Telangana Auction 2 GW Aug 2015
Germany PV Auction V 130 MW Aug 2016
India - Haryana Auction 150 MW Dec 2015
7.9
China - Inner Mongolia 1 GW Sept 2016
France Solar PV Auction (CRE III) Dec 2015
Germany PV Auction IV 128 MW Apr 2016
India - Jharkhand Auction 1.2 GW March 2016
India - Karnataka Pavagada Solar Park (DCR) 100 MW…
7.2
Germany Solar PV Auction 200 MW Feb 2017
India - Telangana Auction 350 MW May 2016
India - Karnataka Auction 1.2 GW March 2016
Germany PV Auction VI 163 MW Dec 2016
India - Odisha Auction (Phase-II Batch IV) 450 MW Aug…
India - Andhra Pradesh Auction 400 MW May 2016
India - Karnataka Auction 920 MW June 2016
India - Maharashtra Auction 500 MW Jan 2016
6.5
Chile Energy Auction Oct 2015
India - Rajasthan Auction 130 MW Jul 2016
India - Rajasthan Auction 420 MW Jan 2016
Namibia Mariental Solar PV 37 MW Feb 2017
6.2
Jordan Solar PV Tender II 200 MW May 2015
South Africa REIPPP BW4 813 MW Apr 2015
Zambia Round 1 - IFC Scaling Solar 73 MW Jun 2016
Jordan 61 MW Solar PV Project (Risha Province) Jan 2017
Argentina RenovAR Round 1a 400 MW Oct 2016
Spain/Portugal Endesa Solar Iberian Auction II Sept 2015
Germany Cross-border RE auction with Denmark 5x10…
Spain/Portugal Endesa Solar Iberian Auction III March 2016
5.4
Saudi Arabia 50 MW Solar PV Aug 2015
El Salvador RE Auction II 120 MW Jan 2017
Argentina RenovAR Round 1b 516 MW Nov 2016
Peru First RE Auction 144 MW Feb 2016
Senegal PV auction 60 MW Mar 2018
4.7
Denmark Cross-border RE auction with Germany 20 MW…
Morocco Noor 1 PV 170 MW Nov 2016
India - Madhya Pradesh 750 MW Rewa Tender Feb 2017
Spain/Portugal Endesa Solar Iberian Auction III March 2016
4.4
South Africa REIPPP BW 4.5 (expedited) 2016*
Armenia Solar PV - 55MW Apr 2018
USA - Nevada First Solar's 100 MW Playa Solar 2 Jul 2015
USA - Texas 118 MW East Pecos Solar & co Oct 2015
USA - California (Palo Alto) 26 MW Wilsona Solar Feb…
3.7
Mexico Auction I 1.1 GW March 2016
Mexico Auction II 1.8 GW Sept 2016
3.3
UAE - Dubai 800 MW phase III of M. bin R. Al Maktoum…
3.0
Chile Energy Auction Aug 2016
Figure 8: Announced minimum or average auction prices for utility-scale (> 10MW) solar PV projects, 2015 – 2018. Source: Authors’
UAE - Abu Dhabi 350 MW Sweihan Solar PV Sept 2016
Note: * Provisional results (South Africa)
Mexico Auction III - Solar PV - Dec 2017
2.1Ja
Au m
st ai
ra ca
lia RE Tariff (US$c/kWh)
AC Jo Au
T rd c
calculations
Au El Re an tion
st S al er v 31 6
ra va se 5 M 0 M
lia
A d A W W
or u
10.0
12.0
14.0
Au CT
0.0
2.0
4.0
6.0
8.0
RE ctio Au Sep
st Wi A n 2 cti t 2
ra n
lia d A Ch ucti 00 on J 014
12.9
AC uc ile on MW ul
Au T tio En II 5 2
st
ra W n er 0 Au 015
i 1
11.3
Au lia nd - gy M g 2
st AC Au Ho Au W J 01
ra T
9.9
ct rns cti an 6
lia W io d on 20
AC Ca in
n d Ch n 1 ale D 17
9.9
Ca T W ad Au ile - A 10 ec 2
na in a H ct En rar 0 M 01
da d A yd ion er at W 4
9.0
Au
st On uc ro 1 gy 81 20
ra ta t i - -
Qu Co u MW 14 A
lia e o ct
8.3
rio on
AC LR 2 - S bec noo ion 201
T P A e O
W
7.8
I P app uc r 1 ct 2 4
in
d r o h i t io 9 0
Au Br gra re 1 n 4 MW 15
7.8
ct az m 00 46 20
io i m
n l A4 e MW MW 14
2 3
7.4
- H au 00 M 2
or ctio MW arc 014
n n h
6.9
Br
a sda 54 M 20
Br zil W le 1 8 M arch 16
6.7
Ar az 0
g il ind 0 M W N 201
Eg e n A3 A W ov 6
6.4
yp tin A u
t 2 a R Br uc ctio Ma 201
t n r
6.2
Ar 50 eno azil ion 76 ch 5
ge MW vA 90 53 9 20
nt R 6 M 1
5.8
in Gu Ro MW M W 6
So a R lf o un W 2
ut en f S d
Au A 01
h o u
5.7
Af v e
1a ctio ug 4
2
ric AR z W 708 n A 015
a Ro in M pr
5.5
So RE u d W 2
ut Me IP nd 1 Pro O 015
h P c
5.4
Af xico P B b 7 ject t 2
ric Au W 6 M 0
a 4 5 M ay 16
4.9
RE cti 1, W 2
IP on 363 N 01
PP I 6 M ov 6
4.7
BW 20 W 20
Ch M A 1
4.6
M ile 4.5 W pr 6
M 2
or E ( 0
oc Mex Per ner exp arc 15
g e h
4.4
co ic u
Pr o A Fir y Au dite 201
oj u s d
4.4
et cti t RE ctio ) 2 6
Eo on Au n 0
lie II c Au 16*
n 1 t g
4.3
In ,03 ion 20
M tég 8 M Feb 16
3.8
ex ré
ic W 2
o 850 Se 016
Au p
3.8
ct MW t 20
io J
n 16
3.6
III an 2
- D 01
ec 6
3.1
20
Figure 9: Announced minimum or average auction prices for utility-scale (> 10 MW) onshore wind, 2015 – 2018. Source: Authors’
17
1.8Regions, countries and key design elements analysed The main purpose of this global overview is to provide a broader comparative context for the more in- depth analyses of the selected African cases to follow. As such, the global analysis provides a high-level overview of each case study country, focusing on specific auction design, implementation and outcome elements. Our analysis concentrates on selected prominent and noteworthy countries. Cases have been selected based on their prominence in the literature, noteworthy auction results and design choices, as well as accessibility of data. Our country case studies focus on a handful of prominent renewable energy auction design, implementation and outcome elements. We first seek to establish a country’s familiarity with auctions as a procurement mechanism in the (renewable) energy sector. As such, we are interested in establishing the date of the country’s first auction, as well as the number of auction rounds that have taken place already. We also analyse the overall volume of renewable energy auctioned; the types of renewable energy technologies supported; the length and currency of the PPA; as well as specific auction design choices such as the pricing regime, bidding system and qualification requirements. These metrics provide a cursory overview of the auction-based market size and development, as well as some of the key project finance inputs that influence outcomes such as price. For auction implementation, we specifically focus on identifying the key institutions that play a role in the auction programme, including policy-makers, the sector regulator, procurer and off-taker. Auction outcomes are primarily measured in terms of MW procured, how this is divided between technologies, and the resulting prices. Latin America The Latin American region is home to considerable experience with and innovation in renewable energy auction design and implementation, and as such it features prominently in our analysis. Since the 1990’s, the Latin American region has experienced widespread liberalisation of the energy sector to allow private sector participation in the generation and distribution of electricity. The adoption of utility-scale renewable energy technologies has largely been driven by government-led renewable energy auction programmes aimed at procuring new generation capacity through private sector investments. Argentina, Belize, Brazil, Chile, Costa Rica, El Salvador, Guatemala, Honduras, Mexico, Panama, Peru and Uruguay are all currently using auctions to procure renewable energy. The result is that Latin American countries have high shares of electricity generation from renewable energy sources, with rapid growth in installed capacity from especially onshore wind and solar PV technologies (Bradshaw, 2016; IRENA, 2016; REN21, 2017; Hochberg, 2018). Despite this long history with electricity auctions, there is considerable variation across countries in terms of their auction designs and outcomes. In the region, Brazil has the longest history of using electricity auctions. The frequency of auctions in Brazil is one of the highest across the developing world, with frequent and specific auctions held to meet demand growth and ensure security of supply. Most other countries in the region have only recently adopted auction schemes. Brazil and Chile have allocated a large portion of auction capacity towards small- and large-scale hydropower for both existing and new generators. In addition, the region allocates and procures relatively large volumes of biomass energy in
You can also read