Report 2 - GREEN ECONOMY - IOPSA
←
→
Page content transcription
If your browser does not render page correctly, please read the page content below
SKILLS DEVELOPMENT FOR
                                             GREEN ECONOMY
DATA ANALYSIS

                Report   2
                             Industry analysis
                             of the plumbing industry
                             November 2018 – July 2019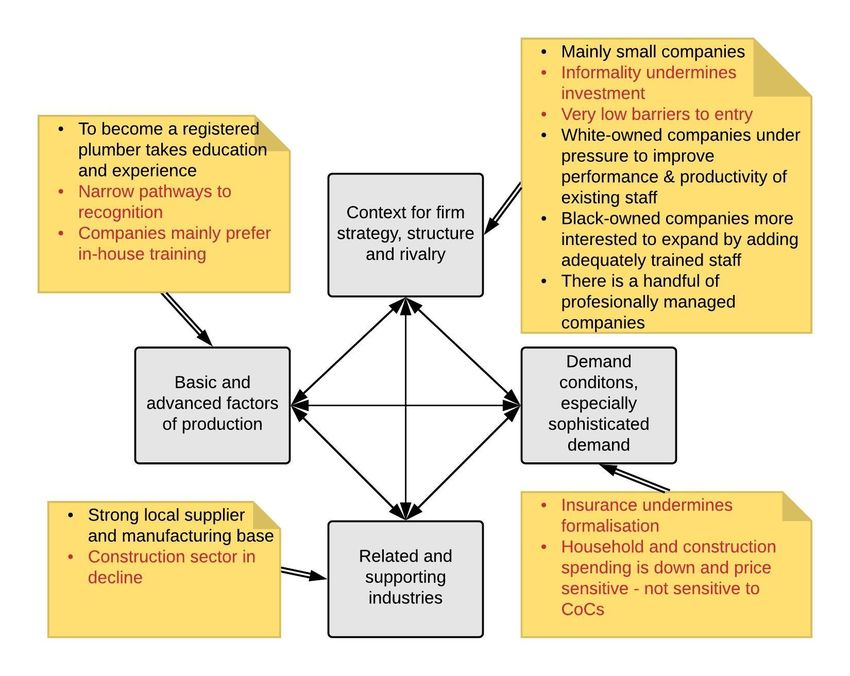
ABOUT THIS PUBLIC ATION
GIZ / SD4GE commissioned two studies aimed at deepening an understanding of the trends and
dynamics of plumbers and electrical contractors in South Africa. The objectives of this study
included the imperative to strengthen the range of institutions (public, private and not-for-profit)
that impact these trades. An additional aim of the research was to provide an overview of current
development in these trades, both at industry level and firm level. The findings are useful for
better planning informed by greater awareness of the transformations and changes emerging in
the specific contexts of industry.

The study produced three publicly available reports. This second report homes-in on the plumbing
industry-level dynamics. It took the insights from the high-level study further and looked at the
key institutions representing the private sector. A firm-level survey was designed to understand
better the challenges confronting company owners, and what pressures they were facing in terms
of productivity, market changes and staff. The results of the business owner survey for plumbing
contractors are discussed in this report.

GIZ/SD4GE commissioned PEM Consulting and Mesopartner Africa to conduct the industry diagno-
sis. Dr Shawn Cunningham and Annelien Cunningham from Mesopartner led and coordinated the
industry diagnosis. A team of researchers from TIPS (Trade & Industrial Policy Strategies) conduct-
ed research and statistical analysis. The TIPS team included Asanda Fotoyi, Sajid Sherif, Mbof-
holowo Tsedu while Saul Levin provided policy insight and guidance.

The research would not have been possible without the help and support of the industry bodies
and their members. The Institute of Plumbing (SA) (IOPSA) and Plumbing Industry Registration
Board (PIRB) contributed and supported the plumbing analysis. Electrical Contractors Association
of South Africa (ECASA) and the National Bargaining Council for the Electrical Industry (NBCEI)
supported and contributed to the electrical analysis.

GIZ / SD4GE would like to thank all the stakeholders and industry members for their valuable
contribution.

Editor
Skills Development for a Green Economy (SD4GE) Programme
Deutsche Gesellschaft für Internationale
Zusammenarbeit (GIZ) GmbH
Registered offices: Bonn and Eschborn
GIZ Office Pretoria
P.O. Box 13732, Hatfield 0028, Hatfield Gardens, Block C, 2nd Floor,
333 Grosvenor Street
Pretoria, South Africa
Tel.: +27 (0) 12 423 5900
www.giz.de
Responsible: Heike Buerskens
Photos: Ralf Bäcker
Design/Layout: WARENFORM

Pretoria, September 2019
Contents
1     Introduction ..................................................................................................................... 4
2     Understanding the perspective of the plumbing and electrical contracting industries ... 5
3     The plumbing industry landscape in South Africa ............................................................ 7
    3.1     Formal organisation of the industry .......................................................................... 8
    3.2     Plumbers in South Africa ......................................................................................... 10
4     The plumbing business owner survey process and results ............................................ 13
    4.1     Basic factors of production ...................................................................................... 20
    4.2     Advanced factors: knowledge, technology and institutional support ..................... 27
    4.3     Supporting or enabling industries ........................................................................... 30
    4.4     Demand conditions .................................................................................................. 31
    4.5     Government and NGO support................................................................................ 34
    4.6     Cross-tabulation of plumbing business owners’ results .......................................... 35
5     Recommendations from the plumbing owner survey.................................................... 40
    5.1     To IOPSA and the PIRB ............................................................................................. 40
    5.2     To GIZ/SD4GE .......................................................................................................... 42
6     Conclusions .................................................................................................................... 42
7     Supporting upgrading and transformation .................................................................... 45
    7.1     The challenges facing informal enterprises in townships ........................................ 45
    7.2     Transformation in the plumbing industry ................................................................ 47
    7.3     Competitive pressures on different archetypes of plumbers .................................. 49
    7.4     Recommendations to support transformation ........................................................ 56
8     Bibliography ................................................................................................................... 58

Tables
Table 1: Different factors of production .................................................................................. 6
Table 2: Competitive pressure on informal plumbers ............................................................ 50
Table 3: Competitive pressure on small white plumbers ....................................................... 51
Table 4: Competitive pressure on small black plumbers........................................................ 53
Table 5: Competitive pressure on medium to large (corporate) plumbers ........................... 54

                                                                                                                                        2
Figures
Figure 1: Porter's Diamond of competitive advantage ............................................................ 6
Figure 2: Provincial representation in the plumbing firm-level survey .................................... 9
Figure 3: Plumbing business owners by sector, 2013-2017 ................................................... 10
Figure 4: Formal and informal plumbers in the LMD data, 2013-2017 .................................. 11
Figure 5: Plumbing business owners by business size, 2017 .................................................. 12
Figure 6: Plumbing business owners by race, 2017................................................................ 12
Figure 7: Plumbing business owners by age, 2017 ................................................................. 13
Figure 8: Plumbing survey results, ownership by race ........................................................... 14
Figure 9: Plumbing survey results: Company size .................................................................. 15
Figure 10: Response to business pressure ............................................................................. 16
Figure 11: Major challenges faced by the plumbing business owner .................................... 16
Figure 12: Company size by major challenges........................................................................ 17
Figure 13: Other challenges faced by the plumbing business owners ................................... 18
Figure 14: Preferred form of training ..................................................................................... 19
Figure 15: Company size and external challenges expressed by plumbing business owners 21
Figure 16: The current training preferences according to company size ............................... 23
Figure 17: Training priorities of respondents ......................................................................... 24
Figure 18: Plumbers by industry, LMD data 2008-2017 ......................................................... 25
Figure 19: Highest qualifications of plumbing workforce according to the LMD ................... 26
Figure 20: Major challenges by firm size ................................................................................ 27
Figure 21: Importance of different markets ........................................................................... 31
Figure 22: Type of clients not applicable to respondents ...................................................... 32
Figure 23: Demands by client type ......................................................................................... 33
Figure 24: Importance of domestic maintenance by firm size ............................................... 33
Figure 25: Importance of government work by firm size ....................................................... 34
Figure 26: Comparison of plumbing company size by owner age .......................................... 35
Figure 27: Priorities of different sized plumbing companies.................................................. 36
Figure 28: Plumbing company size by race ............................................................................ 37
Figure 29: Priorities of black, Indian and coloured plumbing business owners ..................... 38
Figure 30: Priorities of white plumbing business owners ...................................................... 38
Figure 31: Company priority and past training preferences .................................................. 39
Figure 32: Black, Indian and coloured priorities in the insurance market.............................. 39
Figure 33: White priorities in the insurance market .............................................................. 40
Figure 34: The Diamond of the plumbing industry in South Africa ........................................ 44
Figure 35: Competitive pressure on informal plumbers ........................................................ 51
Figure 36: Competitive pressure on small white plumbers.................................................... 52
Figure 37: Competitive pressure on small black plumbers .................................................... 53
Figure 38: Competitive pressure on medium to large (corporate) plumbers ........................ 55
Figure 39: Comparing the competitive pressure on different plumbing archetypes ............. 56

                                                                                                                            3
1 Introduction
This project concerns the understanding of the trends and dynamics of two trades: plumbers
and electrical contractors. In the past, much of the focus of GIZ/SD4GE was on improving the
supply-side issues of (green) skills delivery in South Africa. Despite the attention to improving
the quality of education, GIZ/SD4GE has always had a strong focus on involving the private
sector in its work, especially when it comes to workplace learning, which is central to the dual
systems approach.
This report provides an industry perspective of the trade, from the view of the plumbing
business owner. Our interpretation of the industry analysis is that it is much more than just
understanding the demand for, and shifting patterns of, the uptake of skills. We understand
that the purpose of an industry diagnosis is to provide GIZ/SD4GE and its stakeholders with
insight into, and several perspectives of, the pressures faced within the industries, the firms
that comprise the industries and the institutions that promote them. This analysis will make
it possible to strengthen the range of institutions (public, private and not-for-profit). It will
also inform GIZ/SD4GE and its stakeholders to better plan for the changes that are emerging.
It may even make it possible to detect shifts that have not yet been discovered or articulated.
The report is structured around the work packages that made up the contract. The first work
package concerns a high-level overview of the industries, and the results are captured in a
separate report, namely report 1. Our aim was to scan the publicly available statistics to
better understand what is known, what is being tracked and what is changing. This high-level
overview also revealed how the two trades, plumbing and electrical, are structured, which
organisations are identified with the sectors and what the high-level dynamics are.
The second work package homed in on the industry-level dynamics. It took the insights from
the high-level study further and looked at the key institutions representing the private sector.
Then a firm-level survey was designed to better understand the decisions confronting
company owners, and what pressures they were facing in terms of productivity, market
changes and staff. This report describes the findings of the research into the plumbing
business owner and the plumbing industry analysis. The findings of the electrical contracting
study are captured in report 3.
The third work package was originally geographically focused on townships and informal
enterprises. However, as the project unfolded, PEM/Mesopartner and GIZ/SD4GE realised
that as the main challenge was about transformation and change within the industries, an
explicit focus on transformation would be more appropriate. The findings of this work are
captured in Chapter 7 of this document.
42 Understanding the perspective of the plumbing and electrical
contracting industries
Companies make optimal decisions in a local context in a decentralised way. These different
experiences and perspectives add up to a rich set of archetypes from which we can extract
ideas about problem pressures, appetite for expansion, interest in skills development or
market preferences. An industry diagnosis provides more depth than the simpler stereotypes
of small vs. large, or white vs. black.
We approached the industry diagnosis on two distinct levels:
• The first was to develop an understanding of the industries at a more aggregate level,
using a combination of interviews, desktop research and statistical analysis. To
structure the findings Porters Diamond (Porter, 1998) was used as a guideline,
although additional dimensions had to be captured that did not feature in the original
work of Professor Michael Porter.
• The second was a firm-level analysis aimed at business owners.
Porter’s “Diamond” of competitiveness attempts to isolate the factors that influence the
competitiveness of industries and nations (1998:71). An adapted illustration is shown in
Figure 1.
Porter’s Diamond has four attributes that shape the environment in which local firms
compete, promote or impede the creation of competitive advantage. These four dimensions
all exert a force on each other, with the Diamonds of different contexts and countries’
exerting different kinds of forces on each other.
Porter (1998:77) explains that for each economic activity, goods and services are produced
with a combination of factors that reflect the factor endowments of the entity in question.
Thus goods and services that can be produced with a relatively high proportion of labour to
capital tend to be manufactured in countries where labour is relatively abundant. Arrow
(1999:17) adds that knowledge is becoming an increasingly important factor in production,
which is affecting the ability of firms to remain competitive. While capital and labour are
considered private goods, growth is achieved through increases in knowledge.
5Figure 1: Porter's Diamond of competitive advantage
Adapted from Porter (1998:71)
At a later stage, Porter added the government and chance as two additional forces. This is a
recognition of the role of governments in creating an enabling business environment. Chance
affects not only the industry being studied, but all the factors in the Diamond model.
Table 1 shows the different factors of production as originally described by Porter (1998:77).
Table 1: Different factors of production
Factor type Description
Cover natural resources, climate, location, unskilled and semi-skilled
Factor conditions labour, and debt capital
Include modern communications infrastructure, highly educated
Advanced factors personnel such as graduate engineers and computer scientists, and
university research institutes in sophisticated disciplines
Include the transport system, debt capital and well-motivated and
Generalised factors qualified employees who can be employed in a wide range of industries
6Involve narrowly skilled personnel, infrastructure with specific
Specialised factors properties, knowledge bases in particular fields and other factors
relevant to a limited range or even just to a single industry
Source: Porter (1998:77)
To conduct the firm-level analysis, we engaged with representatives of industry bodies in
plumbing (IOPSA, PIRB) and electrical contracting (ECA) to determine what current data they
had in their possession and knowledge gaps. The plumbing engagement was done earlier
(November 2018), hence the plumbing research instrument was designed earlier than the
electrical survey. The surveys were designed in close cooperation with the industry bodies to
ensure that they derived value from the research approach and results, and to enable them
to further research questions and interesting findings that arose. In both cases the industry
bodies took responsibility for disseminating the surveys to their members and non-members.
The survey design process was treated by PEM/Mesopartner as an important capacity
development and industry association strengthening process.
The plumbing and electrical contracting industries were diagnosed during the period
November 2018 to May 2019, and the main results are discussed in the following two
chapters.
3 The plumbing industry landscape in South Africa
The plumbing industry is in a gradual process of improvement and professionalisation.
Increasingly the industry is being regulated, with Certificates of Compliance for hot water
systems being introduced in the past few years. The industry business membership
organisations have matured from voluntary management to full-time professional
management with specialised executive functions such as training and technical managers.
Over the years the government has supported the activities of IOPSA. Professor Kadar Asmal,
in his different roles in several ministries, supported the work of the industry body, and over
the years the CSIR completed several studies on the industry regarding standards, regulations
and other topics. Important events, books and documents produced by IOPSA have been
endorsed by politicians and senior government officials over the years to different extents.
Since the inception of Professional Body recognition through the South African Qualification
Authority, in about 2012, the PIRB has been awarded this recognition. Being recognised by
SAQA means that the plumbing industry (through the PIRB) is a recognised and trusted
professional body (through the NQF Act). The PIRB forms part of a network of professional
bodies that are working to uphold high standards and improve competence and ethics in the
economy. It means that the plumbing industry can register its own learning programmes and
designations aligned to formal qualifications, and that the industry as a whole can be
benchmarked against other national and international professional standards. A significant
mind shift and change is sector as result of Professional Body status recognition is the
introduction of Continuous Professional Development (CPD).
7While plumbing is often associated with unblocking drains and repairing geysers (hot water
systems), plumbers also work on above- and below-ground drainage, gutters, solar water
heaters, gas water heaters, heat pumps and irrigation systems. Plumbers may be employed
in companies that are clearly identified as plumbing businesses, but they are also employed
in the construction sector, commercial property management, alternative energy, home
renovation and hospitals, schools, universities and other facilities. Plumbers may also be
employed in the retail or wholesale sectors, or by manufacturers of plumbing equipment and
raw materials.
A challenge faced by the plumbing industry is that it is seen by many public and social
upliftment programmes as an industry with low access barriers. This means that formally
registered (and competent) plumbers have to compete against informal and unregistered
plumbers, while at the same time consumers and the construction industry are under
pressure to pay lower and lower fees. This undermines investment in the plumbing industry,
which then directly affects skills development and improved productivity in the industry.
3.1 Formal organisation of the industry
The officially recognised plumbing industry body is IOPSA (Institute of Plumbing South Africa,)
which represents private sector employers. It is recognised by national government
departments and institutions such as the South African Bureau of Standards (SABS) as the
official representative of the industry.
IOPSA was formalised in 1989 and is affiliated to the World Plumbing Council, the South
African Institute of Occupational Health and Safety and the Federated Employers
Mutual (FEM) Assurance Company (RF) Proprietary Limited. In the last 15 years it has changed
from a voluntarily managed organisation to professional management organisation with
specialised functional areas such as training, technical support and standards development.
However, before formalisation the plumbing industry was already well organised and pro-
active. For instance, to celebrate its 21st year of existence in 2009, IOPSA published a book
that contains an historical oversight of the efforts by the industry association and its members
to improve their trade, industry and contribution to the economy. This book explains in detail
efforts to improve the quality of workmanship and materials, skills development and
formalisation of the industry. Several of the current champions were already featured in this
book. The foreword to the book was written by the then minister of water affairs.
At a provincial level, IOPSA is represented by voluntary committees consisting of members.
In each of the provinces monthly technical meetings are held. The following sub-chapters are
active:
• Gauteng
• Western Cape
• Southern Cape
• Eastern Cape
• Free State
• Border (greater East London area)
• Kwazulu Natal
8Working committees do not exist in Mpumalanga, North West province and Limpopo. A
challenge in establishing working committees is that the activities are voluntary and time
consuming. Means of sustaining these committees in the more rural areas have not yet
emerged. The respondents of the plumbing business owner survey mirror the functionality of
the IOPSA provincial structures (see Figure 2).
Figure 2: Provincial representation in the plumbing firm-level survey
76
42
32 31
11
9 5 2 2 2
Gauteng Western Cape Kwa-Zulu Eastern Cape Free State Mpumalanga Limpopo North West Northern Multiple
Natal Cape
Source: Plumbing Business Owners Survey (TIPS, 2019b)
All administration, event organisation and technical support are provided from the IOPSA
head office in Dowerglen, Johannesburg. IOPSA has several permanent functions, including a
technical manager, a training manager with supporting staff, a marketing and membership
support function, and an active executive. IOPSA is actively involved in several collaboration
projects with GIZ/SD4GE, DHETSSACI, the NBI, Harambee, Nedbank and also private training
providers. They regularly meet with SETAS, the QCTO and other public organisations to
further the interests of plumbers and to advocate for better standards, support, training and
working conditions for plumbers.
The Plumbing Industry Registration Board (PIRB) works to promote good plumbing practices
that protect the health and safety of the community. They strive to protect the integrity of
the water supply and waste water systems by providing a comprehensive registration system
for individual qualified plumbers. The performance of the plumbing trade is measured
through auditing processes and the issuing of certificates of compliance. The PIRB is a
professional body that is recognised by the South African Qualifications Authority to uphold
high standards of competence and ethics. The PIRB is tasked with quality assurance within
the plumbing industry, the development of standards in the national qualification framework
(NQF), strengthening the accountability within the plumbing profession, and to promote fair
policies and practices. Also, the PIRB is tasked with maintaining and administering a live and
updated registration system and database of all registered plumbing practitioners in South
Africa.
Plumbers who are registered with the PIRB are recognised as professional tradespeople. They
receive a registration card and attend a variety of events, training courses and opportunities
to earn continuous professional development points (CPD). The CPD system allows the PIRB
9to incentivise knowledge improvement, participation in events, awareness raising about new
developments, standards and practices. The CPD system is significant in how it strengthens
the professional development of the system. It allows for differentiation, yet it also sets
recognised pathways and promotion opportunities.
There are other smaller forms of industry organisation, such as the plumber’s sub-category in
the Master Builders Association. The National Home Builders Registration Council regulates
the structural elements of a home and does not appear to have a programme for, or specific
interest in, developing the plumbing trade.
3.2 Plumbers in South Africa
Plumbers are mainly tradespeople who operate as self-employed, informal or small
businesses in South Africa. Using Statistics South Africa data, TIPS estimates that there are
more than 125 000 self-identified plumbers in South Africa. In this same dataset, 10 359
employed one or more people and 12 860 are own-account workers.
The plumbing industry is characterised by far more informal activity than formal, with the
number of formal enterprises declining every year and the number of informal operators
increasing (see Figure 3).
Figure 3: Plumbing business owners by sector, 2013-2017
An employer Own account
25.000
20.000
15.000
10.000
5.000
-
Formal sector
Formal sector
Formal sector
Formal sector
Formal sector
Informal sector
Informal sector
Informal sector
Informal sector
Informal sector
2013 2014 2015 2016 2017
Source: Statistics South Africa, Labour Market Dynamics, 2013-2017. Electronic Database
The extent of the informal activity was also a surprise to IOPSA and the PIRB. While some
informal plumbing activity could be ascribed to do-it-yourself activity, and some to working
in a reciprocal way for family, friends and neighbours, it is hard to determine where the more
than 100 000 unaccounted informal plumbers are working.
Figure 4 shows the extent of the informality according to the LMD data. It shows that the
majority of plumbing businesses are operating in the informal sector. The only exception is
the Western Cape province, where there are more formal than informal plumbing businesses.
10Figure 4: Formal and informal plumbers in the LMD data, 2013-2017
7000
6000
5000 2013 Informal sector
4000 2014 Informal sector
3000 2015 Informal sector
2016 Informal sector
2000
2017 Informal sector
1000
0
Western Cape Eastern Cape Northern Cape Free State KwaZulu-Natal North West Gauteng Mpumalanga Limpopo
4500
4000
3500
2013 Formal sector
3000
2500 2014 Formal sector
2000 2015 Formal sector
1500 2016 Formal sector
1000 2017 Formal sector
500
0
Western Cape Eastern Cape Northern Cape Free State KwaZulu-Natal North West Gauteng Mpumalanga Limpopo
The TIPS was asked to further unpack these numbers, and they found that in 2017, 3 586
employers operated in the formal sector (employing one or more people), while 6 773 own-
account businesses were operating as informal enterprises. This means that they did not
employ anybody formally except as casual or wage-based workers with no fixed-term
employment contracts, benefits or social benefits.
The high-level data analysis by the TIPS confirmed that most plumbers are small with either
one own-account operator, or between 2 to 9 workers (see Figure 5).
11Figure 5: Plumbing business owners by business size, 2017
20 00 0
21 7
3 81 3
16 00 0
2 74 3
5 0 or m ore e mp l o ye es
12 00 0
b et w ee n 1 0 an d 1 9 em p lo y ee s
b et w ee n 5 an d 9 e m pl o yee s
b et w ee n 2 an d 4 e m pl o yee s
8 0 00
1 e mp l oye e
1 2 49 8 Ow n a cc o u nt wo rk er
4 0 00 20 2
68 9
1 110
1 585
0 36 2
F orm a l s ector I nfor m al s e cto r
Source: Statistics South Africa, Labour Market Dynamics, 2017. Electronic Database
An analysis by race of the owners shows that there are increasing numbers of formal black,
Indian and coloured plumbers. Figure 6 shows that there are more formal black, Indian and
coloured plumbing business owners than white owners. However, the great majority of
plumbing businesses were in the informal sector by a large margin, with coloured and white
informal plumbers at much lower levels.
Figure 6: Plumbing business owners by race, 2017
20000
18000
16000
14000
12000
10000
8000
6000
4000
2000
0
African/Black Indian/Asian White African/Black Coloured White
Formal sector Informal sector
Source: Statistics South Africa, Labour Market Dynamics, 2017. Electronic Database
12Regarding gender, most plumbing business, whether formal or informal, are dominated by
men. Female business owners are most likely to be operating in the informal sector.
The age analysis of the Statistics South Africa LMD shown in Figure 7 reveals that more than
three-quarters of plumbing business owners are between the ages of 25 and 54. There is a
very small proportion of very young and very old plumbing business owners.
Figure 7: Plumbing business owners by age, 2017
274
131
2 372 2 038
15 - 19 years old
20 - 24 years old
4 596
25 - 34 years old
35 - 44 years old
45 - 54 years old
8 407
55 - 64 years old
Older than 65 years old
5 399
Source: Statistics South Africa, Labour Market Dynamics, 2017. Electronic Database
4 The plumbing business owner survey process and results
The firm-level research started with an analysis of the data that IOPSA and the PIRB had
already collected in a first plumbing firm survey conducted in 2018. The August 2018 IOPSA
survey was a comprehensive survey that gave rise to many important insights. Their survey
received an astonishing 779 responses due to an incentive to earn CPD points from the PIRB.
It is the stated intention of IOPSA to repeat this survey annually (at the time of finalising this
report in August 2019 IOPSA had just sent out their 2019 annual survey). Meetings were held
at the PIRB and IOPSA premises to assess the industry data that IOPSA and the PIRB collect
and maintain. During these meetings it became apparent that IOPSA and the PIRB still had
many unanswered questions that could be further explored in GIZ/SD4GE-supported industry
analysis.
The questionnaire was designed in collaboration with IOPSA, the PIRB, GIZ/SD4GE and TIPS
(see Annexure 2.1). The aim was to better understand the constraints and reality of owners
13of plumbing enterprises. The questionnaire was designed to supplement the current database
of IOPSA and the PIRB, while assisting GIZ/SD4GE to better understand future skills demand
and the overall health of workplaces. It was targeted specifically at plumbing business owners.
On 28 February, the final research instrument was handed over to IOPSA and the PIRB for
distribution to the industry. The plumbing business owner survey was conducted in March
2019 and a total of 212 responses were received.
The results of the business owner plumbing survey are included as Annexure 2.2 in the form
of a presentation prepared by TIPS. The first part of the TIPS presentation is a further
statistical overview from Stats SA on company owners to give a better overview of the survey
results received based on discussions between IOPSA, the PIRB and the research team.
We will provide a brief overview of the research findings here. The results are integrated into
the rest of this chapter.
The business owners survey was mostly completed by men. Of the 212 responses, only 11
female responses were received. Interestingly, the ratio of female respondents is much higher
than that in the LMD data from Statistics South Africa (see Chapter 3.2). Figure 8 shows the
racial profile of the firm-level respondents.
Figure 8: Plumbing survey results, ownership by race
Coloured
Ind
ian
/As
ian
Bl a
ck A
fric
an
W
hi
te
Source: Plumbing Business Owners Survey (TIPS, 2019b)
The high-level statistical review showed that the plumbing industry itself is dominated by
smaller plumbing businesses (see Figure 5). IOPSA estimates that more than 90% of their
members employ fewer than five permanent staff. This was also reflected in the plumbing
business-level survey. Of the 212 respondents, 194 indicated that they operated from one
office or branch, with an additional 11 indicating that they operated from two sites. Figure 9
shows the company size of the respondents. 34% (72 respondents) had 2–4 employees, while
1487% (188 respondents) had fewer than 20 employees. Only 2% of the respondents had 50 or
more employees.
Figure 9: Plumbing survey results: Company size
2%
11% 9% 1 employee
2 - 4 employees
5 - 9 employees
20% 10 - 19 employees
34%
20 - 49 employees
more than 50
employees
24%
Source: Plumbing Business Owners Survey (TIPS, 2019b)
A question was formulated to understand the strategic response of the plumbing business
owners to the pressure in the business. The business owners could choose whether their
priority was to:
• Increase productivity and performance of current employees
• Expand the business with adequately skilled people
• Reduce staff, doing more work with fewer people.
The results of this question are shown in Figure 10. The graph shows that increasing the
productivity and performance of current employees was the highest priority, whereas
expanding the business with adequately skilled people was a slightly lower albeit significant
response. This question also provides an interesting way to segment all the respondents into
three different strategic priority groups. This discussion will be held in Chapter 3 of this report.
15Figure 10: Response to business pressure
15%
Increasing productivity and
performance of current
employees
45%
Expanding the business with
adequately skilled people
Reducing staff, more work with
fewer people
%
40
Source: Plumbing Business Owners Survey (TIPS, 2019b)
The majority of the survey respondents were small businesses, and their challenges mirror
the general patterns in the economy. From interviews with IOPSA and selected plumbers, we
know that many plumbers draw family members in to assist with administration, logistics and
payroll duties. Figure 11 shows the extent of the burden of financial and administrative
management in the company.
Figure 11: Major challenges faced by the plumbing business owner
Access to finance 83
Administrative burden 80
Debtors demanding credit 69
Creditors not offering accounts 32
Source: Plumbing Business Owners Survey (TIPS, 2019b)
16The same question is analysed in Figure 12, but from a company-size perspective. The results
show that as companies grow in size, there is a tendency for access to finance to become less
of a challenge. In fact, at 50 employees the challenges are more or less equally spread over
the four areas. Debtors demanding credit are more of an issue for larger firms as opposed to
smaller ones, probably because of the more corporate clients in construction and commercial
maintenance. Administrative burdens seem to increase as companies grow from 1 employee
to 10 employees.
Figure 12: Company size by major challenges
Access to finance Creditors not offering accounts Debtors demanding credit Administrative burden
more than 50 employees
20 - 49 employees
10 - 19 employees
5 - 9 employees
2 - 4 employees
1 employee
0% 10% 20% 30% 40% 50% 60% 70% 80% 90% 100%
Source: Plumbing Business Owners Survey (TIPS, 2019b)
When asked about “other” factors that were affecting their enterprises, access to markets,
bad debt and staff competencies as well as regulatory burdens were most often cited (see
Figure 13).
17Figure 13: Other challenges faced by the plumbing business owners
22
13
11 11
6
3
2 2
1 1 1 1
Access to markets
Bad debts/ delayed payments
Competency of staff
Regulatory burden
Competition
Costs
Competition
Reliable transportation
Crime
Health and safety regulations
Labour regulations
Quality of supplies
Source: Plumbing Business Owners Survey (TIPS, 2019b)
Surprisingly, quality of supplies and labour relations, health and safety and crime had very
low frequencies in the survey.
When asked about the external environment, most respondents complained about the
current economic climate and the high number of unlicensed plumbers who are operating in
the economy, followed by a lack of skilled people and lastly black economic empowerment
legislation.
From a financial and profitability perspective, it appears that most plumbers are charging low
rates, and also paying low salaries. Most plumbing business owners charge between R300-
R600 per hour. Qualified plumbers are mostly paid more than R10 000 per month. Unqualified
plumbers are paid more than R4 000 per month, with more than 80 respondents indicating
that unqualified plumbers were paid more than R5 000 per month. Learners, assistants and
apprentices were generally paid between R2 000 to just over R5 000 per month.
Most plumbing companies had one or two full-time managers and only one administrative
person. The owners in most cases were still working as plumbers. Almost 40% of the plumbing
owners reported paying their staff on a weekly basis, with 30% reporting that they paid
monthly salaries. A further 30% reported that they paid some workers monthly while they
paid others weekly.
In the firm-level survey, most plumbers did not use any formal recruitment methods to find
new staff. Most appointments were from the curb-side or walk-in. Referrals from family and
friends were also important sources.
18Figure 14 shows that most plumbing owners prefer to train their staff on the job (in-house)
or via the IOPSA website or YouTube channels.
Figure 14: Preferred form of training
70
60
50
Frequency
40
30
20
10
0
Source: Plumbing Business Owners Survey (TIPS, 2019b)
Not surprisingly, many owner respondents indicated that they did not send their staff on
training (31), or that their staff were sufficiently trained (21). Only 8 reported using TVET
colleges, with private training providers (15) or events arranged by SETA/CETA (23) being
preferred.
The demands on skills development and education will be discussed in more detail in Section
4.1.1.
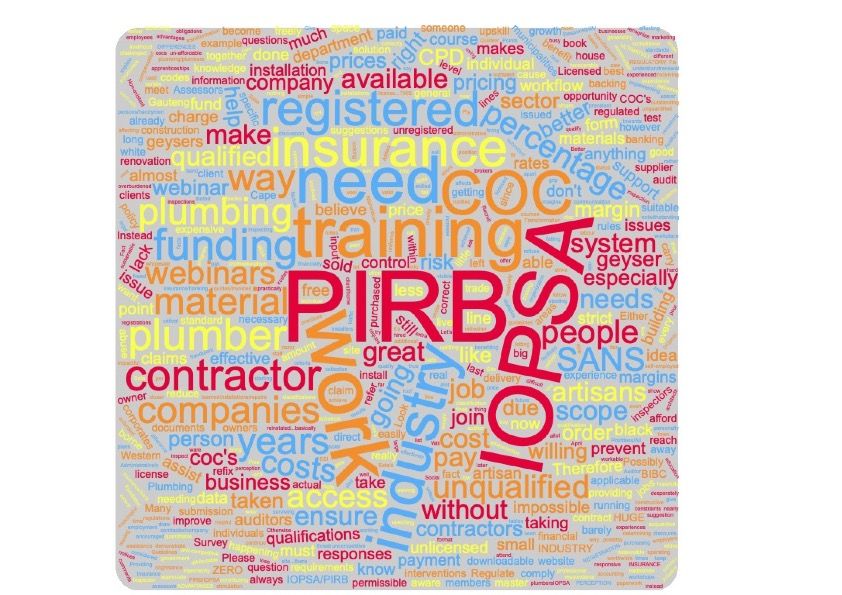
Question 34 in the Business Owner Survey asked: ‘Do you have any suggestions to IOPSA?’.
The responses were very valuable and are categorised in suggestions to IOPSA; suggestions
to the PIRB; Skills; Regulatory and Insurance. See Annexure 2.4 for all the responses to the
survey question.
The image below is a word cloud of the ‘Suggestions to IOPSA’ responses.
194.1 Basic factors of production
The economic environment is strongly shaped by the cost and accessibility of supply-side
inputs. Plumbers find themselves squeezed between the costs and efficiencies of supply-side
factors, the ability of larger client groups (such as construction and insurance) to negotiate
terms of trade, and the regulatory environment. Before we looked deeper into these different
aspects, our plumbing owner survey probed to see how the external environment shaped the
strategies of the companies. Figure 15 shows that smaller companies (below 9 employees)
are strongly affected by the prevailing economic context, challenges with securing skilled
workers, and competition from unlicensed plumbers. The figure shows that most companies
employing 50 or more workers reported the external economic climate as an important factor
constraining business. On balance, skilled people and unregistered plumbers are an equal
concern across all company sizes. Black economic empowerment (BEE) requirements are less
of a problem for smaller firms, probably because more black, Indian and coloured firms are
smaller. But this could also be because the markets served by smaller firms are domestic
households for whom BEE credentials are not so important.
20Figure 15: Company size and external challenges expressed by plumbing business owners
Current economic climate Skilled people Unlicensed plumbers BEE
more than 50 employees
20 - 49 employees
10 - 19 employees
5 - 9 employees
2 - 4 employees
1 employee
0% 10% 20% 30% 40% 50% 60% 70% 80% 90% 100%
Source: Plumbing Business Owners Survey (TIPS, 2019b)
It is important for GIZ/SD4GE to consider that skills uptake is also affected by costs of land
and capital, and that the ability of plumbers to finance a vehicle might affect their willingness
to employ or take on more learners.
The following sub-sections take a look into the basic factors of production:
• Skills
• Labour
• Finance,
Thereafter the more advanced factors of production are discussed.
4.1.1 Skills
The plumbing trade is one of the critical skills areas identified by the Department of Higher
Education and Training. Over the past few years the plumbing trade has received a lot of
support from GIZ/SD4GE, especially regarding solar water heaters, and also from other
international and domestic development cooperation partners.
However, plumbers regularly express their frustration with the quality of graduates who
complete the formal education at TVET colleges. This despite the huge amount of funds and
support being poured into the education of plumbers at public TVET colleges.
IOPSA recognises five public TVET colleges:
• Northlink College (Belhar, Cape Town)
21• College of Cape Town (Cape Town)
• Flavius Mareka (Sasolburg)
• Ekurhuleni East College (Springs)
• Umfolozi College (Richards Bay)
IOPSA also recognises the following five private colleges:
• Africa International Training Facilities (Bredell, Gauteng)
• Tjeka Training Matters (Krugersdorp)
• Africa Skills Village Training and Management Services (George, Southern Cape)
• PCD College (Pretoria)
• MAASA (East London)
In interviews with IOPSA, PIRB staff and industry representatives, we were told that the
industry is frustrated by the lack of responsiveness of the TVET sector. Complaints about the
lack of responsiveness ranged from lecturers not showing up for courses (co-arranged with
GIZ/SD4GE), to lecturers not being qualified plumbers. Expressions of doubt about the
commitment of the TVET sector also included statements that ranged from the poor career
advice and guidance given to young entrants into the system to the fact that training of
existing staff was very difficult to arrange with public TVET colleges.
Since 2012, registered and licensed plumbers must issue certificates of compliance for hot
water systems (geysers, solar geysers and heat pumps) in terms of the respective mandatory
standards. Although these regulations and standards are not new, what is different is an
emphasis on enforcement and compliance that is applied within the certificate of compliance.
Just having a qualification of a plumber is not enough, all plumbers must be registered with
the PIRB and must pass an assessment before they are qualified as being licensed. Only
licenses plumbers can issue certificates of compliance.
The challenge is that many untrained staff members appear to be stuck at low levels of formal
qualification with little opportunity for them to receive further formal training during work
time. This means that plumbers have to dispatch more senior and qualified plumbers to
oversee and sign off on the work of less experienced and lower qualified staff, thus increasing
the costs of the business and making the logistics more complicated. While some of the larger
plumbing companies have found ways of doing this, some of the smaller plumbers are
struggling as the only person that is often the business owner.
At this point the full costs of issuing certificates of compliance cannot yet be passed on to the
market, because there are people willing to pay for and plumbers willing to do work that is
not certified as compliant. While the cost of issuing a certificate and compliance is only R160,
many plumbers are not able to absorb the cost or pass on this cost to their clients. Plumbers
that are licensed are not yet perceived by the market as being more valuable and qualified
than an unlicensed plumber. For instance, the insurance market is not yet willing to insist on
certificates of compliance for work done by plumbers, despite the regulations. The insurers
do not allow licensed plumbers to claim higher rates (to cover the certificate of compliance).
However, the increased compliance and its enforcement is critical in strengthening the
professionalisation of the plumbing trade.
22IOPSA reports that the most searched-for term on their website is skills development. It is not
clear whether these searches are being done by individuals wanting to further their own
careers, or by firm owners or training providers.
In Figure 16, the training preferences by different sized companies are shown. It is interesting
to see how, as companies grow, the importance of in-house training increases. IOPSA
webinars are also an important source of knowledge content. The bigger the company, the
more likely the SETA/CETA will be to play an important role. As companies grow beyond 2
employees, supplier demonstrations and product training also grow in importance.
Figure 16: The current training preferences according to company size
I don't send my staff on training In-house training
IOPSA webinars My employees are sufficiently trained
Private training provider SETA/CETA
Supplier demonstrations or product training TVET (FET/Technical College)
more than 50 employees
20 - 49 employees
10 - 19 employees
5 - 9 employees
2 - 4 employees
1 employee
0% 10% 20% 30% 40% 50% 60% 70% 80% 90% 100%
Source: Plumbing Business Owners Survey (TIPS, 2019b)
In the past year IOPSA introduced a service to assist its members with skills development
plans. It was reported that many IOPSA members were unaware of skills development plans,
levies and formal training options. In the Western Cape the bargaining council still claims a
levy from employers, and they arrange the training programmes that are implemented by the
MBA.
We were told that IOPSA was increasingly working with private training colleges to ensure a
sufficient supply of graduates that meets the theoretical and practical requirements of the
industry. Generally, it was felt that the graduates from the private training colleges exceeded
the expectations of industry and were able to meet the trade test requirements more easily.
In Figure 16 the role of private colleges is show in green, and it is clearly visible that TVET
students are important mainly for companies with 2 to 9 employees. Interestingly enough,
for companies with 1 staff member, a private training provider is preferred.
23Although IOPSA participated in the curriculum development process at QCTO, they are not
satisfied with the quality of the trade test or the quality of graduates from the TVET sector.
Contrary to the opinion of IOPSA, other participants in the curriculum development process
feel that the industry had an opportunity to make inputs, and that some of the demands of
the industry were unnecessary and did not fit into the timelines or the specifications of the
curricula.
With regard to the dual system approach, both IOPSA and the PIRB strongly expressed the
opinion that the dual system is exactly what South Africa needs. However, it also felt that
many plumbers did not use the word “apprentice” in the same way as GIZ/SD4GE or PIRB,
and that there were different opinions between the industry bodies, GIZ/SD4GE and other
organisations such as SSACI and the DHET about how the dual system is supposed to work.
For instance, many plumbers (and other trades in general) refers to an apprentice as any
younger person who is working to gain experience, even if they are not on a formal education
programme. There are also differences in how the dual system is described by different
stakeholders.
In terms of anticipated training priorities, the owners were asked about their future training
priorities (see Figure 17). The graph in Figure 23 shows the importance of upskilling existing
staff (113) and improving the qualifications of technical plumbing assistants (93). This shows
that most of the immediate training demand is for short courses.
Figure 17: Training priorities of respondents
Upskilling existing staff to qualified
2 plumber
17 More experienced and
18 knowledgeable technical plumbing
20 assistant
Upskilling existing staff to licensed
plumber
24 113
Product knowledge
Occupational health and safety
46
Business training
Recognition of prior learning
66 93 Soft skills, e.g .Sales
I have no need for further training
71
Other
Source: Plumbing Business Owners Survey (TIPS, 2019b)
Product knowledge, occupational health and safety, business training and soft skills training
were all given much lower priority. Only 20 respondents indicated that recognition of prior
learning was important.
244.1.2 Labour
The bargaining councils are reported not to be active, except in the Western Cape. The wages
in the plumbing industry vary according to provinces and the market segments they serve.
The wages are estimated to be half of those paid in the electrical trade.
The high-level study conducted by TIPS (2019b) showed that a huge number of workers are
employed in the sector in an informal capacity. The LMD data estimates that there are
125 000 plumbers in the South African economy.
TIPS further analysed the LMD data to determine where the plumbers are employed. The
LMD asked the respondents for the name of the organisation which they worked for and the
main type of goods and services produced. This information is used to classify individuals
according to the Standard Industrial Classification (SIC) codes. These codes are then grouped
together according to the type of industry as shown in Figure 18 for plumbers.
Figure 18: Plumbers by industry, LMD data 2008-2017
Source: TIPS in Annex 1.1, calculations based on LMD 2008-2017.
Figure 18 shows that the majority of plumbers work in the construction industry where there
has been an increase in their proportion over the analysis period (60% in 2008 and 85% in
2017). The construction industry consists of 5 SIC codes: site preparation; building of
complete constructions or parts thereof; building installation; building completion; and
renting of construction of demolition equipment with operators. In 2017, more than 99% of
plumbers in the construction industry were found to be working in the ‘building installation’
category.
The other salient feature in Figure 18 is the declining proportion of plumbers working in the
community, social and personal services industry. In 2008, when this industry exhibited the
largest proportion of plumbers, more than half of those individuals worked for the ‘local
authority’ and approximately 15% worked for ‘central government’. Later years’ results are
concerning for plumbers in this industry as there was a sharp decline in plumbers post-2012,
25where this trend continued such that in 2017 only 0.22% of plumbers worked in the
community, social and personal services industry.
TIPS analysed the LMD data to assess the reported qualifications of the plumbing workforce
as it was recorded in the labour market dynamics statistics. The results are shown in Figure
19 below.
Figure 19: Highest qualifications of plumbing workforce according to the LMD
90000
80000
70000
60000
50000
Incomplete matric
Matric
40000
N1-N3
N4-N6
Certificate/Diploma without matric
30000 Certificate/Diploma with matric
University qualification
20000
10000
0
2008 2009 2010 2011 2012 2013 2014 2015 2016 2017
Incomplete matric 57507 58220 49060 59137 58452 70808 71292 81739 70580 66696
Matric 14592 11574 12397 14206 24142 29807 31741 40953 39632 40358
N1-N3 24595 19440 24258 23307 15380 1605 1041 1108 2259 2940
N4-N6 1266 2315 3211 1359 1677 1083 1813 2703 1402 1676
Certificate/Diploma without matric 2094 5448 5233 8697 4532 927 2496 0 1153 1708
Certificate/Diploma with matric 404 680 0 484 1358 6164 7047 7572 4484 4731
University qualification 946 1869 2107 1347 1711 4027 4299 4465 3985 7872
Source: TIPS Annexure 1.1 calculated from LMD 2008-2017 (TIPS, 2019a).
The study shows a large number of workers in the plumbing industry who did not complete
matric. Interestingly enough, the number of workers with a matric qualification has increased
to several times the number of workers with vocational qualifications. In general, Figure 19
shows very low levels of formal qualifications in the industry. It is not clear what the
experience levels of these workers are, and whether they would qualify for recognition of
prior learning (RPL) to ensure that they are placed on an upgrading pathway.
4.1.3 Finance and capital
Many smaller plumbing businesses are financed through personal collateral of the owners.
This means that older white-owned companies might have an advantage over younger black-
owned companies.
During the plumbing business owner survey, we investigated the major challenges
constraining the growth and performance of the companies. The results are shown in Figure
20, and it is clear that of the four major challenges, three are related to finance.
26Figure 20: Major challenges by firm size
Access to finance Creditors not offering accounts Debtors demanding credit Administrative burden
more than 50 employees
20 - 49 employees
10 - 19 employees
5 - 9 employees
2 - 4 employees
1 employee
0% 10% 20% 30% 40% 50% 60% 70% 80% 90% 100%
Source: Plumbing Business Owners Survey (TIPS, 2019b)
Black plumbers are reported to struggle to gain access to funding for start-up capital and
vehicle purchasing. This is especially so when smaller plumbers want to purchase a second-
hand vehicle and they do not quality for finance, resulting in vehicles being purchased for
cash. This most likely results both in cash flow problems as well as investment in cheaper and
less reliable vehicles.
4.2 Advanced factors: knowledge, technology and institutional support
Advanced factors mainly relate to specialised infrastructure, technological institutions and
the flows of knowledge in the system. While it is easy to see how knowledge can flow into a
sector (like plumbing) through the formal education system, a lot of tacit and advanced
knowledge that is more oriented towards problem solving is disseminated through other
means.
During our research we detected the following enablers of advanced factors of production:
• The Plumbing Africa trade journal
• The PLUMBDRAIN AFRICA trade fair
• Equipment and material suppliers hosting technical briefings
• The IOPSA webinars and active YouTube channel which is open
• The SABS and SA Watermark standards
4.2.1 The Plumbing Africa trade journal
Plumbing Africa magazine is an acknowledged and widely distributed trade journal which is
published by independent publishers on a monthly basis. It is bursting with information about
27standards, new materials, case studies, new specifications and other information of interest
to the industry. Plumbers and industry experts said that they kept Plumbing Africa magazine
because of the valuable content. The audited circulation of Plumbing Africa was 3 500 in
February 2019.
The publishers only allow those registered with IOPSA, or who are SABS and regulatory
compliant, to advertise in the magazine.
They have a very unique distribution method whereby smaller or informal plumbers can
register with a merchant or a wholesaler to receive their copies at the front desks. The
magazine has reported growing subscriptions from merchants based in townships. They have
also focused on areas such as Diepsloot and Alexandria due to large public investments in
water infrastructure and housing.
Due to the costs of procuring standards from the SABS, Plumbing Africa magazine covers
standards and regulatory changes in every issue. They also have a popular name-and-shame
column where plumbers can submit photos of poor workmanship.
4.2.2 The PLUMBDRAIN AFRICA trade fair
The PLUMBDRAIN AFRICA trade fair, co-located with Interbuild, is held every second year.
This event is seen as Africa’s largest construction and building services exhibition. The fair had
its 50th anniversary in 2018. It is held at the Nasrec expo centre south of Johannesburg.
The following information was taken from the https://plumbdrain.interbuild.co.za website:
Providing exhibitors an unrivalled marketing platform and a tangible return on
investment, PLUMBDRAIN AFRICA is one of Interbuild Africa's most successful co-
located shows.
The PLUMBDRAIN AFRICA fair has a reputation for showcasing the latest innovations
in products and services that adopt eco-friendly technologies, which help create
sustainable changes in the industry. Seminars and workshops educate the audience
about new products and solutions in the world of plumbing and provides insight into
new quality standards in the industry and relevant updated legislation.
PLUMBDRAIN AFRICA is the only dedicated plumbing, draining, sanitation, water, and
sanitaryware exhibition in Africa. Covering all facets of plumbing, from commercial
and industrial to standard domestic plumbing products and services.
Live demos and hands-on training give exhibitors an edge to market their products to
the industry effectively. The organisers encourage all exhibitors to create interactive
stands for the professionals and trades to experience and understand the material
fittings and technology that are on offer, coinciding with the mandatory standards
that apply to plumbing and affording great plumbing practices the attention it
deserves.
28You can also read