Report - A comparison of real driving emissions from Euro 6 diesel passenger cars with zero emission vehicles and their impact on urban air ...
←
→
Page content transcription
If your browser does not render page correctly, please read the page content below
Report
Report no. 8/18

              A comparison of real driving
              emissions from Euro 6 diesel
                                 "

              passenger cars with zero
              emission vehicles and their
              impact on urban air quality
              compliance
              Urban air quality study: extension I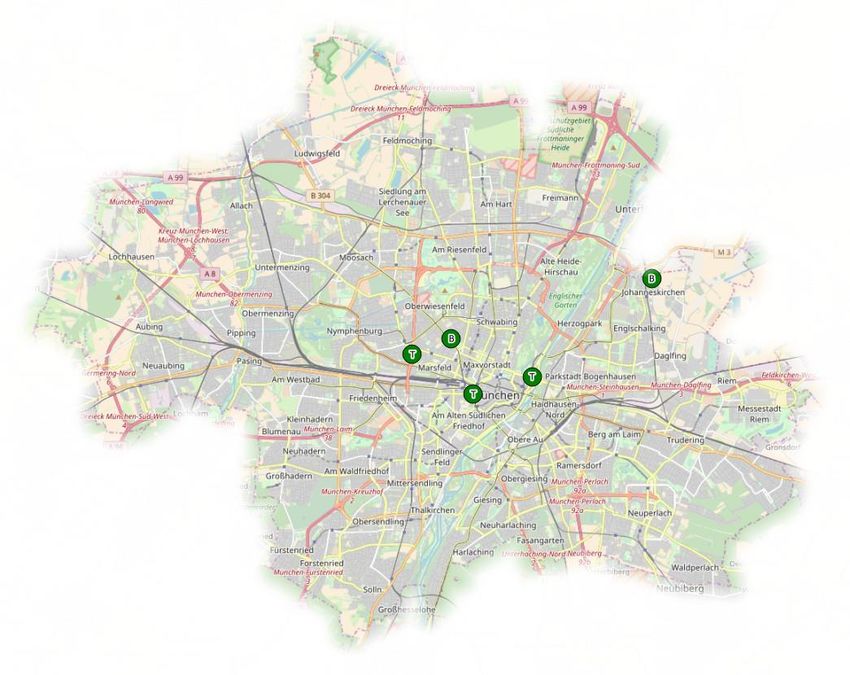
A COMPARISON OF REAL DRIVING
EMISSIONS FROM EURO 6 DIESEL
PASSENGER CARS WITH ZERO EMISSION
VEHICLES AND THEIR IMPACT ON URBAN
AIR QUALITY COMPLIANCE

URBAN AIR QUALITY STUDY: EXTENSION I

APRIL 2018

Prepared for Concawe by Aeris Europe:

Les White, Adam Miles, Chris Boocock, John-George Cooper, Stephen Mills
A Comparison of Real Driving Emissions from Euro 6 Diesel Passenger Cars with Zero Emission Vehicles and
their Impact on Urban Air Quality Compliance

EXECUTIVE SUMMARY

This report describes an extension to the Urban Air Quality Study commissioned by Concawe that explored
how urban air quality is affected by emissions from road transport and domestic combustion. In the first report
a particular focus was placed on the impact of real driving emissions (RDE) on urban concentrations of nitrogen
dioxide (NO2) and particulate matter (PM10 and PM2.5) and the effect this may have on compliance with
ambient air quality limit values at European, national and regional level. The aim of this extension study is to
determine how measured emissions from newer RDE compliant Euro 6 diesel passenger cars would affect the
concentration of NO2 in European urban environments. A comparison has also been made where the
substitution of Euro 6d diesel passenger cars with zero exhaust emission equivalents is explored.

In 2017, Concawe commissioned Ricardo to collect data from literature sources and test a range of Euro 6
diesel passenger cars using the new on-road real driving emission test cycle to measure actual on-road
emissions of NOX for each of the Euro 6 categories; Euro 6b (pre and post 2015), Euro 6c and Euro 6d (Temp).
The study showed that real world NOX emissions from diesel passenger cars are significantly reduced by
successive Euro 6 standards and suggests that the technical solutions available to Euro 6d cars will comply with
the 80 mg/km EU NOX emission standard for Euro 6 passenger cars under RDE test conditions.

Aeris Europe’s AQUIReS+ model has been populated with the emissions data collected by Ricardo and used to
model population exposure to concentrations of NO2, PM2.5 and PM10 across the 28 EU member states and 10
European cities: Antwerp, Berlin, Bratislava, Brussels, London, Madrid, Munich, Paris, Vienna and Warsaw.

The principal findings of the study are:

    •    In the natural turnover of the vehicle fleet, the significantly reduced NOX emissions from Euro 6d
         diesel passenger cars will be as effective as zero emission vehicles in helping cities become compliant
         with air quality standards.

    •    For NO2, PM2.5 and PM10, no appreciable effect on air quality compliance or population exposure is
         observed between any of the modelled diesel passenger car scenarios or their replacement with
         equivalent zero emission vehicles.

    •    NO2 compliance issues in traffic “hot-spots” persist until 2030 in a number of European cities under all
         modelled scenarios. It is unlikely that measures targeting new diesel cars will address this issue.

    •    In the case of particulates, modern passenger car emissions are largely independent of the drive-train
         given that mechanical abrasion (brake, road and tyre wear) is the most significant source.

    •    It is important to identify the actual emission sources contributing to each unique area of non-
         compliance to effectively address outstanding issues, for example, domestic heating or urban power
         generation in addition to road transport and other sources.

URBAN AIR QUALITY STUDY: EXTENSION I                                                                           2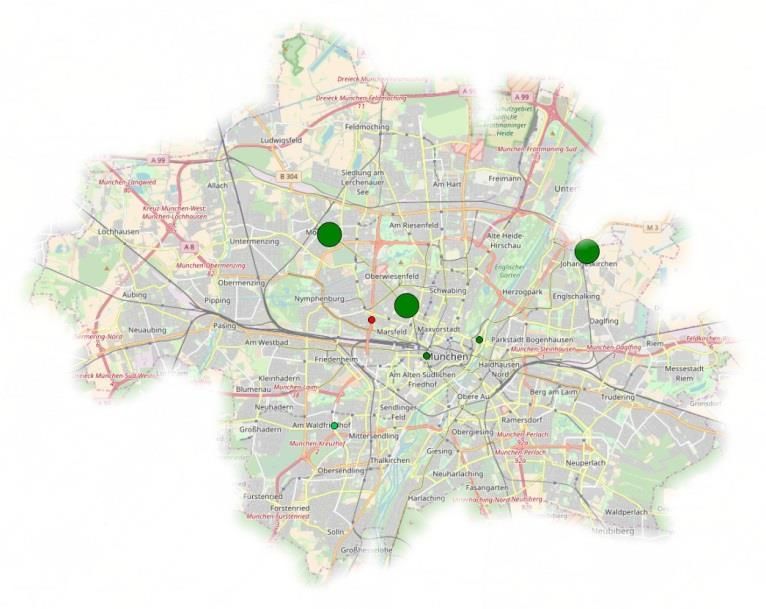
A Comparison of Real Driving Emissions from Euro 6 Diesel Passenger Cars with Zero Emission Vehicles and
their Impact on Urban Air Quality Compliance
CONTENTS
Executive Summary ................................................................................................................................................ 2
Contents ................................................................................................................................................................. 3
Introduction ............................................................................................................................................................ 5
Air Quality Limit Values ...................................................................................................................................... 7
Geographic Coverage and Resolution ................................................................................................................ 8
Nitrogen Dioxide Compliance Scenarios ............................................................................................................. 9
Particulate Matter Compliance Scenarios ........................................................................................................ 12
Methodology ........................................................................................................................................................ 13
AQUIReS+.......................................................................................................................................................... 13
Base Case Emissions ......................................................................................................................................... 15
Nitrogen oxides Emissions ................................................................................................................................ 17
Particulate Matter Emissions ............................................................................................................................ 20
Modelling Population Exposure ........................................................................................................................ 22
Results .................................................................................................................................................................. 23
Nitrogen Dioxide ............................................................................................................................................... 23
Compliance at EU Level ................................................................................................................................ 23
Compliance at Country Level ........................................................................................................................ 24
Compliance at City Level & Population Exposure ......................................................................................... 27
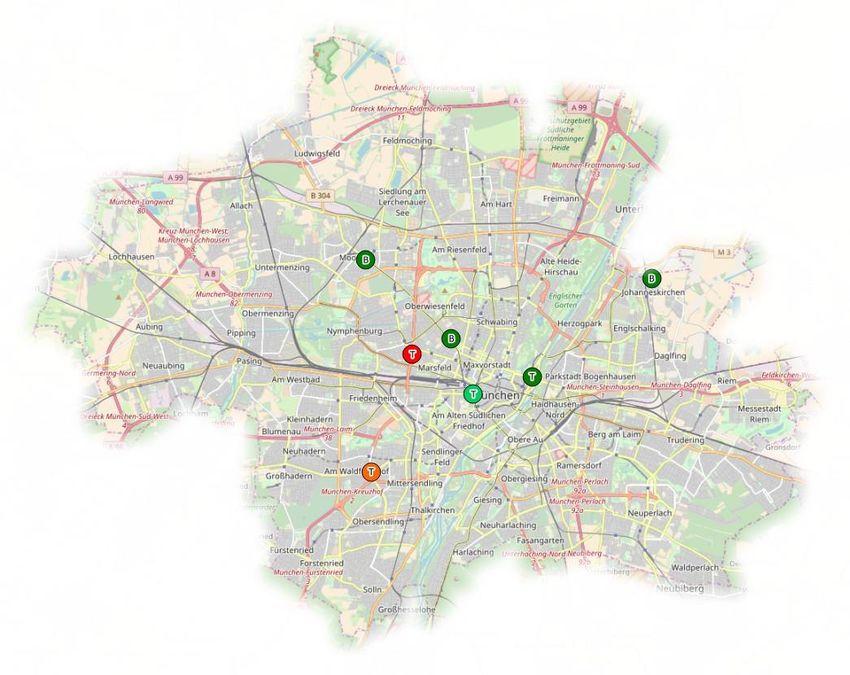
Effect on Population Exposure in Munich: Ricardo Median -vs- ZEV Scenario ............................................. 30
Particulate Matter ............................................................................................................................................ 32
Particulate Matter (PM2.5) ............................................................................................................................ 32
Particulate Matter (PM10) ............................................................................................................................. 35
Conclusions ....................................................................................................................................................... 37
References ............................................................................................................................................................ 38
Appendix A: Urban Population Living Close to Major Roads ................................................................................ 42
Appendix B: Concentration and Distance from Road ........................................................................................... 43
Appendix C: Data and Results - EU28 ................................................................................................................... 44
Emissions .......................................................................................................................................................... 44
URBAN AIR QUALITY STUDY: EXTENSION I 3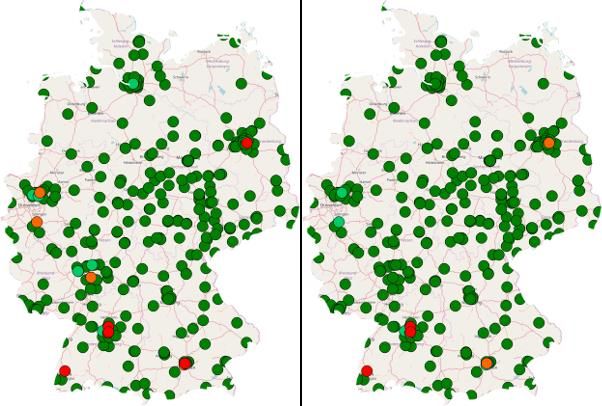
A Comparison of Real Driving Emissions from Euro 6 Diesel Passenger Cars with Zero Emission Vehicles and
their Impact on Urban Air Quality Compliance

   NO2 Compliance at Air Quality Stations – Totals of all Stations by Scenario .................................................... 45

   PM2.5 Compliance at Air Quality Stations – Totals of all Stations by Scenario .................................................. 47

   PM10 Compliance at Air Quality Stations – Totals of all Stations by Scenario .................................................. 48

Appendix D: Data and Results - Germany ............................................................................................................. 49

   Emissions .......................................................................................................................................................... 49

   NO2 Compliance at Air Quality Stations in Germany – Totals of all Stations by Scenario ................................ 51

   PM2.5 Compliance at Air Quality Stations in Germany – Totals of all Stations by Scenario .............................. 53

   PM10 Compliance at Air Quality Stations in Germany – Totals of all Stations by Scenario ............................... 54

Appendix E: Data and Results - Munich ................................................................................................................ 55

   NO2 Compliance at Air Quality Stations in Munich – Totals of all Stations by Scenario ................................... 56

   PM2.5 Compliance at Air Quality Stations in Munich – Totals of all Stations by Scenario ................................. 58

   PM10 Compliance at Air Quality Stations in Germany – Totals of all Stations by Scenario ............................... 59

Appendix F: Uncertainty and Validity ................................................................................................................... 60

URBAN AIR QUALITY STUDY: EXTENSION I                                                                                                                                    4
A Comparison of Real Driving Emissions from Euro 6 Diesel Passenger Cars with Zero Emission Vehicles and
their Impact on Urban Air Quality Compliance

INTRODUCTION

This report describes an extension to the Urban Air Quality Study (Aeris Europe, 2016), a study commissioned
by Concawe that explored how urban air quality is affected by the emissions from vehicles and domestic
combustion. In the first report, a focus was placed on the impact of real driving emissions (RDE) on urban
concentrations of nitrogen dioxide (NO2) and particulate matter (PM10 and PM2.5) and the effect this may have
on compliance with ambient air quality limit values at European, national and regional level. This study
focusses on the effect that RDE test compliant Euro 6d diesel passenger cars will have on urban air quality in
major towns and cities within the EU. To achieve this, nearly 2,5001 European air quality monitoring stations
have been modelled and a detailed analysis of air quality compliance and population exposure in 10 European
cities has been performed.

Since the publication of the first report, there continues to be much debate with respect to the impact of NO2
on urban populations, particularly at levels exceeding EU air quality limit values. Although the nature and
severity of health impacts are still being discussed, for example the work currently being undertaken by
COMEAP in the UK (COMEAP, 2015 (a)), (COMEAP, 2015 (b)), (COMEAP, 2017), diesel vehicles have been
singled out as the primary cause of non-compliance with NO2 air quality limit values in the urban environment.

Historically, the modelling of urban air quality has often relied on the assumption that vehicles on the road
perform similarly to the way they do in laboratory test environments, this can lead to an underestimation of
the effect of the vehicle fleet and makes determining the direct contribution of vehicle emissions to
concentrations difficult. The development of reliable portable emission measuring systems (PEMS) has
enabled vehicle emissions to be monitored under real driving conditions and testing of early Euro 6 diesel
passenger cars2 has highlighted the difference in emission levels of nitrogen oxides (NOX) between laboratory
test cycles and real driving conditions. Emissions under real driving conditions were found to be on average, 5
to 7 times the legislated limit value (LLV) required for type approval (Yang, et al., 2015), this was despite those
same cars having achieved type approval and passing laboratory emissions testing.

A requirement of Euro 6 legislation is that manufacturers verify the emissions performance of their vehicles
under a real driving test cycle using PEMS. (2016/427/EC) It is common to express the degree of compliance
with the legislated emissions limit using a conformity factor (CF), which is a simple coefficient of the legislated
limit value of 80mg/km, for example a CF of 1 is equal to the LLV3 while a CF of 2 would be two times the LLV
or 160mg/km.

In 2017, Concawe commissioned Ricardo to gather data from literature as well as their own tests under real
driving conditions to determine the emissions of a range of diesel passenger cars built to comply with Euro 6b,
6c and 6d-temp standards (2007/715/EC). Table 1 shows the results of the Ricardo data for each Euro 6 class
(Ricardo, 2018) expressed as diesel passenger car NOX conformity factors.

1
  Monitoring station data is from Member State submissions to the EEA and must meet data quality
requirements
2
  For example, the testing performed by the Allgemeiner Deutscher Automobil-Club (ADAC) as part of its
EcoTest program (ADAC, 2017)
3
  The Euro 6d RDE Conformity Factor from January 2020 is 1.

URBAN AIR QUALITY STUDY: EXTENSION I                                                                             5

A Comparison of Real Driving Emissions from Euro 6 Diesel Passenger Cars with Zero Emission Vehicles and
their Impact on Urban Air Quality Compliance

Table 1   Conformity factors for diesel passenger cars derived from the Ricardo study – Nitrogen Oxides (NOX)4

                            Euro 6b Pre-2015           Euro 6b Post-2015                 Euro 6c                 Euro 6d (temp)
Minimum NOX                        1.13                         0.20                       0.25                       0.23
Maximum NOX                        17.25                        5.35                       3.65                       1.29
Mean NOX                           6.70                         2.19                       1.43                       0.73
Median NOX                         5.41                         1.90                       1.21                       0.76

This study takes advantage of the NOX emissions from the Ricardo study by using them as inputs to Aeris
Europe’s AQUIReS+ model to explore the impact on compliance and population exposure to nitrogen dioxide
of real driving emissions from diesel passenger cars, now and into the near future. For particulate emissions
(PM2.5 and PM10) there are no conformity factors, but this study does examine the impact of particulate matter
emissions.

The emissions Base Case formulated for the original Urban Air Quality Study (Aeris Europe, 2016) was used as a
starting point for all diesel passenger car scenarios, this is based on the January 2015 Thematic Strategy on Air
Pollution Report #16 (TSAP16) Working Party for the Environment (WPE) Current Legislation Baseline Scenario
(IIASA, 2015a), (IIASA, 2015b) associated with the EU Air Policy Review process (European Commission, 2011)
as generated by IIASA’s GAINS model. The emissions inventory and projections5 considered in the Base Case
are the most up to date European estimates available at the time of writing but do not take into account the
effects of legislation for which the actual impact on future activity levels could not be quantified 6. As a result,
the Base Case should be considered as under-estimating anticipated emissions reductions. The baseline road
transport emissions have been disaggregated using the fleet projections included in the TREMOVE 7 v3.3.2
‘alternative’ scenario (European Commission, 2015) (Fiorello, et al., 2009), and the emission factors of
COPERT8 v4.11. The effective Euro 6 diesel passenger car NOX conformity factor in the Base Case is 2.8, this
corresponds well with the measured Euro 6b (post 2015) mean emissions from the Ricardo study. To produce
road transport emissions for each scenario, the Base Case Euro 6 NOX conformity factors have been modified
to reflect those listed in Table 1.

Whilst the overall methodology of this study is based on that described in the 2016 report, the AQUIReS+
model has been updated to include more air quality stations and additional data from existing EEA stations.
The population exposure capabilities of AQUIReS+ include the exposure methodology described in the paper
“Exceedance of air quality limit values in urban areas” (EEA, 2014 (a)). More details on this technique can be
found in the methodology section of this report.

4
  (Ricardo, 2018) Expectations for Actual Euro 6 Vehicle Emissions. RD18-000697-2
5
  IIASA TSAP Report 16, WPE 2014 CLE for 2030 using the PRIMES 2013 Reference Activity Projection and
COPERT v4.11 emission factors.
6
  For example, the Medium Combustion Plants Directive (MCPD) and the review of the National Emissions
Ceilings Directive (NECD).
7
  TREMOVE v3.3.2 is a mature transport policy assessment model developed for the iTren 2030 project which
covers all inland urban and inter-urban transport modes.
8
  The COPERT 4 methodology is part of the EMEP/EEA Air Pollutant Emission Inventory Guidebook for the
calculation of air pollutant emissions. The emission factors generated are vehicle and country specific.

URBAN AIR QUALITY STUDY: EXTENSION I                                                                                              6
A Comparison of Real Driving Emissions from Euro 6 Diesel Passenger Cars with Zero Emission Vehicles and
their Impact on Urban Air Quality Compliance

AIR QUALITY LIMIT VALUES

Ambient air quality limit values are referred to frequently throughout this study. Rather than describe them
repeatedly, Table 2 lists the limit values of relevance for PM2.5, PM10 and NO2. For those pollutants with more
than one metric, the * indicates the statistically more significant limit, i.e. the metric that will usually be
exceeded first or the “stricter” limit.

Table 2    EU Ambient Air Quality Limit Values

Pollutant                                   Frequency         Value (µg/m3)            Allowed Exceedances

Nitrogen Dioxide (NO2)                 Hourly Exceedance           200                          18
Nitrogen Dioxide (NO2)                   Annual Mean *9             40                           0
Particulate Matter (PM2.5)                 Annual Mean              25                           0
Particulate Matter (PM10)             Daily Exceedance *10          50                          35

Particulate Matter (PM10)                  Annual Mean              40                           0

9
    (de Leeuw & Ruyssenaars, 2011)
10
     (Buijsman, et al., 2005), (Stedman, et al., 2007)

URBAN AIR QUALITY STUDY: EXTENSION I                                                                         7
A Comparison of Real Driving Emissions from Euro 6 Diesel Passenger Cars with Zero Emission Vehicles and
their Impact on Urban Air Quality Compliance
GEOGRAPHIC COVERAGE AND RESOLUTION
Building on the 2016 study, this study extends the focus of urban air quality to every town and city in the EU
with an air quality monitoring station that qualifies for inclusion in the AQUIReS+ model11. In some cases this
means that smaller towns may be represented by a single station, however for larger cities and at national and
EU scale it provides valuable insights. This study has generated results for EU countries individually, the EU-28
as a whole and in detail for the following cities:
• Antwerp
• Berlin
• Bratislava
• Brussels
• London
• Madrid
• Munich
• Paris
• Vienna
• Warsaw
The modelling of air quality management zones (AQMZ) 12 has been omitted in favour of a focus on urban areas
(towns and cities) as this is more representative of the actual exposure of a population than the AQMZ
approach. Using the AQMZ approach as adopted in the 2016 Urban Air Quality Study and elsewhere13, can lead
to a significant over-estimation of population exposure, this is because the whole population of a zone is
considered exposed to non-compliant air quality levels if even a single road junction or air quality monitoring
station is non-compliant. An example of this is given in the results section of this report.
11
AQUIReS+ employs strict eligibility requirements for candidate air quality stations, these include a minimum
number of valid measurements each year (similar to the ambient air quality directive) and measurements must
cover a minimum time-frame. Full details can be found in the original Urban Air Quality Study.
12
Air quality management zones are designated under the ambient air quality directive (2008/50/EC) and
oblige Member States to divide their entire territory into zones. Zones can be regarded as the primary
territorial units for assessment and management of air quality under the air quality directives. There are
approximately 680 AQMZ in the EU, this number varies by pollutant (2008/50/EC, 2008).
13
For example “Modelling PM2.5 impact indicators in Europe: Health effects and legal compliance”
(Kiesewetter, et al., 2015)
URBAN AIR QUALITY STUDY: EXTENSION I 8A Comparison of Real Driving Emissions from Euro 6 Diesel Passenger Cars with Zero Emission Vehicles and
their Impact on Urban Air Quality Compliance
NITROGEN DIOXIDE COMPLIANCE SCENARIOS
The following scenarios were generated using the Ricardo test data in Table 1 to inform the NOX emissions of
Euro 6 diesel passenger cars. All scenarios are based on the original UAQ Base Case detailed in the Urban Air
Quality Study and are used as inputs to AQUIReS+ to model the resultant changes in localised concentrations
of NO2 across Europe. In any scenario where the conformity factor is measured as being less than 1 the
modelling has assumed a conformity factor of 1; this is shown in the relevant descriptions below. This pinning
of the conformity factor to 1, even when testing indicates emissions are below the LLV, is a deliberate decision
and designed to prevent exaggeration of the emissions reductions. It also serves to ensure that the model is
reflecting the minimum effect that full compliance with the legislated emissions limits would have on air
quality.
Figure 1 shows the timeframes for each of the Euro standards explored in this study. The “Type Approval” 14
shading indicates the window for manufacturers to obtain new model type approvals whilst the “New
Vehicles” shading indicates that all applicable vehicles produced during that time must comply with the
corresponding standard. These timeframes have been incorporated into each of the scenarios described
below.
Figure 1 Euro standard and timeframe for new vehicle implementation15
The New European Driving Cycle (NEDC) laboratory test cycle will be replaced with the Worldwide Harmonized
Light Vehicles Test Cycle (WLTC) from September 2017 for Euro 6d (temp) type approvals and for all vehicles
including Euro 6c from September 2018.
The RDE component of the WLTC test procedure is being introduced in three phases:
1. A monitoring period from April 2016 on new vehicle type approvals
2. Euro 6d (temp) type approvals with a conformity factor of 2.1
3. Euro 6d type approvals with a conformity factor of 1 + 0.5 measurement error margin
14
Automotive type approval is the confirmation by an independent body that production samples of a design
meet specified performance standards, including those set forth in EC directives and UN regulations. This
includes testing, certification and production conformity assessment.
15
The Euro 6d Conformity Factor from January 2020 is expressed as 1.5 for simplicity however it is actually 1
with a 0.5 margin of tolerance to allow for measurement uncertainties. The margin is subject to annual review.
URBAN AIR QUALITY STUDY: EXTENSION I 9A Comparison of Real Driving Emissions from Euro 6 Diesel Passenger Cars with Zero Emission Vehicles and
their Impact on Urban Air Quality Compliance
RICARDO MEDIAN SCENARIO
In this scenario (Table 3) every Euro 6 diesel passenger car introduced in a specific year is assumed to conform
to the median of the test results.
Table 3 Scenario – Ricardo Median
Scenario Description Years CF
Euro 6 Diesel PCs registered before 2015 meet the median of the
Pre-2015 5.41
Ricardo test results: Euro 6b Pre-2015
Euro 6 Diesel PCs registered in 2015 and 2016 meet the median of
2015-2016 1.90
the Ricardo test results: Euro 6b Post-2015
Ricardo Median Euro 6 Diesel PCs registered between 2017 and 2019 meet the
2017-2019 1.21
median of the Ricardo test results: Euro 6c
Euro 6 Diesel PCs registered from 2020 onwards meet the median
of the Ricardo test results: Euro 6d temp but with an RDE of 1 2020+ 1
rather than 0.76
RICARDO MEAN SCENARIO
In this scenario (Table 4) every Euro 6 diesel passenger car introduced in a specific year is assumed to conform
to the mean of the test results.
Table 4 Scenario – Ricardo Mean
Scenario Description Years CF
Euro 6 Diesel PCs registered before 2015 meet the mean of the
Pre-2015 6.70
Ricardo test results: Euro 6b Pre-2015
Euro 6 Diesel PCs registered in 2015 and 2016 meet the mean of
2015-2016 2.19
the Ricardo test results: Euro 6b Post-2015
Ricardo Mean Euro 6 Diesel PCs registered between 2017 and 2019 meet the
2017-2019 1.43
mean of the Ricardo test results: Euro 6c
Euro 6 Diesel PCs registered from 2020 onwards meet the mean of
the Ricardo test results: Euro 6d temp but with an RDE of 1 rather 2020+ 1
than 0.73
RICARDO EURO 6D MAXIMUM SCENARIO
This scenario (Table 5) mirrors the Ricardo Median scenario until 2020 from which time every Euro 6 diesel
passenger car registered is assumed to conform to the maximum of the test results.
Table 5 Scenario – Ricardo Euro 6d Maximum
Scenario Description Years CF
Euro 6 Diesel PCs registered before 2015 meet the median of the
Pre-2015 5.41
Ricardo test results: Euro 6b Pre-2015
Euro 6 Diesel PCs registered in 2015 and 2016 meet the median of
2015-2016 1.90
the Ricardo test results: Euro 6b Post-2015
Ricardo E6DMax
Euro 6 Diesel PCs registered between 2017 and 2019 meet the
2017-2019 1.21
median of the Ricardo test results: Euro 6c
Euro 6 Diesel PCs registered from 2020 onwards meet the
2020+ 1.29
maximum of the Ricardo test results: Euro 6d temp
URBAN AIR QUALITY STUDY: EXTENSION I 10A Comparison of Real Driving Emissions from Euro 6 Diesel Passenger Cars with Zero Emission Vehicles and
their Impact on Urban Air Quality Compliance
RICARDO EURO 6D EARLY INTRODUCTION SCENARIO
This scenario (Table 6) mirrors the Ricardo Median scenario until 2018 from which time every Euro 6 diesel
passenger car registered is assumed to conform to the median of the test results.
Table 6 Scenario – Ricardo Euro 6d, Early Introduction
Scenario Description Years CF
Euro 6 Diesel PCs registered before 2015 meet the median of the
Pre-2015 5.41
Ricardo test results: Euro 6b Pre-2015
Euro 6 Diesel PCs registered in 2015 and 2016 meet the median of
2015-2016 1.90
the Ricardo test results: Euro 6b Post-2015
Ricardo E6DEarly Euro 6 Diesel PCs registered in 2017 meet the median of the
2017 1.21
Ricardo test results: Euro 6c
Euro 6 Diesel PCs registered from 2018 onwards meet the median
of the Ricardo test results: Euro 6d temp but with an RDE of 1 2018+ 1
rather than 0.76
ZERO EXHAUST EMISSION PASSENGER CARS FROM 2020 SCENARIO
This scenario (Table 7) mirrors the Ricardo Median scenario until 2020 from which time every Euro 6 diesel
passenger car registered emits zero exhaust emissions; this is the equivalent of replacing all new diesel
passenger car sales with electric vehicles.
Table 7 Scenario – Zero Exhaust Emission Passenger Cars from 2020
Scenario Description Years CF
Euro 6 Diesel PCs registered before 2015 meet the median of the
Pre-2015 5.41
Ricardo test results: Euro 6b Pre-2015
Euro 6 Diesel PCs registered in 2015 and 2016 meet the median of
2015-2016 1.90
the Ricardo test results: Euro 6b Post-2015
ZEV Scenario
Euro 6 Diesel PCs registered between 2017 and 2019 meet the
2017-2019 1.21
median of the Ricardo test results: Euro 6c
All Diesel PCs registered from 2020 onwards are replaced with
2020+ 0
zero exhaust emission vehicles undertaking the same activity.
URBAN AIR QUALITY STUDY: EXTENSION I 11A Comparison of Real Driving Emissions from Euro 6 Diesel Passenger Cars with Zero Emission Vehicles and
their Impact on Urban Air Quality Compliance
PARTICULATE MATTER COMPLIANCE SCENARIOS
Particulate matter is highly distinct from NO2, whereas vehicular NOx is produced solely by combustion
processes within the engine, particulates are emitted as a result of both combustion and mechanical
processes, e.g. brake wear, tyre wear and road abrasion. All modern road vehicles produce very small
quantities of particulates from combustion due to effective particulate filters and other emissions abatement
processes within the engine. Effectively, current diesel combustion engines and electric vehicles produce
similar levels of particulates (Timmers & Achten, 2016).
Particulate matter is also formed by chemical reactions and physical aggregation processes in the atmosphere,
the contribution from these secondary sources and the emissions that lead to their formation is discussed in
the Methodology section.
To help quantify the effect of replacing diesel passenger cars with zero exhaust emission vehicles two
particulate matter scenarios have been considered. The first uses the UAQ Base Case described earlier, the
second models the elimination of all diesel exhaust emissions for new passenger cars registered from 2020.
This is the equivalent of replacing all new diesel passenger car sales with electric vehicles. This scenario is
detailed in Table 8.
Table 8 Particulate matter scenarios
Scenario Description
Base Case UAQ Base Case (See page. 15)
All diesel passenger cars registered from 2020 onwards are replaced with zero exhaust
ZEV Scenario
emission cars undertaking the same activity.
URBAN AIR QUALITY STUDY: EXTENSION I 12A Comparison of Real Driving Emissions from Euro 6 Diesel Passenger Cars with Zero Emission Vehicles and
their Impact on Urban Air Quality Compliance
METHODOLOGY
This study utilises the same tools and methodology as described in the Urban Air Quality Study (Aeris Europe,
2016). Please refer to that document for a more detailed description of the methodology, models and data
sources, in particular Chapter 5 and the AQUIReS+ model. What follows is a brief discussion of enhancements
made to the AQUIReS+ model since the 2016 study and the most relevant background information.
AQUIRES+
AQUIReS+ is a suite of tools developed by Aeris Europe that together provide a modular integrated assessment
model (IAM). AQUIReS+ is able to incorporate a wide-range of exogenous data sources in order to build
emissions profiles16 at country and grid level and relate those emissions to concentrations at individual
measuring stations. An important feature of AQUIReS+ is the ability to account for localised traffic,
environmental and topographical effects at each measuring station across Europe by analysing the
measurement history of specific stations and their proximity to key air quality influences.
NOX AND NO/NO 2 RATIOS
Nitrogen oxide (NOX) is comprised of nitric oxide (NO) and nitrogen dioxide (NO2). NO is considered non-
harmful to health at atmospheric concentrations, however NO can be converted to NO2 once released to the
atmosphere. The rate of this oxidisation and the opposite reactions converting NO2 to NO are subject to many
criteria (Hagenbjörk, et al., 2017) (Kimbrough, et al., 2017) and can have a significant effect on overall NO2
concentrations (Kurtenbach, et al., 2012).
In urban environments, the direct emission of NO2 from road transport has become an important contributor
to NO2 concentrations at roadside locations and the proportion of NO2 in NOX emissions from a diesel vehicle is
significantly higher than the proportion found in the emissions of an equivalent gasoline vehicle (Pastramas, et
al., 2014). NO2 emissions are also influenced by engine size and exhaust after-treatments such as catalytic
converters, as a result, direct NO2 emissions from diesel engines have increased from approximately 5% in
older vehicles to between 12% and 70% dependent on the vehicle (EEA, 2013). This proportion continues to
evolve and analysis of measurement data shows that for a given NO X emission the proportion emitted as direct
NO2 is highly variable (Carslaw, et al., 2016).
The atmospheric chemistry that oxidises NO to NO2, the evolution of vehicle fleets from gasoline to diesel, and
the emission abatement technologies present in a vehicle are all significant factors in determining the
atmospheric NO2 concentration for a given mass of NOX emissions. AQUIReS+ incorporates all of these factors,
on an annualised basis, to produce a NOX to NO2 concentration profile at each modelled location. This is
achieved through a number of techniques including the incorporation of measured NO, NO 2 and NOX
concentrations and an evaluation of region specific vehicle fleet characteristics. Ultimately it allows the model
to account for the factors described above at any given physical location within the geospatial resolution of the
input data.
DATA DISCUSSION AND AVAILABILTY
AQUIReS+ uses measuring station data obtained from the AirBase and e-Reporting systems, both maintained
by the European Environment Agency (EEA). These systems hold air quality measurement data submitted by
every EU Member State and some other European countries. At the time of modelling, the most up to date,
complete, ratified datasets available from the EEA were for 2014, however not every country had submitted
complete data for every year. No other measurement data was included in the modelling performed for this
16
Emission profiles are explained in more detail in the Urban Air Quality Study (Aeris Europe, 2016).
URBAN AIR QUALITY STUDY: EXTENSION I 13A Comparison of Real Driving Emissions from Euro 6 Diesel Passenger Cars with Zero Emission Vehicles and their Impact on Urban Air Quality Compliance study in an attempt to ensure that only ratified, official data was used and that each country is represented using equivalent data. The Air Quality Directive includes guidelines on air quality measurement data required to be submitted for regulatory purposes, including population and areal coverage. Therefore the air quality stations submitted by a country are intended to be representative of the air quality in a given area; hence modelling based on the officially submitted set of stations is likely to be more representative of an area (country or city) as a whole than if additional stations are included. This representativeness is particularly important when comparing countries or cities. This situation can be illustrated using Germany as a representative example, for the 2010 measurement year, 439 stations measuring NO2 were available from the EEA however data available from the Umwelt Bundesamt (Umwelt Bundesamt, 2017) shows measurements available from some 489 NO2 stations. Additionally, not all data recorded at a station is necessarily submitted, for example whilst NO 2 data is widely submitted, NOX data is not submitted to anywhere near the same degree, despite the fact that the same NO 2 stations almost certainly measure NO. The reasons for this are unclear. URBAN AIR QUALITY STUDY: EXTENSION I 14
A Comparison of Real Driving Emissions from Euro 6 Diesel Passenger Cars with Zero Emission Vehicles and
their Impact on Urban Air Quality Compliance

BASE CASE EMISSIONS

The emissions Base Case formulated for the original Urban Air Quality Study (Aeris Europe, 2016) was used as a
starting point for all diesel passenger car scenarios, this is based on the January 2015 Thematic Strategy on Air
Pollution Report #16 (TSAP16) Working Party for the Environment (WPE) Current Legislation Baseline Scenario
(IIASA, 2015a), (IIASA, 2015b) associated with the EU Air Policy Review process (European Commission, 2011)
as generated by IIASA’s GAINS model. The emissions inventory and projections17 considered in the Base Case
are the most up to date European estimates available at the time of writing but do not take into account the
effects of legislation for which the actual impact on future activity levels could not be quantified 18. As a result,
the Base Case should be considered as under-estimating anticipated emissions reductions. The baseline road
transport emissions have been disaggregated using the fleet projections included in the TREMOVE 19 v3.3.2
‘alternative’ scenario (European Commission, 2015) (Fiorello, et al., 2009), and the emission factors of
COPERT20 v4.11. The effective Euro 6 diesel passenger car NOX conformity factor in the Base Case is 2.8, this
corresponds well with the measured Euro 6b (post 2015) mean emissions from the Ricardo study.

EMISSIONS SCENARIOS

Each emission scenario has been generated using conformity factors derived from the real driving emissions
data described in Table 1 and detailed by scenario in Table 3 through to Table 8. The scenarios were produced
in the form of emission attenuation profiles21 that describe the overall shape of a country’s emissions over
time. In the case of nitrogen dioxide the relevant emissions are the oxides of nitrogen (NOX), comprised of NO
and NO2. In the case of particulate matter the emissions of sulphur dioxide (SO2), nitrogen oxides (NOX),
ammonia (NH3) and non-methane volatile organic compounds (NMVOC) in addition to direct particulate
emissions are used. These other emissions are required because a significant, but varying portion of the total
particulate matter (PM) concentration derives from these secondary sources.

The relationship between emissions of PM, SO2, NOX, NH3 and
                                                            Figure 2 PM2.5 source apportionment
NMVOCs and the concentration of particulate matter is                showing primary and secondary split
particularly complex. PM is made up of a primary and a
secondary component illustrated in Figure 6; primary PM is
emitted as particulates at source, any subsequent
                                                                                                         Primary PM2.5
transformation is a result of physical processes e.g.
                                                                                                         concentration
agglomeration. Secondary PM is formed from pre-cursor
emissions undergoing chemical and physical transformations
in the atmosphere. This means that much of the PM measured            Total PM2.5
at an air quality measuring station may have been emitted as a        concentration
different chemical elsewhere; this includes transboundary                                                Secondary PM2.5
sources so the emissions from all countries have to be taken                                             concentration
into account.

17
   IIASA TSAP Report 16, WPE 2014 CLE for 2030 using the PRIMES 2013 Reference Activity Projection and
COPERT v4.11 emission factors.
18
   For example, the Medium Combustion Plants Directive (MCPD) and the review of the National Emissions
Ceilings Directive (NECD).
19
   TREMOVE v3.3.2 is a mature transport policy assessment model developed for the iTren 2030 project which
covers all inland urban and inter-urban transport modes.
20
   The COPERT 4 methodology is part of the EMEP/EEA Air Pollutant Emission Inventory Guidebook for the
calculation of air pollutant emissions. The emission factors generated are vehicle and country specific.
21
   Emission attenuation profiles are explained in more detail in the Urban Air Quality Study (Aeris Europe,
2016).

URBAN AIR QUALITY STUDY: EXTENSION I                                                                              15
A Comparison of Real Driving Emissions from Euro 6 Diesel Passenger Cars with Zero Emission Vehicles and their Impact on Urban Air Quality Compliance The formation of secondary PM and supporting methodology are detailed more thoroughly in the original Urban Air Quality Study. For a background and history of the source-receptor concept used to determine the impact of transboundary emissions please read EMEP Status Report 1/2004 (METNO, 2004). Secondary PM is mostly sized less than 2.5 microns in diameter and can make up a significant portion of PM10 concentrations (typically 60%). Concentrations in air of PM10 are also affected by resuspension of particles as a result of physical action, e.g. wind and road transport activity in streets. URBAN AIR QUALITY STUDY: EXTENSION I 16
A Comparison of Real Driving Emissions from Euro 6 Diesel Passenger Cars with Zero Emission Vehicles and
their Impact on Urban Air Quality Compliance

NITROGEN OXIDES EMISSIONS

Figure 3 shows the Base Case emissions of nitrogen oxides in Germany from all diesel passenger cars split by
Euro standard. These emissions are the same as those used as the Base Case in the original Urban Air Quality
Study. Every country in the study possesses a unique vehicle fleet composition and subsequent emissions
profile; however the evolution of emissions over time is quite similar. Germany has been chosen as a
representative example to illustrate these trends.

Figure 3                                   Diesel passenger car NOX emissions in Germany - Base Case

                                                                        Euro 1       Euro 2      Euro 3   Euro 4                       Euro 5          Euro 6

                             180
                             160
                             140
    NOX Emissions ( kt/yr)

                             120
                             100
                                     80
                                     60
                                     40
                                     20
                                               0
                                                               2010                   2015                2020                                     2025                   2030

Figure 4 shows diesel passenger car emissions in Germany with the Euro 6 diesel passenger car emissions
modified to reflect the Ricardo Median scenario detailed in Table 3. The effect is a reduction in Euro 6 diesel
passenger car emissions from 2015 onwards with a nearly two-thirds reduction by 2030 as a result of

          Figure 4                                      NOX emissions from diesel passenger cars in         Figure 5                       NOX emissions from diesel passenger cars in
                                                        Germany from the Ricardo Median Scenario                                           Germany under the ZEV Scenario

                                                           Euro 1     Euro 2     Euro 3                                                       Euro 1     Euro 2     Euro 3
                                                           Euro 4     Euro 5     Euro 6                                                       Euro 4     Euro 5     Euro 6
                                               180                                                                                   180
                                               160                                                                                   160
                                               140                                                                                   140
                       NOX Emissions (kt/yr)

                                                                                                             NOX Emissions (kt/yr)

                                               120                                                                                   120
                                               100                                                                                   100
                                                   80                                                                                 80
                                                   60                                                                                 60
                                                   40                                                                                 40
                                                   20                                                                                 20
                                                    0                                                                                  0
                                                           2010 2015 2020 2025 2030                                                           2010 2015 2020 2025 2030

URBAN AIR QUALITY STUDY: EXTENSION I                                                                                                                                                     17
A Comparison of Real Driving Emissions from Euro 6 Diesel Passenger Cars with Zero Emission Vehicles and
their Impact on Urban Air Quality Compliance
improved emissions from diesel car technologies. Figure 5 shows the diesel passenger car emissions in
Germany modified to reflect the ZEV scenario in Table 7. This is the equivalent of replacing all new diesel car
registrations with zero emission equivalents, e.g. battery or fuel cell electric vehicles. The residual Euro 6
emissions observed post 2020 are a result of pre 2020 diesel passenger cars still present in the fleet.
Although the emission reductions in the above figures appear significant, it must be remembered that road
transport is not the only source of nitrogen dioxide emissions and diesel passenger cars are just one, albeit an
important component of the overall vehicle fleet. Figure 6 shows the total road transport emissions split by
vehicle category; this shows that from 2015 onwards diesel cars and light-duty trucks make up the largest
single emissions category. The total NOX emissions in Figure 6 are represented by the Road Transport
component in Figure 7 which shows the total emissions of nitrogen oxides in Germany split by key sector.
Figure 6 Total vehicle fleet NOX emissions in Germany split by vehicle category – Base Case
600
500
NOX Emissions (kt/yr)
400
300
200
100
0
2010 2015 2020 2025 2030
Cars and light duty trucks-diesel Cars and light duty trucks-gasoline
Heavy duty vehicles-diesel Motorcycles
Other road transport
From the emissions totals in Figure 7, it can be seen that while emissions from road transport reduce
significantly over time, the emissions from other sectors remain much more constant. This means that the
contribution of non-transport sectors to urban concentrations of NOX and consequently NO2 becomes
proportionally more important; of particular note is residential combustion (e.g. central heating) which, from
2025, contributes well over half the equivalent mass of NOX emissions as road transport.
Non-urban emission sources are represented in most of the other sectors and generally have less effect on
urban NOX concentrations given that they tend to be located away from urban centres, however they may still
contribute to urban background concentrations. The AQUIReS+ model factors the effect of non-urban sources
as well as the varying proportion of NO2 and NO in NOX from different sources. This helps to more accurately
model the effect of newer road transport technologies as well as account for the proximity of each emissions
source.
Much of the change in road transport emissions is a result of a significant reduction in heavy duty vehicle
(HDV) emissions, which in turn are a result of Euro VI emissions regulations delivering successful on the road
NOX emissions reductions. In part this is due to the SCR technology used, but it is also due to the framing of
the legislation. The ICCT published a comprehensive briefing (ICCT, 2016) on the differences between HDV and
light duty vehicle (LDV) real world NOX emissions and they concluded:
URBAN AIR QUALITY STUDY: EXTENSION I 18A Comparison of Real Driving Emissions from Euro 6 Diesel Passenger Cars with Zero Emission Vehicles and
their Impact on Urban Air Quality Compliance
“The best available data shows that the introduction of Euro VI standards significantly reduced real-world NOX
emissions from heavy-duty vehicles. Significant changes between Euro IV/V and Euro VI that likely contributed
to that improvement include:
1. Addition of an off-cycle test during type approval.
2. Improved type-approval test cycle that includes cold start and lower load conditions as well as
transient and high-load conditions.
3. PEMS test for in-service conformity testing, with limited restrictions on the boundary conditions used
during the test and subsequent data processing.”
Figure 7 NOX Emissions in Germany by key sector (IIASA GAINS TSAP16 CLE WPE Scenario) – Base Case
1400
1200
NOX Emissions (kt/yr)
1000
800
600
400
200
0
2010 2015 2020 2025 2030
Road Transport Non-road machinery Residential combustion
Power & heating plants Fuel conversion Industrial combustion
Industrial processes Agriculture Waste
URBAN AIR QUALITY STUDY: EXTENSION I 19A Comparison of Real Driving Emissions from Euro 6 Diesel Passenger Cars with Zero Emission Vehicles and
their Impact on Urban Air Quality Compliance
PARTICULATE MATTER EMISSIONS
Figure 8 shows the PM2.5 emissions of diesel passenger cars by Euro standard over time in Germany, again
Germany has been chosen as a representative example. This is the Base Case as used in the original Urban Air
Quality Study. From 2020 onwards the non-exhaust component becomes dominant; this is primarily composed
of particles from brake wear, tyre wear and road abrasion. As the non-exhaust component is produced
independently of the vehicle powertrain a switch to zero emissions vehicles will not affect this aspect and may
actually increase this number as a function of increased vehicle mass (Timmers & Achten, 2016). No attempt
has been made to modify emissions in the ZEV scenario to take into account vehicle mass.
Figure 8 Primary PM2.5 emissions from diesel passenger cars in Germany - Base Case
Euro 1 Euro 2 Euro 3 Euro 4 Euro 5 Euro 6 Non Exhaust
14
12
PM2.5 Emissions (kt/yr)
10
8
6
4
2
0
2010 2015 2020 2025 2030
Figure 9 shows the PM2.5 emissions in Germany for the portion of the vehicle fleet made up of diesel passenger
cars modified to reflect new diesel passenger car registrations from 2020 being replaced with zero emission
equivalents (the ZEV scenario). It is assumed that vehicle activity remains the same, i.e. the same distance is
driven in each city and driving habits don’t change. By 2020 non-exhaust emissions dominate.
Figure 9 Primary PM2.5 emissions from diesel passenger cars in Germany, replacing all new registrations of PCD with ZEVs from 2020
Euro 1 Euro 2 Euro 3 Euro 4 Euro 5 Euro 6 Non Exhaust
14
12
PM2.5 Emissions (k/yr)
10
8
6
4
2
0
2010 2015 2020 2025 2030
URBAN AIR QUALITY STUDY: EXTENSION I 20A Comparison of Real Driving Emissions from Euro 6 Diesel Passenger Cars with Zero Emission Vehicles and
their Impact on Urban Air Quality Compliance
Road transport is not the only source of particulate emissions and diesel passenger cars are just one
component of the overall vehicle fleet. Figure 10 shows the total road transport emissions split by vehicle
category; this shows that from 2015 onwards the non-exhaust fraction dominates the overall emissions of
particulates. The total PM2.5 emissions in Figure 10 are represented by the Road Transport component in
Figure 11 which shows the total emissions of PM2.5 in Germany split by key sector. From this it can be seen
that the contribution from residential combustion is already an important source of particulates, roughly equal
to that of all traffic in 2010 and becomes the dominant source from 2015.
Figure 10 Total vehicle fleet Primary PM2.5 emissions in Germany split by vehicle category – Base Case
30
25
PM2.5 Emissions (kt/yr)
20
15
10
5
0
2010 2015 2020 2025 2030
Cars and light duty trucks-diesel Cars and light duty trucks-gasoline
Heavy duty vehicles-diesel Motorcycles
Other road transport Non-exhaust
Figure 11 Primary PM2.5 emissions in Germany by key sector (IIASA GAINS TSAP16 CLE WPE Scenario) – Base Case
120
100
PM2.5 Emissions (ky/yr)
80
60
40
20
0
2010 2015 2020 2025 2030
Road transport Non-road machinery Residential combustion
Power & heating plants Fuel conversion Industrial combustion
Industrial processes Fuel production & distribution Agriculture
Waste Nonenergy use of fuels
URBAN AIR QUALITY STUDY: EXTENSION I 21A Comparison of Real Driving Emissions from Euro 6 Diesel Passenger Cars with Zero Emission Vehicles and
their Impact on Urban Air Quality Compliance
MODELLING POPULATION EXPOSURE
AQUIReS+ includes the population exposure methodology described in the paper “Exceedance of air quality
limit values in urban areas” (EEA, 2014 (a)). This methodology is a procedure for assigning a portion of the
urban population to roadside monitoring stations and the remainder to background monitoring stations within
a single contiguous urban area. By determining the compliance state of each station it is then possible to
estimate the portion (if any) of the population exposed to air quality levels exceeding legislated limits.
The proportion assigned to traffic stations is, on average, the 5% of the urban population that lives within 100
metres of a major road (ENTEC, 2006). This percentage varies from country to country and complete details
are available in the EEA report and Appendix A: Urban Population Living Close to Major Roads.
The Urban Audit (UA) data collection (Eurostat, 2014) was used to determine the geographical boundaries of
cities and the population within each city (Eurostat, 2016) for each year. Using this data and air quality
measuring station data available from the European Environment Agency’s AQ E-Reporting System (EEA, 2017)
and the legacy AirBase system (EEA, 2014 (b)) it is possible to geographically allocate measuring stations to
cities across Europe. Only those stations classified as 'urban traffic', 'suburban traffic', 'urban background' or
'suburban background' are used for population exposure as neither ‘industrial’ or ‘rural’ stations are deemed
representative of urban residential areas.
To help ensure robustness of the modelling, all of the eligibility criteria for monitoring stations detailed in the
2016 Urban Air Quality Study are maintained, this includes a minimum of 75% valid measurements per year at
each station as well as at least three years of measurements.
The population represented by each monitoring station is then calculated using these equations from the
“Exceedance of air quality limit values in urban areas” paper, for each year of modelling and pollutant:
Traffic population per station = (( Ptj / 100 ) x Popi / nit )
Background population per station = (( Pbj / 100 ) x Popi / nib )
Where: i = city
j = country
nit = Total number of traffic stations
nib = Total number of background stations
Ptj = Traffic population %
Pbj = Background population %
Popi = Total city population
Note: Ptj + Pbj = 100%
CONCENTRATION AND DISTANCE FROM ROAD
The EEA population exposure model described above (and used in this study) assumes a constant
concentration of each pollutant up to 100 metres from the road when determining the portion of the urban
population exposed to traffic influences. This is not necessarily the case and a discussion related to this
limitation and suggestions for improving this methodology can be found in Appendix B: Concentration and
Distance from Road.
URBAN AIR QUALITY STUDY: EXTENSION I 22A Comparison of Real Driving Emissions from Euro 6 Diesel Passenger Cars with Zero Emission Vehicles and
their Impact on Urban Air Quality Compliance
RESULTS
NITROGEN DIOXIDE
This section highlights the important considerations, findings and trends revealed by this study. For an
explanation of the methodology linking NOX emissions to NO2 concentrations please see the main Urban Air
Quality Study (Aeris Europe, 2016). For the sake of clarity and to avoid repetition, in addition to the Base Case,
only the Ricardo Median scenario and the ZEV scenario are discussed. These have been chosen as they
illustrate the effect that the largest reduction in emissions would have against an average emissions scenario
however the general conclusions are consistent for the other diesel scenarios which were investigated.
Additional results of this and other scenarios are available in the appendices.
COMPLIANCE AT EU LEVEL
By aggregating each Member State’s air quality monitoring stations, an overall picture of compliance across
the EU 28 can be produced. Figure 12 illustrates this EU 28 compliance picture and shows that by 2020 roughly
2% of stations are predicted to be non-compliant with a further 1.5% predicted to be possibly non-compliant.
This is observed in both the Ricardo Median and the ZEV scenario which both exhibit a similar evolution of
compliance over time. The difference in the overall number of stations achieving compliance between the two
scenarios is just above 0% in 2020, less than 0.1% in 2025 and 0.2% in 2030.
This strongly suggests that NO2 non-compliance across the EU 28 is unrelated to Euro 6d diesel passenger cars
given that their substitution with zero emission equivalents has a negligible effect on overall compliance.
Figure 12 NO2 station compliance across the EU 28 for the Ricardo Median and ZEV scenarios
NO₂ Station Compliance in the EU 28
> 45µg/m³ 40-45µg/m³ 35-40µg/m³ < 35µg/m³
100% 2,335
90% 2,102
80% 1,868
Number of Monitoring Stations
70% 1,635
60% 1,401
50% 1,168
40% 934
30% 701
20% 467
10% 234
0% 0
Ricardo ZEV Ricardo ZEV Ricardo ZEV Ricardo ZEV
Median Scenario Median Scenario Median Scenario Median Scenario
2015 2020 2025 2030
URBAN AIR QUALITY STUDY: EXTENSION I 23A Comparison of Real Driving Emissions from Euro 6 Diesel Passenger Cars with Zero Emission Vehicles and
their Impact on Urban Air Quality Compliance
COMPLIANCE AT COUNTRY LEVEL
Compliance at country level has been analysed in two ways; the first is by taking the single highest station in a
given country and noting the compliance situation of that station. This suffers from the same potential
problem as the AQMZ described earlier where over-estimation of population exposure can occur. The second
is to determine how many non-compliant stations there are in a country both in absolute terms and as a
percentage of total stations in that country.
For example, in the case of Belgium22 the chart in Figure 13 shows the highest modelled station concentrations
in each year.
Figure 13 Highest modelled NO2 station in Belgium, by year
Ricardo Median ZEV Scenario AQLV
60
50
Concentration (µg/m3)
40
30
20
10
0
2015 2020 2025 2030
This shows that even the highest predicted concentration in Belgium is below the limit value by 2020, with no
difference between the ZEV scenario and Ricardo Median scenario in compliance terms. Figure 14 presents the
same chart for Germany, this shows that the highest station in Germany never reaches compliance. In this case
knowing the number of non-compliant stations can be informative. This is shown in Figure 15 and indicates
that the residual compliance problem is limited to 5 representative 23 stations in 2025 (~1% of the total number
of NO2 stations in Germany) and that these stations remain non-compliant even in the ZEV scenario.
22
Both Belgium and Germany have been chosen as illustrative examples only.
23
Please see the Methodology section for a brief discussion on stations and the representativeness.
URBAN AIR QUALITY STUDY: EXTENSION I 24A Comparison of Real Driving Emissions from Euro 6 Diesel Passenger Cars with Zero Emission Vehicles and
their Impact on Urban Air Quality Compliance
Figure 14 Highest modelled NO2 station in Germany, by year
Ricardo Median ZEV Scenario AQLV
100
90
80
Concentration (µg/m3)
70
60
50
40
30
20
10
0
2015 2020 2025 2030
Figure 15 Number of non-compliant NO2 stations in Germany by year – total modelled stations: 330
Ricardo Median ZEV Scenario
40
35
Number of Non-Compliant Stations
30
25
20
15
10
5
0
2015 2020 2025 2030
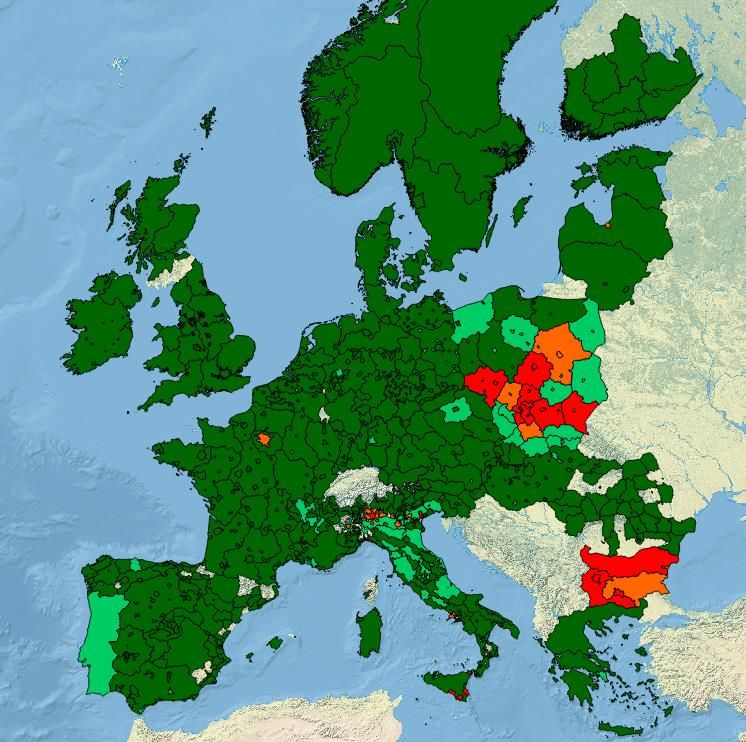
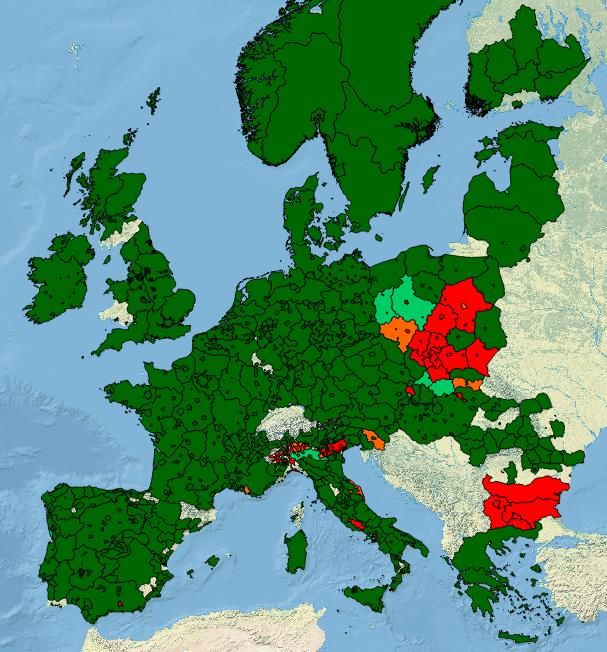
With the knowledge that there are only 5 out of over 300 representative stations in Germany that fail to
achieve compliance in 2025 an idea of the geographical distribution of the stations is useful, this is illustrated
in Figure 16 where the compliance hot-spots are highlighted in red. This shows that by 2025, non-compliance
is largely limited to traffic stations in Stuttgart and Freiburg. This suggests that a localised targeting of the
issues in those areas might be needed to resolve the residual non-compliance.
URBAN AIR QUALITY STUDY: EXTENSION I 25You can also read