Report - Energy Modelling Initiative
←
→
Page content transcription
If your browser does not render page correctly, please read the page content below
EMRG Ene rg y a nd M a t e ria ls Re se a rc h Gro up
 8888 University Drive
 Burnaby, BC, V5A 1S6
 P (778) 782-6621
 F (778) 782-4968
 Internet: www.emrg.sfu.ca

 Report

 Interactions of policies acting at the
 local, sub-national, and national scales
 for Canada’s energy transition

 December 1, 2019

 Prepared for:
 Energy Modelling Initiative

 Prepared by:
 Rose Murphy, Aaron Pardy, and Thomas Budd
 Energy and Materials Research Group
 School of Resource and Environmental Management
 Simon Fraser University

 Contact:
 Rose Murphy
 remurphy@sfu.ca

EMRG Ene rg y a nd

The authors acknowledge the Pacific Institute for Climate Solutions for financial support
of our urban modelling efforts under its Built Environment project [grant number
36170-50280].

 ii

EMRG Ene rg y a nd

Table of contents
Table of contents ................................................................................................................iii
1. Introduction .................................................................................................................... 1
2. The model: CIMS-Urban.................................................................................................. 3
 2.1. The CIMS energy-economy model........................................................................... 3
 2.2. Urban land-use and infrastructure model ............................................................... 5
3. Policy scenarios tested .................................................................................................. 11
 3.1. Municipal policy portfolios .................................................................................... 12
 3.2. Senior government policy portfolios ..................................................................... 13
 3.3. Combining policy portfolios into scenarios ........................................................... 14
4. The modelling results .................................................................................................... 16
 4.1. Policy interactions across sectors for Vancouver .................................................. 16
 4.2. Policy interactions in the personal transportation sector ..................................... 17
 4.3. Analysis of specific actions within personal transportation .................................. 18
5. Conclusions ................................................................................................................... 22
References ........................................................................................................................ 23
Appendix A: CIMS-Urban in the modelling ecosystem ..................................................... 26
 A.1. Current and past studies ....................................................................................... 26
 A.2. Possible future studies .......................................................................................... 27
 A.3. Possible synergies with other models ................................................................... 27

 iii
EMRG Ene rg y a nd

1. Introduction
Canada’s energy transition is expected to involve policies that act at the local level, as
well as at the sub-national and national levels. Until recently, energy and climate policy
around the world was primarily the responsibility of sub-national and national
governments, and there was a tendency to discount the potential of policies acting at
the local scale. However, a growing number of cities have set ambitious mid-century
targets for reduced greenhouse gas (GHG) emissions and/or increased reliance on
renewable energy, bringing more attention to these policies. In Canada, major cities that
have announced such targets include Toronto, Vancouver, Victoria, and Regina. More
than 200 municipalities across the county have developed Community Energy Plans
(Quest Canada, 2013).
There are a number of specific ways in which cities, alone or in partnership with other
levels of government, can contribute to the electrification challenge. These fall into the
two general categories of personal transportation and buildings. With respect to
personal transportation, cities can get involved in the expansion of recharging
infrastructure to facilitate the adoption of electric vehicles. Cities can also have a role in
developing road pricing and/or parking charges that either favor electric vehicles or
discourage personal vehicle use overall. It is certainly important that cities participate in
the transition of municipally-owned bus fleets and commuter trains to zero-emissions
energy sources. A switch from fossil fuel transportation to electric transportation can
then be supported by expanding infrastructure for public transit, as well as for walking
and cycling. Finally, cities are ideally positioned to influence urban form in ways that
may reduce travel demand and increase the attractiveness of mode shifting away from
the personal vehicle. Through their jurisdictional powers in the areas of zoning,
development permitting, and property taxation, cities can seek to increase population
density and encourage mixed-use development, possibly in coordination with mobility
infrastructure. When it comes to buildings, cities may have a role in revising building
codes in order to improve the energy efficiency of the building stock and promote a
switch from fossil fuels to electricity for space and water heating.
Because of the emerging importance of policies acting at the local scale, planning for
Canada’s transition to a Clean Electric Future requires enhanced modelling capabilities.
Sophisticated energy-economy models are available for analysing the impacts on energy
use and GHG emissions from one or a portfolio of policies. However, as these models
were designed mainly to account for policies with impact at the global, national, or sub-
national levels, they are not always capable of integrating policies at the local level. In
particular, existing energy-economy models tend to lack a spatial dimension, making it
difficult to address many of the actions targeted by such policies. For example, a policy

 1
EMRG Ene rg y a nd

that seeks to increase the convenience of public transportation by building a dedicated
rail line or providing a frequent rapid bus service will not do so uniformly across the city,
but will instead cause a greater increase in convenience for those living and/or working
near the new route. Models at the city scale do exist; however, these policy assessment
tools are not as advanced in some ways as their counterparts at the sub-national and
national levels (Keirstead et al., 2012).
In particular, models used to simulate decisions around energy use by households and
firms must take into account factors in addition to the observed costs of the different
options (see Allcott and Greenstone, 2012; Jaffe and Stavins, 1994; Sutherland, 1991).
An electric vehicle has an up-front cost, on-going electricity and maintenance costs, and
(eventually) a cost associated with battery replacement. However, in deciding between
a conventional vehicle and an electric one, consumers attach value to other attributes,
such as range, availability of charging stations, perceptions of others, and how
established the technology is. Likewise, public transit users must pay a fare but are also
influenced by considerations of trip time, convenience, status, and comfort.
Analytical tools are needed that can not only address local scale policies to advance
electrification but also take into account the interactions of related policies acting at the
sub-national and national scales. When policy interactions exist, it is not as simple as
adding the impacts from separate modelling efforts. Policies can overlap in terms of the
actions they cause, leading to a less than additive effect. It is also possible for one action
to reduce the potential for another action. For example, a shift to clean electricity for
heating our homes and buildings would reduce the GHG impact of building shell energy
efficiency improvements. On the other hand, policies can complement each other by
causing different actions. It is even possible for policies implemented together to result
in a more than additive effect. Investment in electric rapid transit infrastructure could
interact in this way with policies that encourage compact development around the rapid
transit stations.
We have developed an urban spatial model of energy use and GHG emissions that: 1)
captures unobserved values that have an influence on the energy decisions of
households and firms, and 2) is capable of simulating the interactive effects of policies
at different scales. We achieved these two objectives by integrating our longstanding
energy-economy model, called CIMS, with an urban land use and infrastructure model
to create the CIMS-Urban model. We are aware of no other urban spatial model
operating in Canada that has these capabilities. In the following sections, we describe
our Energy Modelling Initiative project, in which we apply CIMS-Urban to test how
policies acting at different levels of government can interact to affect urban energy use
and GHG emissions in the City of Vancouver.

 2
EMRG Ene rg y a nd

2. The model: CIMS-Urban
We have developed a spatially explicit version of the CIMS energy-economy model,
called CIMS-Urban, by integrating an urban-scale CIMS model with a GIS model. CIMS-
Urban can simulate the interaction of policies acting at the local scale with policies
acting at the sub-national and national scales, and it can do so in a way that realistically
represents human behavior. Here, we describe the original CIMS energy-economy
model and the urban land use/infrastructure GIS model that together form CIMS-Urban.
A Vancouver version of CIMS-Urban is well developed and has been used to test the
potential for the city to achieve ambitious renewable energy and GHG emissions
reduction targets (Jaccard et al., 2019). We are currently extending this model to all of
Metro Vancouver, so as to be able to simulate multi-city commuting behavior. The next
applications to major metropolitan areas will be for Toronto and Montreal. CIMS has
recently been used to model energy and emissions in Victoria and Nanaimo (BC). We are
investigating ways to apply our urban modelling tools across cities of different sizes.
2.1. The CIMS energy-economy model
CIMS was developed in the context of sub-national and national energy and climate
policy simulation. The model has been used extensively to assess the effectiveness and
costs of such policies, both in an academic context, and for clients including
governments, industry associations, and non-governmental organizations. It is the
subject of numerous academic articles, including those by Jaccard (2009) and by Murphy
and Jaccard (2011), which describe the model in detail.
CIMS is unique in that it represents the acquisition, use, and retirement of energy-
related technologies in a way that takes into account values that, while not directly
observed, have a significant influence on human decisions. CIMS is technologically
explicit, tracking the turnover of the capital stock, namely infrastructure, buildings,
industrial plants and equipment, electricity generation and other energy supply
equipment, vehicles and other transport equipment, and appliances and other
household durable goods. In simulating the decisions of households and firms, the
model considers not only the market costs of the different options but also their
unobserved costs and benefits. This allows for a more realistic simulation of human
behavior. The behavioral parameters within the CIMS are empirically estimated from a
combination of market research into past technology choices (revealed preferences)
and discrete choice surveys of possible future technology choices (stated preferences)
(Rivers and Jaccard, 2006).
CIMS simulates the turnover of infrastructure, buildings, factories, and equipment over
time through retirements, retrofits, and new acquisitions. In each 5-year period, a
portion of the existing capital stocks are retired according to an age-dependent
function, although accelerated retirement and retrofit are possible if warranted by

 3
EMRG Ene rg y a nd
economic conditions. As new capital stocks are required, technologies compete for
market share based on an algorithm that is applied at several levels of decision-making.
For example, at one level there is competition among different private vehicle
technologies, which is nested inside a higher-level competition between modes of
transport, the mode options being private vehicles, public transit, cycling, and walking.
The CIMS technology competition algorithm is given in Equation 1. MSj is the market
share of the new capital stock captured by technology j, CCj is its capital cost, nj is its
average lifespan, MCj is its annual maintenance and operation cost, and ECj is its annual
energy cost, which depends on energy prices and energy consumption. The costs of
technology j are compared to those of all other technologies (K) available to provide the
energy service in question (e.g. heated indoor floor space, person-kilometers travelled).
−
[ ∗ − + + + ]
1−(1+ )
=
(1)
∑ −
=1{[ ∗1−(1+ )− + + + ] }
In addition to these standard financial costs, the market share algorithm includes three
behavioral parameters, each of which characterizes a different aspect of firm and
household decision-making. Thus, there is a time preference parameter (r) representing
the trade-off between present and future costs for the technologies in the competition
(e.g., higher upfront cost versus lower operating cost), a parameter (v) that denotes the
heterogeneity of decision-makers, and an (annual) intangible cost parameter (i) that can
vary by technology. An example of this last parameter is the intangible cost value for
public transit in the personal mobility mode share competition, which is based on
revealed and stated preference research showing that a significant share of consumers
attach an intangible, non-financial cost to public transportation that reflects their
perceptions of its lower convenience, status, and comfort relative to the private vehicle.
The original source for data on industrial technologies in CIMS was the Industrial Sector
Technology Use Model (ISTUM) developed by the U.S. Department of Energy (1983).
These data were significantly updated at Simon Fraser University in the mid to late
1990s to create the Intra-Sectoral Technology Use Model (also called ISTUM) (Nyboer,
1997). There are various additional sources for the current CIMS technology database,
including public statistical agencies, energy utilities, literature reviews, industry
associations, equipment manufacturers, and surveys of sector experts. Because there is
a lack of detailed information on annual energy consumption of the individual capital
stocks tracked by the model (especially smaller units), these must be estimated from
surveys at different levels of technological detail and by calibrating the model's
simulated energy consumption to real-world aggregate data. The behavioural
parameters in CIMS (v, i, and r) are estimated from stated and revealed preference data
(Axsen et al., 2009; Horne et al., 2005; Jaccard and Dennis, 2006; Rivers and Jaccard,
2005; Washbrook et al., 2006).
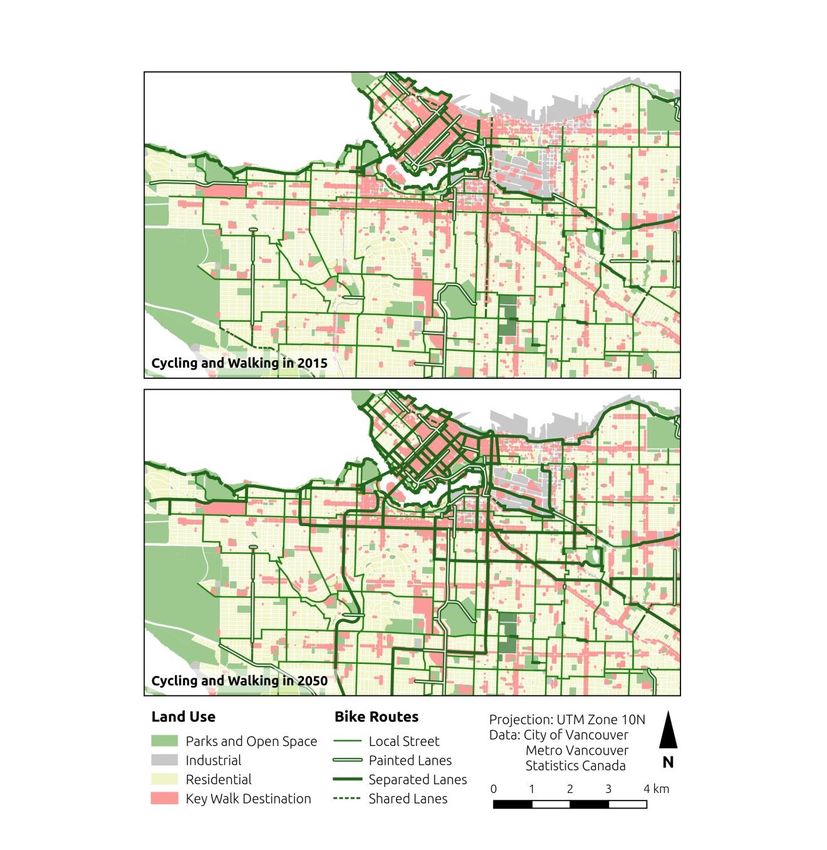
4EMRG Ene rg y a nd CIMS also includes two functions for simulating endogenous change in the real and perceived characteristics of technologies that are new to the market: a declining capital cost function and a declining intangible cost function. These functions are especially important for modelling policies that pursue technological transformation of the energy system over the next few decades. The declining capital cost function (Equation 2) links a technology’s capital cost in future periods to cumulative production, reflecting economies-of-scale and economies-of-learning that lower capital costs. In the equation, CC(t) is the capital cost of a technology at time t, N(t) is the cumulative production of that technology at time t, and PR is the progress ratio, defined as the percentage reduction in cost associated with a doubling of cumulative production. ( ) 2 ( ) ( ) = (0) [ (0)] (2) The declining intangible cost function links a technology’s intangible cost in a given period with its market share in the previous period. This ‘neighbor effect’ reflects how consumer perceptions of risk decline as a new technology gains market share (Mau et al., 2008). Intangible costs for technologies decline according to Equation 3, where i(t) is the intangible cost of a technology at time t, MSt–1 is the market share of that technology at time t – 1, and A and k are estimated parameters reflecting the rate of decline of the intangible cost in response to increases in the market share of the technology. (0) ( ) = 1+ ∗ −1 (3) 2.2. Urban land-use and infrastructure model The GIS component of CIMS-Urban tracks changes in land use (increased density, mixed- use development) and the development of energy distribution and mobility infrastructure. An example of such evolution of urban form within the model is provided in Figure 1, which compares the land use pattern and cycling network in Vancouver in 2015 with a projection for 2050 under its Renewable City Strategy. As one can see, in 2050 there are more thick lines indicating high-quality cycling routes and more of the pink urban areas indicating high walkability. These changes, in turn, affect the intangible cost values in the CIMS personal mobility mode share competition and total travel demand in the form of person-kilometers travelled. Thus, a mixed-use, higher density development can decrease the distance of many residents to a commercial area, thereby reducing overall travel demand and lowering the intangible cost in CIMS of the personal mobility choice of walking for some types of mobility needs. 5
EMRG Ene rg y a nd

Figure 1: Vancouver’s land use pattern and cycling network in 2015 and in 2050 under
its Renewable City Strategy
Travel demand in CIMS-Urban is determined by a person-kilometers travelled (pkt)
algorithm (Equation 4), which measures future changes in population and land-use.
Baseline year per-person pkt values are exogenously sourced from data and
transformed into estimated future pkts by way of calculated index values that replicate
percent changes in travel demand over time. Travel demand is calculated on small
locational scale, specifically the 992 Dissemination Areas (DA) for Vancouver according
to Statistics Canada (2011a). The algorithm calculates a pkt index value for a specific DA
and time period (PKT Indext,DA) by summing the distances (dDA,k) between the DA and

 6
EMRG Ene rg y a nd

closest commercial and institutional districts (k). The calculated index values are then
multiplied by the DA’s local population (p) to account for the impacts of population
density and growth. City-wide per capita index values representing change in travel
demand are extrapolated by averaging all DA-specific indexes in Vancouver and dividing
by total population at every simulation year. The per-person pkt index values for each
simulation year are normalized relative to the baseline year, thereby permitting all
changes in mobility to be reported as a city-wide percent change in per capita travel
demand. The normalized per-person pkt index values are multiplied by the exogenously
derived baseline year per-person pkt estimate to produce aggregated per capita travel
demand values for Vancouver. The aggregated per capita pkts are multiplied by the
corresponding total population in Vancouver for every simulation year to produce travel
demand values that are entered into the CIMS personal transportation sector market
share algorithms to allocate specific mode shares.
 , = ∑ =1 ( , ) × (4)
We assume that the intangible cost of a given personal mobility mode at a particular
location is a function of that mode’s network quality at the location and a constant
value for each mode, which we refer to as its ‘network quality coefficient.’ A relatively
high network quality value decreases the intangible cost, whereas a relatively low
network quality value increases it. To estimate the intangible cost under policy
conditions, we must first solve for the network quality coefficient under baseline
conditions by estimating the baseline intangible cost and the baseline network quality.
Then, we can calculate the network quality under policy conditions and apply the
network quality coefficient to solve for the policy intangible cost. Estimates of network
quality are generated by mode for neighborhoods across the city, based on ‘network
quality equations’ within the GIS model. These network quality values change over time
depending on policies that affect land use and transportation infrastructure in different
areas.
From the CIMS market share algorithm, it is possible to estimate the intangible cost
associated with a mode of transportation, given assumed values for the other
behavioral parameters and known mode shares and financial costs. However, it is not
possible to solve the algorithm algebraically for the intangible cost of a single
technology or mode, which therefore must be solved analytically. We used the Nelder
and Mead optimization technique (Nelder and Mead, 1965) in R (R Core Team, 2016) to
solve for a baseline intangible cost value for each personal mobility mode in each of
Vancouver’s 22 planning neighborhoods The intangible cost of driving a private vehicle
was assumed to be zero under baseline conditions.
CIMS-Urban evaluates transportation network quality separately in four categories: road
network quality (for private vehicle users), walking network quality, cycling network
quality, and public transit network quality. Road network quality (Qr) is calculated on the

 7
EMRG Ene rg y a nd

neighborhood scale according to Vancouver’s 22 neighborhoods, as in Equation 5. Each
road segment (RS) in a given neighborhood is assessed in terms of its length (l) and
assigned a quality value (q) based on the road type. From highest to lowest value, road
types are: freeway, arterial, collector, local, lane/strata, and trail/restricted/other. The
product of q and l is taken, and the result averaged across all the road segments. This
average is then divided by the product of the neighborhood’s population density (pd)
and its estimated pkt index value (pkt), as a proxy for how changes in local population
and travel demand may affect road congestion.
 ∑
 1 ×
 = ⁄( × ) (5)

Walking, cycling, and public transit quality are calculated on a finer locational scale – the
992 DAs in Vancouver – because individuals who walk or cycle are somewhat more
sensitive to distance than those who drive. We excluded DAs located within the
downtown Vancouver central business district as the small number of residents in this
high traffic area could bias results.
Almost all roads in Vancouver have safe sidewalks to accommodate pedestrians;
therefore, we assumed that walking path quality is the same everywhere and that the
distance to commercial and employment areas from a DA is the key factor in
determining walk network quality. We used a logistic decay function to describe how
distance initially would have a relatively small impact on walk quality, but would grow in
importance once individuals had to walk more than just a few minutes. Walking network
quality (Qw) is estimated at the DA level using Equation 6, in which a calculation is
carried out for each walk destination (WD) in the city, and the results are then summed
across all of the destinations. Here, dmin describes the shortest possible distance
between any point on the DA boundary and the walk destination. The parameters for
the walk quality and public transit quality equations (see Equation 8 below for transit
quality) were developed empirically to produce results reflective of how far the average
person will generally walk to a destination. For example, most people are likely willing to
walk about 5 minutes to a bus and 10 minutes to a store, other business, or rapid
transit.
 1
 = ∑
 1 ln (19) (6)
 × −200
 1+ 200

Cycling network quality for a given DA (Qc) is derived according to Equation 7. The
calculation is done for each cycling route (CR) in the city, and the results are summed
across all of the routes. Here, dmin is the shortest possible distance between any point
on the DA boundary and any point on the cycling route, dmax is the furthest possible
distance (straight-line) from the dmin point on the route to any point on the DA, l is the
length of the route, and q is a quality value based on the route type (highest for
separated lanes or paved paths, lowest for shared lanes). Because distances for the
cycling calculation are to linear features, we used a simple inverse distance relationship

 8
EMRG Ene rg y a nd

instead of logistic decay, as this method resulted in less abrupt changes in cycling quality
among adjacent DAs.
 1
 = ∑
 1 × × 2 (7)
 0.5×( + )

Public transit network quality (Qt) is estimated at the DA level as the sum of two
components (Equation 8), each of which resembles the walk quality equation. The first
component represents ‘regular’ transit stops (RegTS) and the second represents ‘rapid’
transit stations (RapidTS). Rapid routes are defined as not only fast and high frequency,
but also on a dedicated right-of-way, meaning they are not subject to traffic delays. In
the equation, dmin is the shortest possible distance between any point on the DA
boundary and the stop or station, dmax is the furthest possible distance, and f refers to
the frequency of service at the stop or station. Frequency is weighted highly in the
calculations to reflect the importance of high frequency public transit service to
customers’ feelings of autonomy and satisfaction. People are generally willing to walk
further to rapid transit than to a regular bus line; therefore, the contribution a bus stop
makes to service quality declines more quickly with distance than the contribution from
a rapid transit station.
 =
 1 1
∑
 1 ln (19) × + ∑
 1 ln (19) × (8)
 ×0.5×( + ) ×0.5×( + )
 1+ 200 1+ 400

Baseline transportation quality calculations were conducted within the GIS model using
current road network, land-use, cycling route, and public transit network data for
Vancouver. For the GIS calculations, we used PostGIS 2.1 in a PostgreSQL 9.4 database
(The PostGIS Development Group, 2015). The GIS database software configuration is
similar to what has been used in previous research mapping and modelling urban GHG
emissions and it is flexible enough to be expanded to larger applications (Gkatzoflias et
al., 2013).
The first step in calculating a distinct network quality coefficient for each personal
mobility mode was to take the average of the baseline network quality estimates across
all of the DAs within each of the 22 neighborhood zones. We then used the least-
squares method to fit a trend-line to the baseline network quality and intangible cost
data for each mode. In the case of the public transit mode, we ‘log transformed’ quality
data to improve fit. Log transforming helped normalize the data that was otherwise
dominated by a few areas of very high transit service quality, such as around transit
hubs. Because there is substantial uncertainty around the relationship between network
quality and intangible cost, we ran some sensitivity tests using different values for the
network quality coefficients and found that, while extreme differences in the
coefficients could lead to detectable differences in mode share, the likely differences in
energy use and emissions for Vancouver overall were negligible.

 9
EMRG Ene rg y a nd

The network quality algorithms and their coefficients allowed us to estimate new
intangible costs based on policies that modify Vancouver’s transportation network, land
use, and built environment. First, we calculated policy network quality estimates for the
duration of our simulation period, which extends from 2015 to 2050, by representing
transportation and zoning changes within the GIS. Then, as in deriving the network
quality coefficients, we averaged these network quality estimates at the neighborhood
zone level. Next, we applied the mode-specific network quality coefficients to obtain a
per-person intangible cost for each travel mode/neighborhood zone combination, over
the simulation period. Finally, we multiplied each calculated intangible cost by its
corresponding neighborhood population before summing the resulting value across all
neighborhoods and dividing by Vancouver’s total estimated population to produce a
city-wide per-person intangible cost estimate for each mode choice. The mode-specific
intangible costs, weighted by population, were incorporated into the CIMS technology
competition algorithm to help determine changes to transportation mode share over
the simulation period.
There were significant input data requirements associated with building the version of
CIMS-Urban used in this study, both to update key CIMS parameters from model
defaults (averages for the province of British Columbia) and to populate the spatial
component. The data sources we used are given in Jaccard et al., 2019.

 10
EMRG Ene rg y a nd

3. Policy scenarios tested
We tested a series of policy scenarios in CIMS-Urban. These scenarios were designed to
assess the extent to which policies operating at the urban scale in Vancouver, such as
investments in public transit infrastructure and changes in land use, can be used to
supplement carbon pricing and the other complementary policies in order to achieve
GHG emissions reduction. In designing the policy scenarios, we took into account the
existing Pan-Canadian Framework and other federal and provincial initiatives, as well as
possible new policies. We considered a range of senior government policies that are
expected to vary in terms of their interactions with municipal policies and constructed
scenarios that probe these interactions.
In order to describe the policy scenarios tested and interpret the modelling results that
follow, it is important to distinguish between actions and policies. Actions are changes
that cause GHG emissions reductions. Two key actions are improving the efficiency with
which we use energy and switching to low- or zero-emissions energy forms. Policies are
efforts by public authorities to cause actions. A wide range of policy options are
available, including carbon pricing, regulatory instruments, subsidies to individuals or to
firms, information programs, and government procurement programs. Local, sub-
national, and national governments vary in terms of their jurisdictional authority to
implement policy. Municipal governments tend to control land use through zoning,
some aspects of the built environment through codes, and some aspects of urban
mobility. Senior levels of government, on the other hand, tend to have greater taxation
and regulatory authority over technologies and fuels.
The scenarios we tested include two categories of government policies: 1) policies
whose main impacts on energy and GHG emissions are due to changes in urban-scale
spatial relationships and 2) other policies. The spatial policies tend to fall within the
jurisdiction of municipal governments. Therefore, we refer to these policies as
“municipal policies” in the headings below. The non-spatial policies tend to fall within
the jurisdiction of sub-national or national governments. Therefore, we refer to these
policies as “senior government policies” below.
For the most part, building codes do not influence energy and GHG emissions through
changes in spatial relationships. Therefore, we categorize building codes as senior
government policies. Within Canada, jurisdiction over building codes actually varies by
province. In BC and Quebec, for example, municipalities hold considerable control over
the building code regulations they follow, whereas in other jurisdictions, such as
Ontario, local governments do not have such powers. The zero-emissions building policy
we simulate is, in fact, based on the Zero Emissions Building Plan of the City of
Vancouver; however, we include it in a senior government policy portfolio because it is a

 11
EMRG Ene rg y a nd

non-spatial policy that could require senior government support in a number of
jurisdictions.
3.1. Municipal policy portfolios
Due to geographic constraints, Vancouver cannot expand in physical size and therefore
we assumed that growth in all scenarios would be through increasing density.
Population growth in CIMS-Urban was based on forecast data for Vancouver provided
by BC Stats Sub-Provincial Population Projections (BC Stats, 2017).
Vancouver reference portfolio: This portfolio includes a number of policies of the City
of Vancouver’s municipal government, at their announced design and stringency levels
as of 2016. Among these are the policies that were in place at that time to promote
electric and zero-emissions vehicles. In our simulation of this portfolio, public transit
service levels and cycling routes are maintained with population growth, but not
substantially improved. Land-use policy dictating the location of commercial,
institutional, and mixed-use districts remains unchanged. Population growth in the
reference portfolio is simulated to take place in the lowest density areas in the city
mostly representing conversions of single detached housing neighborhoods to contain
more duplexes and triplexes. The map at the top left of Figure 2 illustrates resulting
population densities in 2050, with the lower map providing baseline population
densities in 2010 for comparison.
Renewable City Strategy portfolio: In 2015, Vancouver launched its Renewable City
Strategy (City of Vancouver, 2015b). Our simulation of this policy portfolio includes
transportation network improvements, mixed-use pedestrian-oriented developments
along major public transit routes, and more high-density development nodes centered
on rapid transit stations. Road network changes, cycling improvements, and new public
transit infrastructure investments to 2050 are hypothetical, but those simulated are
consistent with the Renewable City Strategy, Vancouver’s Transportation 2040 Plan (City
of Vancouver, 2012), and the regional transit authority’s 10-year plan (Mayors’ Council
on Regional Transportation, 2014). Population growth to 2050 in the Renewable City
Strategy portfolio is simulated to proportionately increase across Vancouver to reflect a
balanced density policy. Population increases concentrate along major transit corridors
and hubs as transportation infrastructure is improved and some modest growth occurs
in single detached housing neighborhoods, as illustrated by the map at the top right of
Figure 2.

 12
EMRG Ene rg y a nd

Figure 2: Population density scenarios used for the Vancouver reference and
Renewable City Strategy portfolios
3.2. Senior government policy portfolios
The policies included in the senior government reference portfolio, as described below,
are maintained for all of the other senior government portfolios that follow, except in
the case of the building code. The reference case version of the building code is altered
in the zero-emissions building portfolio. The carbon price portfolios and the zero-
emissions vehicle portfolio add the named policies to the reference portfolio.

 13
EMRG Ene rg y a nd

Senior government reference portfolio: This portfolio includes the following policies:
the BC Low Carbon Fuel Standard, announced federal and provincial zero-emissions
vehicle subsidies, current federal vehicle emissions standards on light-, medium-, and
heavy-duty vehicles, and current federal minimum energy performance standards for
appliances. We modelled the BC Low Carbon Fuel Standard as a biofuel blending
requirement of 10% ethanol in gasoline and 10% biodiesel in diesel fuel by 2020. The
building code in this scenario is that which existed in 2016 for commercial and
residential buildings.
Current carbon price portfolio: Here, we add the British Columbia carbon tax to the
senior government reference portfolio. The carbon price increases in line with the
federal government carbon price backstop to $50/tonne CO2 by 2022, where it remains
in real terms until 2050. Funds collected through carbon pricing are assumed to go into
senior government general revenues.
Paris carbon price portfolio: The senior government reference portfolio is assumed to
be complemented by either a stronger carbon price or by an approach in which one or
more flexible regulations approximate the economic incentives that would have been
created by that carbon price. The latter approach is described by Jaccard et al. (2016),
who find that the carbon price would have to rise to $200/tonne CO2 in 2030, in order
for Canada to meet its commitment under the Paris Accord. We adopt their $200 carbon
price trajectory, assuming that, after 2030, the carbon price stays constant to 2050.
Zero-emissions vehicle portfolio: To this portfolio, we add the BC Zero-Emission
Vehicles Act requiring that all new light-duty cars and trucks sold in the province be
clean energy vehicles by 2040. We adopt the government’s phased-in schedule of 10%
new light-duty vehicle sales by 2025, 30% by 2030, and 100% by 2040.
Zero-emissions building portfolio: This portfolio includes the Zero Emissions Building
Plan (City of Vancouver, 2016) that applies to both residential and commercial buildings.
The plan stipulates energy efficiency improvements to the building code and, by 2030,
that all new buildings must have zero-emissions space and water heating systems. In
contrast, because Vancouver has not yet implemented significant policy to cause the
conversion of existing buildings to zero-emissions standards, we kept the policies for
existing buildings the same in this portfolio as in the reference portfolio.
3.3. Combining policy portfolios into scenarios
To investigate interactions between municipal policies and senior government policies,
we tested all combinations of the policy portfolios described above, as shown in the
matrix in Table 1. The municipal policy portfolios are listed in the first row, and the
senior government policy portfolios are listed in the first column. The names of the
resulting policy scenarios are given in the cells of the Table. The second row of the table
combines the senior government reference portfolio with the Vancouver reference
portfolio and the Renewable City Strategy portfolio. The middle column of the table

 14
EMRG Ene rg y a nd

combines the Vancouver reference portfolio with each of the different senior
government portfolios. The scenarios described so far include the reference scenario
and those that test the separate impacts of the municipal policy and senior government
policy portfolios. The scenarios in the other cells (last column, third row and below) test
the combined impacts of these portfolios.
Table 1: Policy scenario matrix

 Vancouver reference Renewable City Strategy
 Senior government Reference RCS + SGRef
 reference
 Current carbon price VanRef + $50 RCS + $50
 Paris carbon price VanRef + $200 RCS + $200
 Zero-emissions vehicle VanRef + ZEV RCS + ZEV
 Zero-emissions building VanRef + ZEB RCS + ZEB

 15
EMRG Ene rg y a nd

4. The modelling results
The nature of the policy interactions that occur when a municipal and a senior
government portfolio are combined can be investigated in CIMS-Urban by comparing
the GHG emissions reduction (relative to the reference case) when the two portfolios
are simulated together with the sum of the reductions from each of the portfolios when
simulated separately. In general, we expect the result when the portfolios are simulated
together to be less than the sum of the separate portfolios because two policies may
cause the same action and because an action resulting from one policy may reduce the
impact of an action resulting from another policy.
4.1. Policy interactions across sectors for Vancouver
Taking into account emissions reductions from the transportation, buildings, and
manufacturing sectors in Vancouver, we find that the result when the portfolios are
simulated together is indeed less than the sum of the separate portfolios, generally
speaking. However, the reduction from the portfolios together is almost as large (or
equal to) the sum of the separate reductions for each of the combinations, as illustrated
in Figure 3. This indicates that losses in emissions reduction due to policy interaction are
quite small.
In Figure 3, the dark grey portions of the columns represent the emissions reductions
from the senior government policy portfolio that is indicated on the horizontal axis,
when this portfolio is simulated separately in CIMS-Urban. The light grey portions
represent the reduction from the Renewable City Strategy portfolio when simulated
separately (this portion is the same height across all the columns). The full heights of the
columns indicate the sum of emissions reductions from the senior government portfolio
and the Renewable City Strategy portfolio. The black bars represent the reductions from
the combination of the senior government portfolio and the Renewable City Strategy
portfolio, when simulated together. These bars are at or relatively chose to the full
height of the column in every case. The labels associated with the black bars express (as
a percent) the ratio of the emissions reduction achieved when the policy portfolios are
simulated together to the sum of the separate reductions.
According to our results, the role of municipal policy may shift based on the magnitude
of the policy effort by senior government. The emissions reduction from the Renewable
City Strategy portfolio, when simulated separately, is similar in magnitude to the
reductions from the current carbon price, zero-emissions vehicle, and zero-emissions
building portfolios, when these are simulated separately. However, under the Paris
carbon price portfolio, the model indicates a much larger reduction. Therefore, although
the loss in emissions reduction due to policy interaction between the Renewable City
Strategy portfolio and the Paris carbon price portfolio is only 8%, its magnitude is almost
as large as the reduction from the Renewable City Strategy portfolio alone.

 16
EMRG Ene rg y a nd

 1 400
 92%
 1 200
 GHG reduction (kt CO2e)

 1 000

 800 Renewable City
 Senior government
 600
 Simulated together
 91% 100%
 400
 86%
 200

 0
 $50 $200 ZEV ZEB

Figure 3: Interactions between municipal and senior government policies across
sectors, as revealed by GHG emissions reductions in 2050
$50 = Current carbon price; $200 = Paris carbon price; ZEV = zero-emissions vehicle; ZEB
= zero-emissions building
4.2. Policy interactions in the personal transportation sector
Changes to urban form are believed to impact GHG emissions mostly through changes in
personal transportation demand and mode choice, and these are the only actions that
such changes influence in the version of CIMS-Urban used in this study. Therefore, all of
the interactions between municipal and senior government policy in the current
modelling exercise actually occur within the personal transportation sector. There is no
policy interaction between the Renewable City Strategy portfolio and the zero-emissions
building portfolio because the urban form changes caused by the Renewable City
Strategy impact only personal transportation and not residential or commercial
buildings in this version of CIMS-Urban. Taking into account only personal
transportation for Vancouver, the emissions reduction from the portfolios simulated
together is generally smaller than the sum of the separate reductions, indicating a
greater degree of policy interaction (Figure 4).
Looking only at personal transportation, the emissions reduction from the Renewable
City Strategy portfolio, when simulated separately, is generally larger, relative to the
reductions from the senior government policy portfolios, than is the case across all
sectors. Again, however, when the Renewable City Strategy portfolio is simulated
together with the Paris carbon price portfolio, the loss of emissions reduction due to
policy interaction is almost as large as the reduction from the Renewable City Strategy
portfolio alone.

 17
EMRG Ene rg y a nd

 450

 400

 350
 GHG reduction (kt CO2e)

 72%
 300
 84%
 250 Renewable City
 84% Senior government
 200
 100% Simulated together
 150

 100

 50

 0
 $50 $200 ZEV ZEB

Figure 4: Interactions between municipal and senior government policies in the
personal transportation sector, as revealed by GHG emissions reductions in 2050
$50 = Current carbon price; $200 = Paris carbon price; ZEV = zero-emissions vehicle; ZEB
= zero-emissions building
4.3. Analysis of specific actions within personal transportation
We can learn more about the policy interactions that are occurring within the personal
transportation sector of CIMS-Urban when municipal and senior government policy
portfolios are simulated together by investigating the actions that occur when the
portfolios are simulated separately. The categories of actions we consider here are:
travel demand reduction, shifts in travel mode choice, changes in the energy sources
used by personal vehicles, and changes in the energy sources used by public transit
vehicles.
In the version of CIMS-Urban that we used for this project, we assumed that the only
way to reduce personal transportation demand is by altering the spatial relationships
between people and the locations they need to access, such as work, school, and other
services. Therefore, only the Renewable City Strategy portfolio influences travel demand
in our simulations. Figure 5 shows the evolution of personal transportation demand to
the year 2050 under the reference and Renewable City Strategy scenarios.

 18
EMRG Ene rg y a nd

Figure 5: Evolution of personal transportation demand
pkt = person-kilometers travelled
The mode of travel people choose in 2050 is influenced most strongly by the Renewable
City Strategy in our simulations, with minimal shifts in travel mode under the senior
government policy scenarios, generally speaking (Figure 6). Slightly more of a shift does
occur under the zero-emissions vehicle scenario, likely due to the increased up-front
costs of personal vehicles. The results suggest that preferences for travel modes are
difficult to overcome, and that a more effective way to achieve a shift may be through
changes to urban form that influence these preferences directly. Our modelling
indicates that municipal policies and senior government policies are unlikely to have a
strong interaction in terms of both causing significant mode shifts.
Personal vehicles consume different energy sources based on their motor types. As
expected, the Renewable City Strategy does not have a significant influence on vehicle
motor shares in our simulation. The senior government carbon pricing and zero-
emissions vehicle scenarios, on the other hand, do cause a strong shift towards zero-
emissions vehicles in Vancouver (Figure 7). Again here, the indication is that municipal
policies and senior government policies are unlikely to have a strong interaction due to
both causing the same action.

 19
EMRG Ene rg y a nd

Figure 6: Percentage point change in mode share relative to the reference scenario for
the year 2050

Figure 7: Percentage point change in personal vehicle motor shares relative to the
reference scenario for the year 2050

 20
EMRG Ene rg y a nd

The Renewable City Strategy results in a strong shift from diesel and electric hybrid
buses to hydrogen buses in our simulation by 2050, due to the requirement that all
public transit be zero-emissions. The senior government carbon price scenarios also
influence the bus stock, with electric hybrid buses replacing diesel buses (Figure 8).
Here, it appears there may be some interaction between the municipal portfolio and the
senior government portfolios, with both causing a shift away from diesel buses.

Figure 8: Percentage point change in bus shares (based on motor type) relative to the
reference scenario for the year 2050
Note: While electric trolley buses are an important component of Vancouver’s bus fleet
and are expected to continue to be in the future, their contribution was not found to
vary across the scenarios; therefore, they are not shown in this figure.
Our action-by-action analysis of the personal transportation modelling results for
Vancouver suggests that, for the most part, municipal policy influencing urban form
does not cause the same actions as the senior government policies we tested. However,
a shift to zero-emissions vehicles under senior government policy can reduce the
emissions reduction impact of key actions under municipal policy – namely travel
demand reduction and a shift away from personal vehicles towards other modes. This is
because if vehicles do not emit GHG emissions, it is not possible to reduce those
emissions by reducing travel demand or switching modes. Because of this policy
interaction, the emissions reduction in personal transportation from the municipal and
senior government portfolios simulated together (Figure 4) is not as large as the sum of
the separate reductions.

 21
EMRG Ene rg y a nd

5. Conclusions
We have added an urban spatial dimension to an established energy-economy model,
so as to be able to simulate the interactions between policies acting at the local, sub-
national, and national levels in support of Canada’s energy transition. We applied this
model to a series of scenarios designed to explore how policies acting on these different
scales can interact to affect urban energy use and GHG emissions. Our analysis suggests
that municipal policy influencing urban form does not cause the same actions as the
senior government policies we tested. In particular, municipal policy has the potential to
be more effective that senior government policy in promoting a reduction in the overall
demand for personal transportation and a shift away from using personal vehicles to
meet that demand. However, a shift to zero-emissions vehicles under senior
government policy can reduce the impact of these actions on emissions. Therefore, if
stringent zero-emissions vehicle mandates are implemented, the other benefits of
changes to urban form, such as reduced costs of the energy transition, improvements in
social equity, and enhanced livability may become more important.

 22
EMRG Ene rg y a nd

References
Allcott, H., Greenstone, M., 2012. Is there an energy efficiency gap? Journal of Economic
 Perspectives 26(1), 3–28. https://doi.org/10.1257/jep.26.1.3.
Axsen, J., Mountain, D., Jaccard, M., 2009. Combining stated and revealed choice
 research to simulate the neighbor effect: the case of hybrid-electric vehicles.
 Resource and Energy Economics 31, 221–238.
 https://doi.org/10.1016/j.reseneeco.2009.02.001.
BC Stats, 2017. Sub-Provincial Population Projections: Vancouver School District.
 http://www.bcstats.gov.bc.ca/apps/PopulationProjections.aspx.
City of Vancouver, 2012. Transportation 2040.
 https://vancouver.ca/files/cov/Transportation_2040_Plan_as_adopted_by_Coun
 cil.pdf.
City of Vancouver, 2015. Renewable City Strategy.
 http://vancouver.ca/files/cov/renewable-city-strategy-booklet-2015.pdf.
City of Vancouver, 2016. Zero Emissions Building Plan.
 http://council.vancouver.ca/20160712/documents/rr2.pdf.
Gkatzoflias, D., Mellios, G., Samaras, Z., 2013. Development of a web GIS application for
 emissions inventory spatial allocation based on open source software tools.
 Computers & Geosciences 52, 21–33.
 https://doi.org/10.1016/j.cageo.2012.10.011.
Horne, M., Jaccard, M., Tiedemann, K., 2005. Improving behavioral realism in hybrid
 energy-economy models using discrete choice studies of personal transportation
 decisions. Energy Economics 27, 59–77.
 https://doi.org/10.1016/j.eneco.2004.11.003.
Jaccard, M., 2009. Combining top-down and bottom-up in energy-economy models, in:
 Evans, J., Hunt, L.C. (Eds.), International Handbook on the Economics of Energy.
 Edward Elgar, Cheltenham, UK, pp. 311–331.
 http://www.sfu.ca/content/dam/sfu/emrg/Publications/Research_Publications/J
 accard_2009.pdf.
Jaccard, M., Dennis, M., 2006. Estimating home energy decision parameters for a hybrid
 energy—economy policy model. Environmental Modeling & Assessment 11, 91–
 100. https://doi.org/10.1007/s10666-005-9036-0.
Jaccard, M., Hein, M., Vass, T., 2016. Is Win-Win Possible? Can Canada’s Government
 Achieve Its Paris Commitment … and Get Re-Elected? School of Resource and
 Environmental Management, Simon Fraser University. http://rem-

 23
EMRG Ene rg y a nd

 main.rem.sfu.ca/papers/jaccard/Jaccard-Hein-Vass%20CdnClimatePol%20EMRG-
 REM-SFU%20Sep%2020%202016.pdf.
Jaccard, M., Murphy, R., Zuehlke, B., Braglewicz, M., 2019. Cities and greenhouse gas
 reduction: policy makers or policy takers? Energy Policy 134, 110875.
 https://doi.org/10.1016/j.enpol.2019.07.011.
Jaffe, A.B., Stavins, R.N., 1994. The energy-efficiency gap: what does it mean? Energy
 Policy 22(10), 804–810. https://doi.org/10.1016/0301-4215(94)90138-4.
Keirstead, J., Jennings, M., Sivakumar, A., 2012. A review of urban energy system
 models: approaches, challenges and opportunities. Renewable and Sustainable
 Energy Reviews 16(6), 3847–3866. https://doi.org/10.1016/j.rser.2012.02.047.
Mau, P., Eyzaguirre, J., Jaccard, M., Collins-Dodd, C., Tiedemann, K., 2008. The neighbor
 effect: simulating dynamics in consumer preferences for new vehicle
 technologies. Ecological Economics 68, 504–516.
 https://doi.org/10.1016/j.ecolecon.2008.05.007.
Mayors’ Council on Regional Transportation, 2014. Regional Transportation
 Investments: A Vision for Metro Vancouver. https://www.translink.ca/-
 /media/Documents/about_translink/governance_and_board/council_minutes_a
 nd_reports/2014/june/Regional_Transportation_Investments_a_Vision_for_Met
 ro_Vancouver.pdf.
Murphy, R., Jaccard, M., 2011. Energy efficiency and the cost of GHG abatement: a
 comparison of bottom-up and hybrid models for the US. Energy Policy 39, 7146–
 7155. https://doi.org/10.1016/j.enpol.2011.08.033.
Nelder, J.A., Mead, R., 1965. A simplex method for function minimization. The Computer
 Journal 7, 308–313. https://doi.org/10.1093/comjnl/7.4.308.
Nyboer, J., 1997. Simulating Evolution of Technology: An Aid to Energy Policy Analysis.
 Simon Fraser University PhD thesis, Vancouver, BC.
 http://summit.sfu.ca/item/7467.
Quest Canada, 2013. Advancing Integrated Community Energy Planning in Ontario: A
 Primer. Toronto, ON. https://questcanada.org/advancing-integrated-community-
 energy-planning-in-ontario-a-primer/.
R Core Team, 2016. R: A Language and Environment for Statistical Computing. R
 Foundation for Statistical Computing, Vienna, Austria. https://www.r-
 project.org/.
Rivers, N., Jaccard, M., 2006. Useful models for simulating policies to induce
 technological change. Energy Policy 34, 2038–2047.
 https://doi.org/10.1016/j.enpol.2005.02.003.

 24
EMRG Ene rg y a nd

Statistics Canada, 2011. Dissemination Area Boundary Files (92-169-X).
 https://www12.statcan.gc.ca/census-recensement/2016/geo/index-eng.cfm.
Sutherland, R.J., 1991. Market barriers to energy-efficiency investments. The Energy
 Journal 12(3), 15–34. https://doi.org/10.5547/ISSN0195-6574-EJ-Vol12-No3-3.
The PostGIS Development Group, 2015. PostGIS. Victoria, B.C. http://postgis.net/.
U.S. Department of Energy, 1983. Industrial Energy Productivity Project – Final Report.
 Report prepared by Energy and Environmental Analysis, Inc.
Washbrook, K., Haider, W., Jaccard, M., 2006. Estimating commuter mode choice: a
 discrete choice analysis of the impact of road pricing and parking charges.
 Transportation 33, 621–639. https://doi-org.proxy.lib.sfu.ca/10.1007/s11116-
 005-5711-x.

 25
EMRG Ene rg y a nd

Appendix A: CIMS-Urban in the modelling ecosystem
A.1. Current and past studies
CIMS has been used extensively to assess the effectiveness and costs of policies to
reduce greenhouse gas emissions, both in an academic context, and for clients including
governments, industry associations, and non-governmental organizations. Beginning in
1999, CIMS was one of the four main models employed by the Canadian government in
the national consultation process to meet Canada's international greenhouse gas
emissions reduction commitments (e.g. Energy Research Group / M.K. Jaccard and
Associates, 2000; M.K. Jaccard and Associates, 2003; M.K. Jaccard and Associates, 2007).
CIMS has also been represented at the Energy Modeling Forum (EMF) at Stanford
University (e.g. Murphy and Jaccard, 2011).
Energy Research Group / M.K. Jaccard and Associates, 2000. Integration of GHG
 Emission Reduction Options using CIMS. Prepared for the Analysis and
 Modelling Group of the Climate Change National Implementation Process.
M.K. Jaccard and Associates, 2003. Construction and Analysis of Sectoral, Regional and
 National Cost Curves of GHG Abatement in Canada (Part IV: Final Analysis
 Report). Prepared for the Office of Energy Efficiency, Natural Resources Canada.
M.K. Jaccard and Associates, 2007. Cost Curves for Greenhouse Gas Emission Reduction
 in Canada: The Kyoto Period and Beyond (Final Analysis Report, Enhanced
 Costing Indicators). Prepared for the Office of Energy Efficiency, Natural
 Resources Canada.
Murphy, R., Jaccard, M., 2011. Modeling efficiency standards and a carbon tax:
 simulations for the U.S. using a hybrid approach. The Energy Journal 32(SI), 43–
 60.
 http://www.emrg.sfu.ca/media/publications/Murphy&Jaccard_EMF_US_Policy_
 Simulations_EnJournal_2011.pdf
Development of CIMS-Urban began in approximately 2015. In a 2017 public report
(Zuehlke at al., 2017) and 2019 academic article (Jaccard et al., 2019), the model was
used to assess the potential of cities to achieve deep reductions in GHG emissions
through a shift to renewable energy, based on a case study of Vancouver. The authors
found that, while cities like Vancouver have some important options for reducing energy
use by their inhabitants, they may lack the authority to completely transform the energy
system. To achieve such ambitious energy and GHG targets, cities with jurisdictional
powers comparable to those of Vancouver are dependent to some degree on
complementary GHG and energy policies from senior levels of government.
Zuehlke, B., Jaccard, M., Murphy, R., 2017. Can Cities Really Make a Difference? Case
 Study of Vancouver’s Renewable City Strategy. Energy and Materials Research

 26
You can also read