REPORT GERMANY MARKET - INDUSTRIAL AND LOGISTICS MARKETS OVERVIEW - COLLIERS INTERNATIONAL
←
→
Page content transcription
If your browser does not render page correctly, please read the page content below
GERMANY

MARKET
REPORT
INDUSTRIAL  AND LOGISTICS MARKETS
OVERVIEW

2019 / 2020
NO LAND IN SIGHT
                          Fueled by ongoing high demand on the           Suitable land sites for new-build con-
                          German commercial real estate invest-          struction are a rare find in Germany’s
                          ment market and the low interest rate en-      core markets and are likely to remain
                          vironment, industrial and logistics assets     scarce going forward.
                          continued to perform very well in 2019,
                          once again ranking as the third strongest      As a result, developers are looking to snap
                          asset class in Germany after office and        up sites as quickly as possible and turning
                          retail. Investors poured a total of €6.6bn     to speculative development and renova-
                          into German industrial and logistics as-       tion of stock industrial sites. Companies
Peter Kunz FRICS          sets over the course year. Although this       and property developers are also becom-
HEAD OF INDUSTRIAL        marks a yoy decrease, the drop can be          ing more flexible when it comes to their
& LOGISTICS EMEA          contributed to the current scarcity of         search criteria, which puts other logistics
peter.kunz@colliers.com   product. Foreign investors again showed        regions where supply is more extensive
                          their enthusiasm for German logistics as-      and affordable in the running.
                          sets, generating roughly 60% of annual
                          transaction volume. The largest logistics      Demand for logistics assets will remain
                          deal of the year, the Maximus portfolio, in-   high thanks the continued stability of the
                          volved a foreign investor. Singapore’s         German economy and ongoing e-com-
                          sovereign wealth fund (GIC) acquired the       merce boom. With land and construction
                          28-asset pan-European portfolio at the         costs on the rise, property developers will
                          end of the year. German investors contin-      need to secure suitable land at an early
                          ued to target their investment at light in-    stage in order to fill their project pipeline.
                          dustrial properties in 2019, with the asset    The smaller logistics regions around Ger-
                          class accounting for about one third of        many’s secondary and tertiary cities in
                          their total transaction volume.                the greater vicinity of the country’s major
                                                                         logistics regions will also benefit from the
                          Despite the fact that investment activity      current market situation and see growing
                          remains high, we are still seeing a short-     demand going forward.
                          age of first-rate core assets. With land
                          hard to come by in Germany’s 8 major in-
                          dustrial and logistics markets, new-build
                          development activity is likely to remain
                          subdued, putting a cap on additional sup-
                          ply. This trend was particularly evident in
                          2019 take-up results, which were down
                          18% yoy in the country’s top 8 regions.
                          Berlin (+12%), Munich (+13%) and Leipzig
                          (+1%) were the only markets to post yoy
                          increases in take-up. Other markets such
                          as Hamburg (– 31%), Düsseldorf (– 31%)
                          and Stuttgart (– 43%) experienced steep
                          drops due to a lack of large-scale leases.
3

CONTENTS

                                                 Industrial  and Logistics Markets Overview | Colliers International
                                                 CONTENTS | 2019 / 2020
           Logistics in Germany             4

           Logistics Regions in Germany     5

           Market Data                      6

           Leasing Market

             Germany                        8

             Berlin / Brandenburg          11

             Düsseldorf                    14

             Frankfurt/Rhine-Main          17

             Hamburg                       20

             Cologne                       23

             Leipzig                       26

             Munich                        29

             Stuttgart                     32

           Investment                      35

           Glossary                        38

           Contacts /Locations             39
4
Industrial and Logistics Markets Overview | Colliers International
Logistics in Germany | 2019 / 2020
LOGISTICS IN GERMANY
Germany is one of the most attractive demand for logistics space. As a result,
logistics markets worldwide thanks to its developers and tenants are being forced
central location in Europe, excellent to turn to the peripheral areas surround-
infrastructure, high technological stand- ing major conurbations.
ards and excellent building quality. Logis-
tics is Germany’s third-largest economic Germany’s ongoing economic growth and
sector after the automotive industry high consumer activity will continue to
and retail. The market recorded roughly boost demand for suitable logistics space.
€279bn in transaction volume in 2019. Investors remain under considerable
Logistics properties have also become pressure to invest and are showing in-
the third strongest-performing asset creasing interest in logistics assets in the
class on the German real estate invest- current low interest rate environment.
ment market. The logistics sector The smaller logistics regions will benefit
employs just over 3 million people but, from shortage of space combined with
despite favorable performance, still fac- rising land and construction costs in the
es significant challenges. country’s top markets going forward as
they enjoy comparatively moderate price
Limited supply and a lack of skilled work- levels and offer more opportunities for
ers are putting the brakes on the sector’s company expansion.
growth. Companies on the lookout for
space are increasingly taking the availa-
bility of labor and local business tax
policies into consideration in their deci-
sions. Megatrends like e-commerce and
same-day delivery are boosting demand
for suitable core products in conurba-
tions. Despite the fact that new-build
construction activity is on the rise, it will
not be enough to meet the anticipated
LOGISTICS REGIONS IN GERMANY 5
Industrial and Logistics Markets Overview | Colliers International
Logistics regions in Germany | 2019 / 2020
23 21
Rostock
20
19
Hamburg
Bremerhaven
6.30
28
Bremen 4.95
24
39 300
11
4.70 27
3.60
Berlin
60
Hanover Wolfsburg
1 6.10
Braunschweig
4.70 30 2
5.10 5.10
5.50 31 Osnabrück Magdeburg 13
4.15 4.20 220
4.30 Münster 395
43 100 95 14
110 15
33
Dortmund
Duisburg
38 Leipzig
Mönchen- 52 Düsseldorf Kassel / Bad Hersfeld
gladbach 4.60
Dresden
5.75
4.50 Erfurt 3.70 72
4.50
Cologne 4.75
49
45 3.70 4
80
17
4.30
6.50
3.60 5.80 220
75
Gießen485 5.40
3.10
Zwickau
80 4.50
60 Prime rent in € / sqm/month
4.20 330
180
71 ∅ rent in €/sqm/month
66 9
60
48
5.40 3.50 Frankfurt 73
Land price in €/sqm
4.50 75 70
Trier Aschaffenburg D E F I N I T IO N
160 67 Würzburg
3 93 Prime headline rents for logistics
63
Mannheim Nuremberg
and distribution space:
> 3.000 sqm Class-A properties
( > 10 m under beam height, 2–3 docking
Saarbrücken 62
65 5.00
gates/1.000 sqm, sprinkler system, share
6 of office space < 10 %) in a prime location
Regensburg
4.35 Karlsruhe 4.50 Average rents for logistics
7 and distribution space:
3.30 230
5.70 8
Stuttgart > 3.000 sqm with multifunctional usage
92 ( > 7 m under beam height, 1–2 docking
85
4.80
Ingolstadt gates / 1.000 sqm, limited share of office
6.50 space) in a traffic-favorable location
200 Ulm / Neu-Ulm
81
5.20 Land price:
94 Undeveloped commercial/industrial areas,
4.75
5 300 Munich ( > 20.000 sqm, mainly flat and rectangular,
no / limited usage restrictions)
3.90
7.15 Status January 2020
130 95
96 6.70
Airport
Augsburg 400
Freight transport centre
5.70
Harbour
4.50
125
6
Industrial  and Logistics Markets Overview | Colliers International
                                    Market Data | 2019 / 2020
                                                                      MARKET DATA

                                                                      Location Information
                                                                                                                    Germany       Berlin      Düsseldorf       Frankfurt    Hamburg     Cologne    Leipzig   Munich     Stuttgart

                                                                      Population in 1.000                              83,019     3,645                619          753         1,841     1,086       588     1,472          635

                                                                      Employees Paying Social Security                 33,407      1,528               424          602          996       583        273       897          426
                                                                      Contributions in 1.000

                                                                      Unemployment Rate in %                               4.9        7.6              6.5           4.9         5.9        7.4        6.1      3.4           3.9

                                                                      Per Capita Disposable Income in €               24,000 22,220              28,742           27,138      25,720    25,806     21,545    30,478       27,314

                                                                      Sources: Federal Statistical Office, Land Statistical Offices, Federal Employment Agency, Nexiga GmbH

                                                                      Industrial & Logistics Leasing
                                                                                                                   TOP 8         Berlin / Düsseldorf Frankfurt / Hamburg                Cologne    Leipzig    Munich Stuttgart
                                                                                                                            Brandenburg              Rhine-Main

                                                                      Take-up 2019 in sqm                     2,429,900           474,900         217,900         467,200     332,500    192,300 346,700     227,000     171,400

                                                                      Change year-on-year in %                     – 18%               12%             – 31%        – 28%       – 31%     – 22%        1%        13%      – 43%

                                                                      Leasing performance 2019 in sqm          1,931,600          451,800          117,100        414,400     268,300    181,000 166,000 202,500        130,500

                                                                      Change year-on-year in %                     – 24%              40%          – 60%            – 26%       – 32%     – 23%     – 40%         1%      – 49%

                                                                      Forecast for 2020

                                                                      Number of Deals                                620                151              70            72          70        47         32        95          83

                                                                      Average Area Size in sqm                     4,730             3,145             3,112        6,580       4,750      3,738    11,005     2,389        3,117

                                                                      Strongest Branch

                                                                      Prime Rent in € / sqm / month                                    6.10             5.75         6.50        6.30       5.80      4.60       7.15       6.50

                                                                      Forecast for 2020

                                                                      Average Rent in € / sqm / month                                  5.10             4.75         5.40        5.00       4.50      3.70      6.70        5.20

                                                                      Forecast for 2020

                                                                          Trade          Production & Manufacturing            Transport & Logistics
7
Industrial and Logistics Markets Overview | Colliers International
Market Data | 2019 / 2020
Industrial & Logistics Investment – TOP 8*
TOP 8 Berlin Düsseldorf Frankfurt Hamburg Cologne Leipzig Munich Stuttgart
Transaction Volume 2019 in m € 2,518 414 413 493 267 129 190 493 119
Change year-on-year in % 1% – 36% 0% – 2% 6% – 37% 692% 114% – 45%
Forecast for 2020
* Refers to the defined logistics market areas
Industrial & Logistics Investment – Germany
2014 2015 2016 2017 2018 2019
Transaction Volume 2019 in m € 3,592 3,972 4,579 8,662 6,814 6,566
Change year-on-year in % 57 11 15 89 – 21 –4
Industrial Properties Share in % 27 32 31 12 42 28
Logistics Properties Share in % 73 68 69 88 58 72
Share in the Commercial 9 7 9 15 11 9
Real Estate Market in %
Share by International Investors in % 62 53 38 65 47 60
Portfolio Transactions in % 50 47 40 71 56 40
Largest Buyer Group in % Open-ended Opportunity Asset Open-ended Asset Asset
real estate funds / managers / real estate managers / managers /
funds / Private Fund funds / Fund Fund
Special funds equity funds managers Special funds managers managers
33 22 30 33 45 40
Largest Seller Group in % Property Property Property Asset Property Asset
developers developers developers managers / developers managers /
Fund managers Fund managers
31 20 26 46 30 26
Gross Initial Yield in % for 6.40 5.97 5.50 4.65 4.50 4.20
Class-A properties
8
LEASING MARKET GERMANY
Take-up Deals of similar scale were absent in Ger-
many’s other logistics hubs. More leases
Leasing Market Germany | 2019 / 2020
Industrial and Logistics Markets Overview | Colliers International
Just over 2.4 million sqm was let to tenants
were recorded in 2019 than in the previous
or built/purchased by owner-occupiers in
year, however (620 in total, +9%), reflect-
Germany’s 8 largest logistics hubs in 2019.
ing the fact that demand for industrial and
That reflects a yoy drop of roughly 18% for
logistics space remains high. Smaller units
the overall market. If we exclude owner-
of under 3,000 sqm were even more
occupier activity, which puts results at
popular than in the previous year. The
1.9 million sqm, take-up was down 24%
year’s largest-scale leases were signed by
yoy. Results, however, varied from region
online furniture retailer Wayfair for
to region. The Düsseldorf (– 31%), Rhine-
90,500 sqm in Lich in the northern Rhine-
Main (– 28%), Hamburg (– 31%), Cologne
Main area, Amazon for 31,000 sqm in
(– 22%) and Stuttgart (– 43%) regions
Schönefeld south of Berlin and automotive
posted steep drops in take-up with consid-
group BMW for around 32,000 sqm in
erably less availability while Berlin (+12%),
Vaterstetten (Munich).
Munich (+13%) and Leipzig (+1%) contin-
ued to experience ongoing momentum
thanks to a number of major leases signed.
FAST FACTS TOP 8
2019 2018 Change
Take-up in sqm 2,429,900 2,968,200 – 18%
Leasing Performance in sqm 1,931,600 2,544,900 – 24%
Owner-Occupiers in % 21% 14% – 18%
Number of Deals 620 571 9%
Average Area Size in sqm 4,730 4,862 – 3%
Figure 1: Take-up in 1,000 sqm Figure 2: Take-up by Size Category in %
500 up to 500 0%
452
414 501–1,000 4%
400 1,001–3,000 16%
300 268
3,001–5,000 14%
202
200 181 181
166
130 5,001–10,000 23%
117
101
100 above 10,000 43%
53 64
41
23 25
11
0
Berlin Frankfurt Cologne Munich
Düsseldorf Hamburg Leipzig Stuttgart
Leasing Performance Owner-Occupiers
9
Supply and Demand Rents
Industrial and Logistics Markets Overview | Colliers International
Leasing Market Germany | 2019 / 2020
Although demand for industrial and logis- With a few exceptions, prime and average
tics properties remains high, the scarcity rents in top locations continued to climb
of development sites and rising land pric- due to low supply and ongoing high
es, particularly in the large-scale segment demand. Prime rents in Frankfurt am Main
of over 10,000 sqm, is putting a damper on remained stable at €6.50 per sqm. High-
take-up (– 39%). Take-up results in this priced leases signed for new-build space
segment were down in markets such as continue to boost prime rent levels yoy
Hamburg and Frankfurt, although results despite lower take-up results. Prime rents
in those markets were bolstered by de- in Munich rose 2% yoy to a current €7.15
mand for units of up to 5,000 sqm (+27%). per sqm while Berlin (€6.10 per sqm, +7%),
Property developers are also beginning to Hamburg (€6.30 per sqm, +5%) and
focus their activities on locations outside Cologne (€5.80 per sqm, +5%) saw even
Germany’s 8 top markets, as these offer more significant increases.
more attractive prices and greater availa-
bility of land. Pre-leasing rates are quite
high in the top 8 markets, a factor that
continues to encourage speculative devel-
opment. More and more developers are
also looking into brownfield development
as a way to bring space to market.
Figure 3: Take-up by Branch Share in % Figure 4: Prime Rents in the TOP 8 in € / sqm
8
Others 18%
Logistics Service 7
Providers 28%
Production &
Manufacturing
Companies 28% 6
Trading
Companies 26% 5
4
2015 2016 2017 2018 2019
Berlin Düsseldorf Frankfurt Hamburg
Cologne Leipzig Munich Stuttgart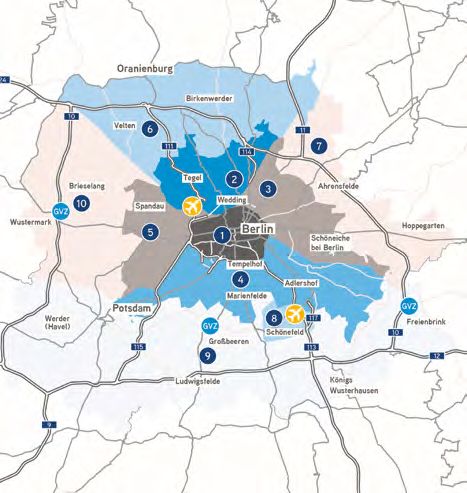
10
Summary and Outlook
Leasing Market Germany | 2019 / 2020
Industrial and Logistics Markets Overview | Colliers International
In view of the current uncertainties around
automotive production and the ongoing
scarcity of development sites in Germany’s
top 8 regions combined with growing
demand for city logistics driven by the on-
going boom in e-commerce, 2020 is likely
to be another average year on Germany’s
top 8 industrial and logistics real estate
markets. Based on these general condi-
tions, we can expect brownfield sites to
become increasingly popular in prime
locations. At the same time, a number of
companies flexible enough to do so are
likely to turn to nearby markets that boast
greater availability. Such markets include
centrally located regions with good infra-
structure such as Kassel/Bad Hersfeld,
the eastern Ruhr region (especially Dort-
mund), Hanover, the Rhine-Neckar region
and cities such as Augsburg in southern
Germany.
Figure 5: Average Rents in the TOP 8 in € / sqm
7
6
5
4
3
2015 2016 2017 2018 2019
Berlin Düsseldorf Frankfurt Hamburg
Cologne Leipzig Munich StuttgartBERLIN / BRANDENBURG 11
Industrial and Logistics Markets Overview | Colliers International
Berlin / Brandenburg | 2019 / 2020
FAST FACTS
2019 2018 Change
Take-up in sqm 474,900 422,500 12%
Leasing Performance in sqm 451,800 322,300 40%
Number of Deals 151 102 48%
Prime Rent* in €/sqm/month 6.10 5.70 7%
Average Rent in €/sqm/month 5.10 5.00 2%
*achievable top rent in new buildings
Take-up according to Location
Submarket Take-up in sqm Share
1 Center 15,100 3%
2 City North 39,800 8%
3 City East 35,200 8%
4 City South 73,000 15%
5 City West 25,600 6%
6 Periphery North 45,300 10%
7 Periphery East 14,200 3%
8 Airport Area BER 20,300 3%
9 Periphery South 164,000 35%
10 Periphery West 42,400 9%
Total 474,900 10012
LEASING
Berlin / Brandenburg | 2019 / 2020
Industrial and Logistics Markets Overview | Colliers International
Take-up Supply and Demand
The Berlin industrial and logistics market While leases signed for units of over
registered total take-up of roughly 10,000 sqm accounted for around 50% of
474,900 sqm, up 12% yoy and exceeding take-up in the previous year, the share
2015’s record result of 451,400 sqm. claimed by this segment dropped by
Take-up results excluding owner-occupi- almost half in 2019 (122,400 sqm, or
ers were particularly strong. 145 leases 26%). The Amazon deal was the only one
were signed for a total of 451,800 sqm to exceed the 20,000 sqm mark compared
in 2019, reflecting a significant 40% yoy to five such deals recorded in the segment
increase and marking a new record result. in 2018. With the availability of units of
Markets such as Stuttgart (– 43%), this size continuing to drop and develop-
Frankfurt (– 28%) and Hamburg (– 31%) ment potential already exhausted in some
experienced a sharp downward trend in hot spots, we do not expect the situation
annual take-up in contrast, putting Berlin to relax any time soon. Small-scale units
and the Leipzig region at the fore of (up to 3,000 sqm), however, recorded an
Germany’s logistics hubs. Notable deals increase in take-up compared to the pre-
included leases signed by Amazon for vious year. A total of 99 leases were
roughly 31,000 sqm in Schönefeld and signed in this segment, reflecting a mar-
Microvast for around 16,000 sqm in ket share of 28% (around 130,700 sqm).
Ludwigsfelde as well as Kühne & Nagel’s As such, the segment accounted for
lease of 15,500 sqm in Oberkrämer near around two thirds of all leases signed in
Oranienburg. 2019.
Figure 1: Take-up in 1.000 sqm Take-up according to Size Category
Size in sqm Take-up in sqm Share
500 474.9
451.4 up to 500 1,000 0%
424.8 422.5
501 – 1,000 27,900 6%
400
352.7 1,001 – 3,000 101,800 21%
3,001 – 5,000 94,600 20%
300
5,001 – 10,000 127,200 27%
above 10,000 122,400 26%
200
Total 474,900 100%
100
0
2015 2016 2017 2018 2019
Whole year Average 2015 – 201913
In terms of tenant breakdown, retailers Outlook
contributed slightly less to overall take-up
Industrial and Logistics Markets Overview | Colliers International
Berlin / Brandenburg | 2019 / 2020
Fresh supply will be hitting the market in
in 2019, a result that can be attributed to
2020 thanks to a number of ongoing prop-
the lack of high-volume deals in the pe-
erty developments in the periphery.
riphery. Retailers accounted for a total of
However, the supply bottleneck in the
142,500 sqm in take-up, down 30% yoy.
municipal area may push prices up even
This decrease, however, is mainly the
further and prevent them from leveling
result of the limited availability of units
off. Demand for small-scale light industri-
over 10,000 sqm as demand in the region
al space is also going to pick up in 2020
remains high.
with prices increasing as a result as prac-
tically no space is currently available for
Rents immediate tenancy. In light of the current
supply situation, we expect 2020 take-up
Ongoing high demand is also evident in
to reach levels similar to those recorded
the current rent trend. No other region
in the previous year.
has seen a comparable increase in prime
rents in the past two years. Some of the
logistics space over 3,000 sqm in the
municipal area is currently going for
€6.90 per sqm. And, as availability within
city limits grows increasingly scarce, we
could see prime rents continue to rise.
On the overall market (including the
periphery), prime rents currently come
to €6.10 per sqm, up 40 cents yoy.
Average rents rose by 10 cents to €5.10
per sqm at year-end 2019.
Figure 2: Take-up by Branch Share in % Figure 3: Prime and Average Rents in ¤/sqm
Production & Manufacturing 7
Companies 23%
6.10
6 5.70
Logistics Service
Providers 28%
5.00 5.00 5.00
Trading 5
5.10
5.00
Companies 31%
4.50
4 4.25
Others 18%
4.00
3
2015 2016 2017 2018 2019
Prime Rent Average Rent14
Industrial and Logistics Markets Overview | Colliers International
Düsseldorf | 2019 / 2020
DÜSSELDORF
FAST FACTS
2019 2018 Change
Take-up in sqm 217,900 317,600 – 31%
Leasing Performance in sqm 117,100 295,600 – 60%
Number of Deals 70 66 6%
Prime Rent* in €/sqm/month 5.75 5.75 0%
Average Rent in €/sqm/month 4.75 4.75 0%
*achievable top rent in new buildings
40
Mühlheim
40
Take-up according to Location
57
59
an der Ruhr
Submarket Take-up in sqm Share
1 Düsseldorf 40,000 21%
5 524
Krefeld 44 2 Neuss 15,700 22%
Meerbusch
7 3 Kaarst 1,200 1%
44
6
Ratingen
4 Willich 0 8%
Willich
52
4
Viersen
Mettmann
5 Krefeld 16,900 20%
52 1
Düsseldorf 6 Meerbusch 0 0%
3 8
Mönchengladbach Kaarst Erkrath
13 Neuss 7 Ratingen 13,000 12%
Korschenbroich
46
14
2
Hilden 8 Erkrath 500 0%
9
9 Hilden 10,800 0%
61 59
11 10 10 Langenfeld 5,000 3%
540 Dormagen
12 Langenfeld
46
Rheinland 11 Dormagen 53,900 9%
Grevenbroich
57 12 Grevenbroich 15,100 3%
Leverkusen 13 Korschenbroich 0 0%
3
44
14 Mönchengladbach 45,800 1%
61
1 Total 217,900 100%15
LEASING
Industrial and Logistics Markets Overview | Colliers International
Düsseldorf | 2019 / 2020
Take-up continues to dwindle along with the
amount of available space able to meet
The Düsseldorf industrial and logistics
modern standards in terms of equipment,
market recorded 217,900 sqm in take-up in
location and size.
2019, around 100,000 sqm less than in the
previous year (– 31%). Annual results came
in well below expectations (– 36%) com- Supply and Demand
pared to the 5-year average (342,500 sqm).
Take-up of units ranging from 5,001 sqm
The bottleneck in the region becomes
to 10,000 sqm saw the steepest drop,
particularly obvious if we look at take-up
down yoy from 24% to 9%. Units featuring
excluding owner-occupiers, with only
less than 5,000 sqm accounted for rough-
117,100 sqm taken up by tenants in 2019.
ly 40% of total take-up (about 87,500 sqm,
This reflects a yoy decrease of 60%.
+41%). This increase shows that the
Only 4 deals were signed for units over
Düsseldorf market continues to be
10,000 sqm compared to more than twice
characterized by exceptionally high de-
as many in 2018. The largest deals posted
mand combined with limited availability,
in 2019 included the Hoyer GmbH owner-
particularly in prime locations. That
occupier development in Dormagen
means there is a very good chance that
encompassing roughly 50,000 sqm of
any space to come available will be
new-build space and the ABC-Logistik
quickly absorbed by the market. The trend
development on a brownfield site near the
towards speculative property develop-
Port of Düsseldorf (around 11,600 sqm
ment also reflects current excess de-
hall space). Demand for units starting at
mand. Supply in the large-scale segment
5,000 sqm remains high, driven by the
is not sufficient to meet that demand due
prevailing tenant structure. However, the
to a lack of space available for immediate
supply of suitable development sites
Figure 1: Take-up in 1.000 sqm Take-up according to Size Category
Size in sqm Take-up in sqm Share
500 up to 500 4,400 2%
435.7
501 – 1,000 15,000 7%
400
346.7 343.8 1,001 – 3,000 40,100 18%
317.6
3,001 – 5,000 28,000 13%
300
5,001 – 10,000 19,500 9%
217.9
above 10,000 110,900 51%
200
Total 217,900 100%
100
0
2015 2016 2017 2018 2019
Whole year Average 2015 – 201916
tenancy at stock properties, which means Outlook
demand is primarily being met with
Düsseldorf | 2019 / 2020
Industrial and Logistics Markets Overview | Colliers International
The lack of development sites is currently
new-build developments. However, land
being further exacerbated by the city’s
sites zoned for new-builds in prime
high requirements on companies in terms
locations are in limited supply, which is
of jobs, taxes and volume. Companies and
increasing tenant willingness to turn to
property developers are therefore likely to
peripheral locations within the region.
intensify their interest in locations out-
The high pre-leasing rate at new-build
side currently coveted submarkets such
developments is also an indication
as Neuss, Krefeld and Mönchengladbach.
that there just is not enough space
Chances are also good that companies
available on the market at the moment
will continue to build their own logistics
to adequately meet demand.
properties in light of the new-build supply
bottleneck in the Düsseldorf core area.
Rents
Prime and average rents are currently
stable with no significant increases likely
despite excess demand. We can also ex-
pect prime rents for units over 3,000 sqm
to remain stable over the course of the
year. We may see an increase in prices
for modern space (light industrial)
at business parks within city limits, as
companies are willing to pay more for
location and equipment in some cases.
Prime rents for this quality of space
within city limits currently come to €7.00
per sqm.
Figure 2: Take-up by Branch Share in % Figure 3: Prime and Average Rents in ¤/sqm
6 5.75 5.75
Production & Manufacturing
Companies 23%
5.40 5.40 5.40
Trading
Companies 18% 5
Logistics Service 4.75 4.75
Providers 33% 4.50 4.50 4.50
4
Others 26%
3
2015 2016 2017 2018 2019
Prime Rent Average RentFRANKFURT/ RHINE-MAIN 17
Industrial and Logistics Markets Overview | Colliers International
FRANKFURT / RHINE-MAIN | 2019 / 2020
FAST FACTS
2019 2018 Change
Take-up in sqm 467,200 650,200 – 28%
Leasing Performance in sqm 414,400 563,600 – 26%
Number of Deals 72 83 – 13%
Prime Rent* in €/sqm/month 6.50 6.50 0%
Average Rent in €/sqm/month 5.40 5.20 4%
*achievable top rent in new buildings
Take-up according to Location
Submarket Take-up in sqm Share
480 Lauterbach
(Hessen)
Gießen
Fulda
1 Frankfurt am Main 25,200 5%
Wetzlar
485 8
5
7
2 Offenbach 15,500 3%
Butzbach 3 Darmstadt 27,100 6%
Limburg an der Lahn
Friedberg
(Hessen) 9
66 4 Groß-Gerau 131,300 28%
7 5 Mainz + Wiesbaden 27,400 6%
Bad Homburg
45
10
vor der Höhe
Gelnhausen
6 Main-Taunus-District 20,800 5%
Frankfurt
Hofheim am Taunus am Main Hanau 7 Hochtaunus-District 5,000 1%
Wiesbaden 1 Offenbach am Main
66 6 66
8 Gießen 117,200 25%
671 661 2 11
5 Dietzenbach
Mainz 9 Wetteraukreis 4,600 1%
Karlstadt
Ingelheim am Rhein 4 Aschaffenburg
Groß-Gerau 3
Darmstadt 10 Main-Kinzig-District 85,800 18%
67
3
63 11 Aschaffenburg 7,300 2%
Gernsheim
Alzey
Total 467,200 100%
Miltenberg
61 Heppenheim
(Bergstraße) Erbach 8118
LEASING
FRANKFURT / RHINE-MAIN | 2019 / 2020
Industrial and Logistics Markets Overview | Colliers International
Take-up Supply and Demand
The Frankfurt industrial and logistics Leases signed for over 10,000 sqm once
market generated 467,200 sqm in total again contributed the lion’s share to total
take-up in 2019, reflecting the weakest results, generating more than half of total
result ever recorded and coming in take-up (59%, or 278,900 sqm). However,
around 24% shy of the 5-year average this reflects a significant drop from the
(619,000 sqm). This drop in take-up previous year’s 75%, or 488,100 sqm.
can be primarily attributed to a lack of Although demand for units of over
large-scale transactions in the space 10,000 sqm remains stable, the supply
segment of over 20,000 sqm and to of developable sites is dwindling and
the increasing shortage of logistics increasingly less space in this segment is
development sites, which tend to involve being added to the market or becoming
long lead times. available for immediate tenancy. As such,
more and more companies are turning to
The most notable transactions recorded peripheral locations in the Rhine-Main
in the region in 2019 include the leases region, including Gießen, Mainz and
signed by online furniture retailer Wayfair Aschaffenburg, and are expanding their
for 90,500 sqm in the Lich submarket of search radius to the edges of the Frank-
Gießen, logistics service provider Zufall furt core area. Several property develop-
for 35,000 sqm in Flieden in the Main- ments are in planning for the new year
Kinzig-Kreis district and Geis Industrie- or are already under construction, and
Service GmbH in Rodenbach (32,000 sqm) we can expect these developments to
as well as two new-build developments in address the continued shortage of space
Gernsheim for Amazon (20,000 sqm) and to some extent. Current developments
Sonepar (26,000 sqm). include the Hillwood and Nvelop business
Figure 1: Take-up in 1.000 sqm Take-up according to Size Category
Size in sqm Take-up in sqm Share
800 up to 500 2,500 1%
720.2
700 650.2 501 – 1,000 8,800 2%
584.0
600 1,001 – 3,000 32,800 7%
463.0 467.2 3,001 – 5,000 36,700 8%
500
5,001 – 10,000 107,500 23%
400
above 10,000 278,900 59%
300
Total 467,200 100%
200
100
0
2015 2016 2017 2018 2019
Whole year Average 2015 – 201919
park development in Erlensee, which will Outlook
comprise 4 construction phases encom-
Industrial and Logistics Markets Overview | Colliers International
FRANKFURT / RHINE-MAIN | 2019 / 2020
New space will be added to the market in
passing a total area of 60,000 sqm. Start
2020 thanks to several property develop-
of construction on phase 1 is scheduled
ments currently underway. Demand is
for spring 2020.
set to remain stable and we can expect
several major deals to be signed over the
Rents course of the year. We can also look for
the trend towards shorter lease terms
The excess demand we are currently
to continue in 2020, as a number of ten-
seeing on the market is pushing up prices
ants signed leases with terms of under
for stock space, in some cases to rent
5 years in 2019.
levels typically paid for new-build proper-
ties. Average rents experienced another
increase as a result to a current €5.40
per sqm with prime rents stable at €6.50
per sqm in the core locations around
Frankfurt Airport. That puts Frankfurt and
Stuttgart (€6.50 per sqm) in second place
following Munich (€7.15 per sqm) in a
national comparison.
Figure 2: Take-up by Branch Share in % Figure 3: Prime and Average Rents in ¤/sqm
7
Production & Manufacturing
Companies 13% 6.50 6.50
6.40
6.30 6.30
Logistics Service
Providers 28% 6
Trading
Companies 48%
5.40
5 5.20 5.20 5.20
5.10
Others 11%
4
2015 2016 2017 2018 2019
Prime Rent Average Rent20
Industrial and Logistics Markets Overview | Colliers International
Hamburg | 2019 / 2020
HAMBURG
FAST FACTS
2019 2018 %
Take-up in sqm 332,500 484,600 – 31%
Leasing Performance in sqm 268,300 393,400 – 32%
Number of Deals 70 78 – 10%
Prime Rent* in €/sqm/month 6.30 6.00 5%
Average Rent in €/sqm/month 5.00 4.85 3%
*achievable top rent in new buildings
23 Quickborn Bargteheide 21
Take-up according to Location
7 Norderstedt Submarket Take-up in sqm Share
Tornesch
6 Tangstedt Ahrensburg
1 City West 12,200 4%
Langenhorn
Pinneberg 7
Ellerbek Schnelsen
Rellingen
2 City North-West 4,800 1%
2 3 Siek
Halstenbek
Niendorf Ohlsdorf 3 City North-East 6,300 2%
Rahlstedt Braak
Schenefeld Eidelstedt Stapelfeld
Wedel
Lurup
4 City East 52,000 16%
Stellingen
Rissen Barmbek Barsbüttel Witzhave
1
24
5 City South 124,000 37%
Glinde
Hamburg
Billbrook
Oststeinbek 6 Periphery North-West 25,700 8%
Waltershof Steinwerder 8 Aumühle
Moorfleet
GVZ
Willhelmsburg
255
25
7 Periphery North-East 69,400 21%
Billwerder
Moorburg
5
Buxtehude
253 Allermöhe
8 Periphery East 26,600 8%
Hausbruch Harburg
Neu Wulmstorf 4
9 Periphery South-East 5,900 2%
1 Geesthacht
261 10 Periphery South-West 5,600 1%
10
Hittfeld
Total 332,500 100%
Stelle 9 Winsen (Luhe)
Hollenstedt 39
Wenzendorf
7
Buchholz in
der Nordheide21
LEASING
Industrial and Logistics Markets Overview | Colliers International
Hamburg | 2019 / 2020
Take-up of construction on Wiska headquarters in
Kaltenkirchen in northern Hamburg was
Hamburg’s industrial and logistics real
one of the few owner-occupier deals to
estate market closed out 2019 with total
have a significant impact on the market.
take-up of 332,500 sqm, the weakest
The first construction phase (around
result posted in the past seven years.
10,000 sqm) will primarily focus on the
Although tenant and owner-occupier
logistics and production areas. The
activity have generated take-up results
facility is scheduled to be up and running
of over 450,000 sqm in the past several
by early 2021.
years, even posting more than
668,800 sqm in 2016, 2019’s year-end
result came in at just half. This considera- Supply and Demand
ble drop in take-up can primarily be
The Hamburg market is currently unable
attributed to the absence of large-scale
to meet demand due to a current lack of
deals signed for over 10,000 sqm.
space suitable for large-scale logistics
Although units of this size accounted for
development. Industrial and logistics
almost 60% of total take-up in the previ-
space is particularly hard to come by in
ous year, 2019 results put their share
the logistics hotspots located in the south
at just one third (roughly 109,100 sqm).
of the city as well as in the commercial
Large-scale leases recorded in 2019
district of Billbrook to the east. The num-
include those signed by logistics service
ber of new-builds available for immediate
provider ULD United Logistics & Distribu-
tenancy dropped drastically in 2019. As a
tion for around 30,000 sqm on Dradenau
result, companies will have to wait for
straße in Waltershof (port area) and by
property developments to be completed
Nutwork for almost 12,000 sqm of logis-
or stock space to come available. Only a
tics space in Völlhöfner Weiden. The start
Figure 1: Take-up in 1.000 sqm Take-up according to Size Category
Size in sqm Take-up in sqm Share
800 up to 500 0 0%
700 668,8 501 – 1,000 1,600 0%
593,4
600 1,001 – 3,000 49,900 15%
484,6 3,001 – 5,000 69,400 21%
500 460,9
5,001 – 10,000 102,500 31%
400 332,5
above 10,000 109,100 33%
300
Total 332,500 100%
200
100
0
2015 2016 2017 2018 2019
Whole year Average 2015 – 201922
handful of new-build developments are Outlook
scheduled for completion in the foreseea-
Hamburg | 2019 / 2020
Industrial and Logistics Markets Overview | Colliers International
Demand is set to remain high in 2020 with
ble future. The Mach 2 speculative
competition for available units intensify-
development in Hamburg-Wilhelmsburg
ing as a result. Large-scale leases are
is expected to add space to the market
again on the horizon with the listing of the
in the coming 12 months. Developer
Mach 2 development, which is scheduled
Fourparx and investor AEW Europe are
for completion in August 2021. However,
planning to build a new type of logistics
2020 take-up results are unlikely to match
property with two levels and a total of
the average of the past 5 years (around
over 100,000 sqm of modern hall space.
531,500 sqm).
Rents
Rent trends reflect the tense relationship
between supply and demand that current-
ly dominates the market with prime and
average rents posting another yoy in-
crease in 2019. Prime rent for modern
logistics space of over 3,000 sqm came
to €6.30 per sqm at year-end, up consid-
erably by 30 cents yoy. That puts Ham-
burg along with Berlin among the markets
to post the highest rent increases last
year.
Figure 2: Take-up by Branch Share in % Figure 3: Prime and Average Rents in ¤/sqm
7
Production & Manufacturing
Companies 14%
6.30
6.00
Trading 5.80 5.80 5.80
Companies 28% 6
Logistics Service
Providers 51%
5
5.00
Others 7% 4.85 4.85
4.75
4.60
4
2015 2016 2017 2018 2019
Prime Rent Average RentCOLOGNE 23
Industrial and Logistics Markets Overview | Colliers International
Cologne | 2019 / 2020
FAST FACTS
2019 2018 Change
Take-up in sqm 192,300 248,100 – 22%
Leasing Performance in sqm 181,000 236,100 – 23%
Number of Deals 47 37 27%
Prime Rent* in €/sqm/month 5.80 5.50 5%
Average Rent in €/sqm/month 4.50 4.50 0%
*achievable top rent in new buildings
46 Take-up according to Location
Submarket Take-up in sqm Share
46
59
540
57
1 Cologne 36,800 19%
542
3 2 Leverkusen 0 0%
2
3 Bergisch Gladbach 0 0%
44
15
12 Leverkusen 4 Rösrath 0 0%
Bedburg Pulheim Bergisch
61
Gladbach 5 Airport Area Cologne/Bonn 0 0%
14 3
Bergheim
1 6 Troisdorf 34,100 18%
1 4
Köln 7 Niederkassel 0 0%
11
Frechen 559
4 8 Wesseling 1,000 1%
4
Rösrath
13 Kerpen
10
GVZ 9 Brühl 0 0%
Hürth
Flughafen Köln/Bonn
555
10 Hürth 0 0%
Brühl 5
Düren
9 8 Niederkassel
6
11 Frechen 17,100 9%
535 Wesseling 7 Troisdorf
12 Pulheim 27,600 14%
560
13 Kerpen 46,400 24%
59
14 Bergheim 11,300 6%
Bonn
61
562 3 15 Bedburg 18,000 9%
Euskirchen 565 Total 192,300 100%24
LEASING
Cologne | 2019 / 2020
Industrial and Logistics Markets Overview | Colliers International
Take-up signed by logistics service provider Log-
win (17,000 sqm) in Kerpen, the expansion
Cologne’s industrial and logistics real
of industrial company Gerflor involving
estate market finished out 2019 with total
just under 9,000 sqm in Troisdorf and
take-up (including owner-occupiers) of
completion of the renovation of Cologne’s
192,300 sqm, down 22% yoy (2018:
theaters (roughly 8,100 sqm).
248,100 sqm). The market was also una-
ble to match the previous year’s result
excluding owner-occupiers (– 23%). Supply and Demand
Similar to Germany’s other top 8 industri-
New-build activity in Cologne was quite
al and logistics markets, this drop in
solid compared to Germany’s other mar-
take-up can be primarily attributed to the
kets. A handful of speculative new-build
absence of large-scale leases. This trend
developments are currently underway in
can also be seen in the number of deals
the city’s sought-after locations, includ-
signed. Although more leases were
ing construction of LogPlaza Frechen en-
signed in 2019 than in the previous year
compassing 18,000 sqm of new-build
(+27%), many of them involved small and
space west of the Rhine River. These
medium-sized units. Leases signed for
developments will boost supply in the city
between 5,001 – 10,000 sqm accounted for
as we continue into the new year. As
almost one third of total take-up, twice as
such, leases signed for new-build space
much as in 2018. Units of over 10,000 sqm
as well as pre-leasing activity also ac-
also generated roughly one third of total
counted for roughly 50% of take-up in
take-up (60,200 sqm). The share claimed
2019. Developers continue to focus on
by this segment, however, was considera-
speculative projects as demand for indus-
bly higher in the previous year at 44%
trial and logistics space remains high and
(2018: 108,200 sqm). The largest-scale
tenants looking for units over 5,000 sqm
leases of the year included the lease
Figure 1: Take-up in 1.000 sqm Take-up according to Size Category
Size in sqm Take-up in sqm Share
300 up to 500 400 0%
248,1 501 – 1,000 7,600 4%
250
1,001 – 3,000 41,600 22%
199,4 198,2 192,3
200 3,001 – 5,000 20,400 11%
167,4
5,001 – 10,000 62,100 32%
150
above 10,000 60,200 31%
100 Total 192,300 100%
50
0
2015 2016 2017 2018 2019
Whole year Average 2015 – 201925
are still coming up short-handed. Kerpen Outlook
recorded the highest demand in 2019 with
Industrial and Logistics Markets Overview | Colliers International
Cologne | 2019 / 2020
In light of upcoming property develop-
take-up at 46,400 sqm, up 30% yoy,
ments planned in the Cologne periphery
thanks in part to the large-scale lease
and current land reserves, we expect
signed by Logwin mentioned above. The
tension on the market to ease slightly in
Pulheim submarket managed to double
terms of units starting at 5,000 sqm.
its take-up results yoy with roughly
As such, we may see 2020 take-up
27,600 sqm. Take-up within Cologne city
results not only match previous-year
limits came to around 36,800 sqm. Al-
levels but even exceed them.
though this reflects a yoy increase of 23%,
these results are significantly down from
2016 (77,700 sqm) and 2017 (97,100 sqm).
The Prologis and Alcaro developments
in Cologne-Niehl and Cologne-Kalk could
potentially increase the supply of space
within Cologne city limits.
Rents
Rents continued to rise over the course of
the year due to ongoing limited availability
and high construction costs, with modern
logistics space currently going for €5.80
per sqm in some cases. These prices,
however, are only being paid in locations
west of the Rhine within Cologne city
limits. Following the increase recorded in
Q4 2018, average rents remained stable at
€4.50 per sqm.
Figure 2: Take-up by Branch Share in % Figure 3: Prime and Average Rents in ¤/sqm
6 5.80
Trading
Companies 16% 5.50
Production & 5.20 5.20
Manufacturing 5.00
Companies 20% 5
Logistics Service
Providers 32%
4.50 4.50
4 4.20 4.20
Others 32% 4.00
3
2015 2016 2017 2018 2019
Prime Rent Average Rent26
Industrial and Logistics Markets Overview | Colliers International
Leipzig | 2019 / 2020
LEIPZIG
FAST FACTS
2019 2018 Change
Take-up in sqm 346,700 343,700 1%
Leasing Performance in sqm 166,000 275,800 – 40%
Number of Deals 32 25 28%
Prime Rent* in €/sqm/month 4.60 4.60 0%
Average Rent in €/sqm/month 3.70 3.70 0%
*achievable top rent in new buildings
Magdeburg
Take-up according to Location
Submarket Take-up in sqm Share
1 Leipzig 114,600 33%
5
Dessau-Roßlau
2 District Leipzig 38,400 11%
Stadt Wittenberg
4 3 Nordsachsen 6,300 2%
6
Anhalt-Bitterfeld 4 Wittenberg 12,600 4%
9
5 Dessau-Roßlau 0 0%
14
3
Nordsachsen
6 Anhalt-Bitterfeld 116,000 33%
Halle (Saale)
7 Stadt
7 Halle (Saale) 22,600 7%
143
GVZ
Saalekreis 1 8 Saalekreis 36,200 10%
38 Leipzig
8 9
14
Total 346,700 100%
38
Landkreis Leipzig
2
7227
LEASING
Industrial and Logistics Markets Overview | Colliers International
Leipzig | 2019 / 2020
Take-up Supply and Demand
The Leipzig industrial and logistics mar- Leases signed for units of over 10,000 sqm
ket recorded total take-up of roughly accounted for roughly three quarters of
346,700 sqm in 2019, topping 2018’s re- total take-up, including the lease signed
cord results by a few thousand square by an automotive company for around
meters (2018: 343,700 sqm). This increase 23,300 sqm of new-build space at Segro
is even more impressive if we look at Logistics Park near Leipzig Airport and
long-term performance, with 2019 results the lease signed by intralogistics provider
exceeding the 5-year average by an im- Dematic for 18,000 sqm in Leipzig.
pressive 43%. This increase can in part
be attributed to several large-scale Despite the shortage of supply, particu-
owner-occupier developments, including larly for units over 5,000 sqm, there is
retailer Rossman’s project (26,000 sqm) some stock space that is still available.
in Landsberg (Saxony-Anhalt) and the These properties, however, are not up to
expansion of the site occupied by tech current standards and are therefore
manufacturer Tesvolt in Wittenberg having a difficult time finding tenants
(around 12,000 sqm). The completion of despite the high demand in the Leipzig
a paper factory in Sandersdorf-Brehna region, primarily due to high ancillary
(Anhalt-Bitterfeld district) for manufac- costs and outdated building technology.
turer Progroup AG deserves particular
mention. With a volume of over €460m, The production and manufacturing sector
the development was the largest invest- continues to be the source of highest
ment project in Saxony-Anhalt in 2019. demand in the Leipzig region, accounting
for almost 200,000 sqm, or 58% of total
take-up. Logistics service providers
Figure 1: Take-up in 1.000 sqm Take-up according to Size Category
Size in sqm Take-up in sqm Share
400 up to 500 0 0%
343.7 346.7
501 – 1,000 0 0%
300 279.0 1,001 – 3,000 14,300 4%
258.0
3,001 – 5,000 9,900 3%
5,001 – 10,000 67,800 20%
200
above 10,000 254,700 73%
116.0 Total 346,700 100%
100
0
2015 2016 2017 2018 2019
Whole year Average 2015 – 201928
(19%) and retailers (16%) trailed at some Outlook
distance. Retailers saw take-up cut in half
Leipzig | 2019 / 2020
Industrial and Logistics Markets Overview | Colliers International
Availability is more important than
yoy due to the absence of leases signed by
location at the moment, as suppliers in
major retailers.
particular are currently under pressure to
find space with a set completion date.
Rents Around 100,000 sqm of speculative
logistics space is currently under con-
Prime rents (€4.60 per sqm) and average
struction, only about 10,000 sqm of
rents (€3.70 per sqm) for logistics space
which is scheduled for completion by
starting at 3,000 sqm remained stable
mid-2020. The remaining space will not
over the course of 2019. However, there is
hit the market until late 2020 or early
a chance that we may see a slight drop in
2021. As a result, companies will have to
new-build rents going forward, particu-
manage with rather limited supply in
larly in the Halle/Saale and Großkugel
2020.
area, i.e. primarily around Leipzig-Halle
Airport, as a number of property develop-
ers are currently active there within a
relatively small radius.
Figure 2: Take-up by Branch Share in % Figure 3: Prime and Average Rents in ¤/sqm
5
Trading 4.60 4.60
Companies 16% 4.50 4.50
4.30
Logistics Service
Providers 19%
4
Production &
Manufacturing
Companies 58% 3.70 3.70
3.50 3.50
3 3.20
Others 7%
2
2015 2016 2017 2018 2019
Prime Rent Average RentMUNICH 29
Industrial and Logistics Markets Overview | Colliers International
Munich | 2019 / 2020
FAST FACTS
2019 2018 Change
Take-up in sqm 227,000 201,100 13%
Leasing Performance in sqm 202,500 201,100 1%
Number of Deals 95 97 – 2%
Prime Rent* in €/sqm/month 7.15 7.00 2%
Average Rent in €/sqm/month 6.70 6.60 2%
*achievable top rent in new buildings
Freising Take-up according to Location
Submarket Take-up in sqm Share
Hallbergmoos 1 Center 0 0%
Erding
11 Eching
Neufahrn
2 Center North-West 0 0%
Sulzemoos 92
Unterschleißheim
3 Center North-East 0 0%
88 Dachau Oberschleißheim
Garching 12
Bergkirchen
9 4 Center South-East 0 0%
99
Maisach
Olching
Allach
5 Center South-West 0 0%
Milbertshofen Kirchheim bei
Unterföhring München
Fürstenfeldbruck
Moosach Poing
6 City North-West 20,000 9%
6 2 7
München 3
7 City North-East 5,300 2%
99 94
1 Feldkirchen
96
Gilching Gräfelfing 5
Sendling
4
Vaterstetten 8 City South-East 5,900 3%
8 8
9
995
9 City South-West 5,400 2%
10 Unterhaching 10 Periphery South-West 36,000 16%
Baierbrunn 13 11 Periphery North-West 35,200 16%
Brunnthal
952
12 Periphery North-East 102,200 45%
95
13 Periphery South-East 17,000 7%
Total 227,000 100%30
LEASING
Munich | 2019 / 2020
Industrial and Logistics Markets Overview | Colliers International
Take-up Supply and Demand
The Munich industrial and logistics mar- Only three leases were signed for over
ket r ecorded roughly 202,500 sqm in 10,000 sqm in the Munich region, includ-
take-up (excluding office and common ing technology company Hönle’s own-
areas) in 2019, matching previous-year er-occupier development in Gilching
results (2018: 201,100 sqm). However, (roughly 14,500 sqm). Thanks to the deal
results did fall short of the five-year aver- signed by BMW, deals for over 5,000 sqm
age by 13%. If we include owner-occupier accounted for 35% of total take-up, or
activity, take-up for 2019 totaled roughly 79,700 sqm (9 deals signed). The space
227,000 sqm. The largest deal of the year segment of between 1,000 sqm and
was signed by automobile manufacturer 3,000 sqm again proved the most popular,
BMW for a property in Vaterstetten to the generating a total of 68,900 sqm with
east of Munich. The new site will feature about 42 deals signed. The segment also
around 32,000 sqm of hall space and is recorded a yoy increase of 27%.
located in the new VGP Park Parsdorf.
BMW is planning to move into the property Demand continues to be driven by
in 2020. Construction on the large-scale companies from the production and
property development began last October manufacturing sector, which claimed
and the development will feature total a 47% share, or 106,200 sqm, in line
rental space of 250,000 sqm. Machine with previous-year results.
building company Kraus-Maffei is
planning to relocate its premises from Munich continues to lag behind in terms
Allach to VGP Park Parsdorf by 2022. of new-build activity, falling short of
Germany’s other top locations such as
Berlin, Hamburg and Frankfurt. Aside
Figure 1: Take-up in 1.000 sqm Take-up according to Size Category
Size in sqm Take-up in sqm Share
400 up to 500 4,100 2%
342.4
501 – 1,000 20,100 9%
300 1,001 – 3,000 68,900 30%
250.7 3,001 – 5,000 54,200 24%
221.7 227.0
201.1 5,001 – 10,000 34,200 15%
200
above 10,000 45,500 20%
Total 227,000 100%
100
0
2015 2016 2017 2018 2019
Whole year Average 2015 – 201931
from the first construction phase at VGP Outlook
Park Parsdorf, there are currently no
Industrial and Logistics Markets Overview | Colliers International
Munich | 2019 / 2020
Rents are likely to continue to rise, leading
significant new-build developments
many occupiers to turn to surrounding
underway to add space to the market. As
regions such as Augsburg, Ingolstadt and
a result, the majority of leases are still
Moosburg. We expect this year’s annual
being signed for space at stock proper-
take-up to match previous-year results
ties. This trend can be seen in current
thanks to the VGP Park development.
price levels with space at stock proper-
ties in some cases even going for new-
build prices. Supply on the market contin-
ues to be severely limited and available
space is often being re-let off-market.
Rents
Prime rents for warehouses exceeding
3,000 sqm rose 2% yoy to €7.15 per sqm.
Average rents also experienced a slight
increase to a current €6.70 per sqm.
Warehouse rents at the moment are
higher in Munich than in any other Ger-
man city.
Figure 2: Take-up by Branch Share in % Figure 3: Prime and Average Rents in ¤/sqm
8
Logistics Service
Providers 11%
7.15
Trading 7.00
6.85 6.85
Companies 19% 7 6.75
Production &
Manufacturing 6.70
Companies 47% 6.60
6.50
6 6.10
Others 23% 6.00
5
2015 2016 2017 2018 2019
Prime Rent Average Rent32
Industrial and Logistics Markets Overview | Colliers International
Stuttgart | 2019 / 2020
STUTTGART
FAST FACTS
2019 2018 Change
Take-up in sqm 171,400 300,400 – 43%
Leasing Performance in sqm 130,500 257,000 – 49%
Number of Deals 83 83 0%
Prime Rent* in €/sqm/month 6.50 6.50 0%
Average Rent in €/sqm/month 5.20 5.20 0%
*achievable top rent in new buildings
6
Take-up according to Location
Submarket Take-up in sqm Share
Heilbronn Schwäbisch Hall
1 Stuttgart 9,900 6%
2 Ludwigsburg 68,400 40%
81
3 Rems-Murr-District 60,200 35%
2
3
Pforzheim
Ludwigsburg 4 Göppingen 1,100 1%
Waiblingen 5 Esslingen 24,100 14%
Stuttgart 6 Böblingen 7,700 4%
Esslingen
1
Calw
am Neckar
Göppingen Total 171,400 100%
Böblingen
8
6 4
5
Tübingen
81
Reutlingen
Neu-Ulm33
LEASING
Industrial and Logistics Markets Overview | Colliers International
Stuttgart | 2019 / 2020
Take-up Supply and Demand
The Stuttgart industrial and logistics This dramatic drop in take-up can primar-
market finished out 2019 with roughly ily be attributed to the absence of deals
171,400 sqm in take-up, down a consider- for units of over 10,000 sqm, which have
able 43% yoy (300,400 sqm). This is the contributed significantly to take-up
second-lowest result recorded after results in the past. Only 2 leases were
2014’s dip and reflects a 37% drop com- signed in this segment in 2019 (30%, or
pared to the 5-year average. Take-up 52,200 sqm) compared to a total of 8 deals
excluding owner-occupiers came to in the previous year. The small-scale
130,500 sqm, roughly half of the result segment of under 3,000 sqm also posted
posted in 2018 (257,000 sqm). The largest a drop in take-up at 23%. Availability is
deals signed included the Greenfield scarce at the moment and the limited
property development for Daimler in new-build construction activity is unable
Waiblingen (42,000 sqm, Rems-Murr- to provide much relief. Demand from the
Kreis submarket) and the lease signed by automotive sector and automotive suppli-
Daimler subsidiary AMG for roughly ers is also subdued, primarily in response
10,200 sqm in Marbach (Ludwigsburg to uncertainties in the production indus-
submarket). try. Take-up generated by the production
and manufacturing sector fell from 44%
in 2018 to a current 35%. In addition to the
development site bottleneck in all sub-
markets of the Stuttgart logistics region,
building permits are subject to extremely
long lead times and the lack of skilled
workers is tangible. Developers are
Figure 1: Take-up in 1.000 sqm Take-up according to Size Category
Size in sqm Take-up in sqm Share
393.9
400 up to 500 1,200 1%
501 – 1,000 13,300 8%
300.4
300 1,001 – 3,000 37,300 22%
267.6
235.0 3,001 – 5,000 22,300 13%
5,001 – 10,000 45,100 26%
200 171.4
above 10,000 52,200 30%
Total 171,400 100%
100
0
2015 2016 2017 2018 2019
Whole year Average 2015 – 201934
beginning to turn to surrounding regions Outlook
as a result and are increasingly looking to
Stuttgart | 2019 / 2020
Industrial and Logistics Markets Overview | Colliers International
Despite current fluctuations in automo-
the Rhine-Neckar region and the areas
tive production, demand is expected to
along the A8 motorway towards Ulm and
remain high in 2020 with no dramatic
the A81 south of Herrenberg. We are also
impact on the logistics market. We can
likely to see more new-build construction
also expect demand to continue to be
activity along the A7 between the Feucht-
confronted with extremely limited space
wangen junction and Ulm. A few land
available for immediate tenancy, a
sites zoned for logistics are still available
situation that is unlikely to change in 2020
in these areas.
as the new-build pipeline is practically
non-existent at the moment. One of the
Rents few developments for the year involves
30,000 sqm east of Stuttgart along
Prime rents remained stable both within
highway B10 in Plochingen. Due to these
Stuttgart city limits and in surrounding
limiting conditions, we can expect market
districts such as Ludwigsburg, Böblingen
activity to keep a pace similar to that
and Rems-Murr-Kreis. Prime rents for
seen in 2019 and again fall short of the
warehouse space larger than 3,000 sqm
average posted in recent years.
still come to €6.50 per sqm. Average rents
have also stabilized at €5.20 per sqm.
FIGURE 2: Take-up by Branch Share in % FIGURE 3: Prime and Average Rents in ¤/sqm
7
Trading Companies 10% 6.50 6.50 6.50
Logistics Service 6.20 6.20
Providers 11%
6
Production &
Manufacturing
Companies 35%
Others 44% 5 5.20 5.20 5.20
4.80
4.70
4
2015 2016 2017 2018 2019
Prime Rent Average RentINVESTMENT 35
Transaction Volume Supply and Demand
Industrial and Logistics Markets Overview | Colliers International
Investment | 2019 / 2020
The German industrial and logistics real Portfolio deals accounted for €2.6bn in
estate market finished out 2019 with a transaction volume in 2019, or 40% of
satisfactory annual result. Investors annual transaction volume, down 32% yoy.
poured roughly €6.6bn into this asset Apollo Global Management and Palmira
class, bringing in the third-strongest Capital Partners sold the Maximus port
annual result to date since record year folio in Q4, the largest logistics portfolio
2017 (€8.7bn) and 2018 (€6.8bn) despite deal in 2019. Singapore’s sovereign wealth
ongoing limited supply. This result also fund (GIC) acquired the pan-European
managed to top the 5-year average by logistics portfolio comprising 28 assets
roughly 19%. Industrial and logistics once before the end of the year. The portfolio
again proved to be the third strongest as- changed hands for around €950m, €540m
set class on the overall commercial real of which was generated by the portfolio’s
estate market with a market share of over German assets. Other deals included the
9%. This excellent result can largely be sale of the Blue Chip portfolio comprised
attributed to exceptionally lively activity of 3 large distribution centers to GreenOak
during the end-of-year rally. Almost the and Apeiron (roughly €350m) as well as
same amount of capital was invested the sale of 9 logistics assets to the REIT
in Q4 as in Q1 and Q2 combined. And managed by Asian investor Frasers
results would have been even higher if (roughly €320m). The deal involving the
more product had been available. sale of the Amazon Logistics Center
(75,000 sqm) in Dortmund was one of the
year’s major and most expensive single-
asset deals with a gross yield of just above
4%. Arabian investors sold the asset to
Savills Investment Managers for roughly
€140m just two years after initial acquisi-
tion. Another notable single-asset deal
Figure 1: Transaction Volume Industrial & Logistics Figure 2: Transaction Volume by Property Type
in bn € in bn €
8,000 0 10 20 30 40 50
7,000 Office
6,000
Retail
5,000
Industrial &
4,000 Logistics
3,000 Hotel
2,000 Building Site
Commercial
1,000
3,972 4,579 8,662 6,814 6,566 Mixed use
0
Other properties
2015 2016 2017 2018 2019
Industrial Logistics TAV in total Transaction Volume GermanyYou can also read