Report of the Mica Research Project - Presented to the Soil Survey Standards and Research Priorities Committees Southern Regional Cooperative Soil ...
←
→
Page content transcription
If your browser does not render page correctly, please read the page content below
Report of the
    Mica Research Project

                    Presented to the
Soil Survey Standards and Research Priorities Committees
 Southern Regional Cooperative Soil Survey Conference
                Oklahoma City, Oklahoma

                       June 2006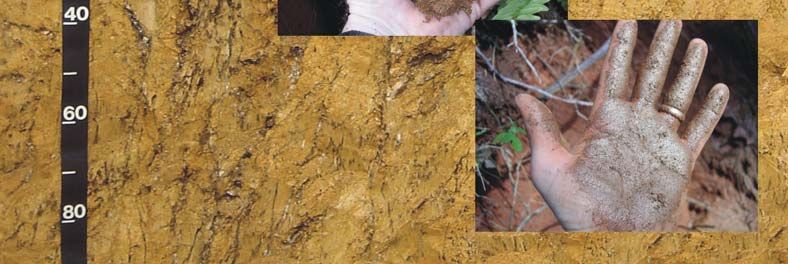
Introduction

In the summer of 2003, a team of soil scientists was assembled to study and evaluate how mica
has historically been described in soil profile descriptions (official soil descriptions and field
descriptions) and to determine if a need exists to refine quantification and description
techniques as related to soil classification and making and interpreting soil maps.

In addition to soil scientists, resource specialists (geologists, engineers, research specialists,
and university staff) were asked to provide input, guidance, and historical perspective. The
following individuals participated in a series of meetings, teleconferences, and field exercises to
(1) evaluate methods for quantifying mica in soil profile descriptions, (2) review taxonomic
classification and use of mica as criteria for separation of soil series, and (3) determine the
effect of mica on soil performance. Each contributed significantly to the conclusions and
recommendations presented in this report.

Team Members:
      Alan Walters, Resource Soil Scientist, NRCS, Salisbury, NC
      Chip Smith, MLRA Project Leader, NRCS, Asheville, NC
      Doug Thomas, Soil Survey Project Leader, NRCS, Waynesville, NC
      John Kelley, Soil Data Quality Specialist, MO-14, NRCS, Raleigh, NC
      Kent Clary, Soil Data Quality Specialist, MO-18, NRCS, Shelby, NC
      Mike Sherrill, Resource Soil Scientist, NRCS, Waynesville, NC
      Perry Wyatt, Regional Soil Scientist, NC-DENR, Winston-Salem, NC
      Roger Leab, MLRA Project Leader, NRCS, Greensboro, NC
      Roy Mathis, Soil Scientist-Correlation, NRCS, Wilkesboro, NC

Resource Specialists:
      Angela Jessup, Civil Engineer, NRCS, Yadkinville, NC
      Bill Craddock, MLRA Team Leader, MO-18, NRCS, Lexington, KY
      Bob Engel, Soil Scientist, NSSC, Lincoln, NE
      Cathy Seybold, Soil Scientist, NSSC-NRCS, Lincoln, NE
      Darwin Newton, State Soil Scientist, NRCS, Nashville, TN
      Howard Tew, Supervisory Civil Engineer, NRCS, Waynesville, NC
      John Schlanz, Acting Director, NC Minerals Lab, Ashville, NC
      Kim Kroger, Geologist, NRCS, Raleigh, NC
      Mike Wilson, Research Soil Scientist, NSSC-SSL, Lincoln, NE
      Roy Vick, MLRA Team Leader, MO-14, NRCS, Raleigh, NC
      Stan Buol, Professor, NCSU, Raleigh, NC
      Tom Reedy, Soil Scientist, NSSC-NRCS, Lincoln, NE

Overview

Over a two-year period, seven meetings of the mica research team (MRT) were conducted.
During the first meeting, held August 2003, the team discussed numerous issues related to
mica. All participants had been actively involved in mapping high-mica soils, correlating soils
series, or providing technical soil services. The following four major areas of study with related
subtopics were identified:

                                                 1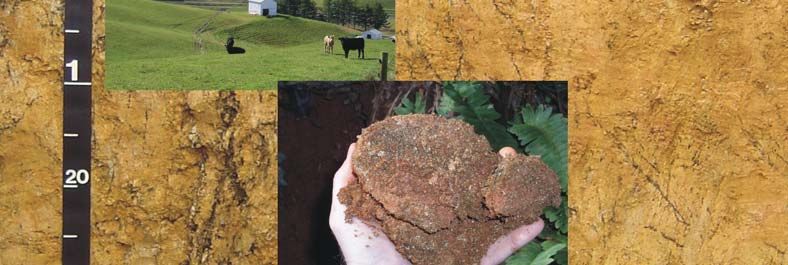
I. Field Morphology
   A. Determine how mica that is visible without magnification should be described.
   B. Study the relationships of geology, climate, topography, etc. to mica content and determine
       if repetitive patterns exist.
   C. Develop a list of field indicators as influenced by mica.

II. Data Population and Soil Interpretations
    A. Determine an appropriate depth for the interpretative control section of soils influenced by
       mica (possibly 0 to 200 cm or bedrock contact).
    B. Define use and management factors that affect interpretations.
    C. Determine a list of soil properties or qualities that are affected by mica.
    D. Establish parameters, or ranges, and appropriate class separations for limitation classes.
    E. Choose methods (field, laboratory, etc.) for comparing soil conditions within the interpretive
        control section.

III. NASIS (NRCS-National Soil Information System) Issues
     A. Determine which NASIS data elements (primarily representative values) should be
        modified in order to achieve appropriate soil interpretations.
     B. Determine NASIS reports needed to reflect soils influenced by mica.

IV. Application-Soil Series Descriptions and Soil Classification
   A. Revise existing series range in characteristics on a continuum to eliminate gaps in the
      range of soil properties.
   B. Study taxonomic criteria and make necessary recommendations.

Over a two-year period, six additional meeting were held to address the areas of study identified
by the MRT. Each team member had the opportunity to make suggestions, express concerns,
offer solutions, and invite participation of additional resource specialists. During each meeting,
action items were identified and assigned to team members.

Most of these meetings consisted of open discussion forums held in the Iredell County
Agricultural Center, Statesville, NC. One meeting consisted of a field trip to view selected sites
to determine consistent identification and quantification of mica, discuss related soil
interpretations, and identify representative sites to sample. Another meeting was dedicated to
sampling representative pedons where data voids had been identified.

Exhibit 1 provides a list of soil series and pedon identification numbers. Individual pedon data
may be queried via the NRCS-NSSC Soil Survey Laboratory Soil Characterization Database:
http://ssldata.sc.egov.usda.gov/querypage.asp.

This report does not include a detailed discussion of the numerous processes evaluated by the
team or the progression of thought as different methods and ideas were tested. A complete
record of the minutes from team meetings, methods, or procedures evaluated during the course
of the study, copies of related research, laboratory data, soil descriptions, images, and pertinent
correspondence is available from MLRA Region 14, Raleigh, NC.

                                                 2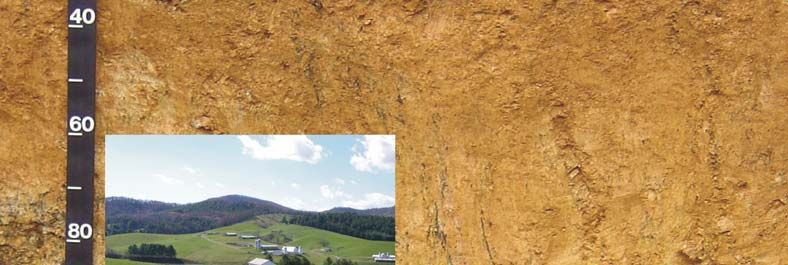
Results and Discussion

I. Field Morphology

  A. Determine how mica that is visible without magnification should be described.
The MRT concluded three issues need to be addressed when describing mica: 1) the quantity of
mica, 2) the size of the mica and its relation to the coarseness of non-platy soil material, and 3)
the manner in which aggregates respond when exposed to pressure.

1) Quantity of mica. When describing soils in the field, the quantity of mica has been expressed
as a percent of area covered or it has been grouped into traditional concentration classes: few
(< 2 percent), common (2 to 20 percent), and many (> 20 percent). These class separations
have been used to separate soils at the series level (e.g., Cecil series versus Madison series).

Several of the MRT members expressed concern that the “many” class limit of more than 20
percent was not adequate to clearly group soils that have a larger amount of mica and the
potential for a greater degree of limitation. For example, a soil with 25 percent mica is classed
the same as a soil with 50 or 75 percent mica.

It was agreed that a field procedure for determining the quantity of mica should be expressed as
a numerical value. However, complete agreement for a universal methodology of estimating
mica content could not be agreed upon. The field procedure for determining the content of mica
(percent of the area covered) most widely accepted by the MRT members is as follows:

   •   Break apart a 25 to 50 mm size ped (fig.1).
   •   Evaluate the soil material on < 2 mm base. This may require sieving with a No. 10 sieve
       or visually eliminating the material coarser than 2 mm if it occurs in small amounts.
   •   For broken peds, compare the face with a quantity estimate chart and record the
       numerical value. If a ped cannot be obtained or the material is sieved, spread a
       sufficient amount onto a solid surface and compare to the chart (fig.2).
   •   Re-examine with a 10X hand lens to identify any additional mica.

Figure 1. Evaluating ped for mica content.           Figure 2. Effort should be made to visually
                                                     exclude mica > 2 mm.

                                                3
Within the soil science community, mica content has been expressed as (1) percent of area
covered, (2) percent by volume, (3) percent by weight, and (4) numerical grain count. Percent
(by area covered) represents a two-dimensional perspective. Percent (by volume) represents a
three-dimensional perspective. Numerical values obtained by these methods are considered
similar. Values obtained by weight or grain count are measured differently and may have a
predictive relationship however; a universally accepted conversion factor from one data value to
another has not been developed.

The Keys to Soil Taxonomy, Eight Edition (1998) indicates that 25 percent mica by weight
equates to about 65 percent mica by grain count, and 40 percent mica by weight equates to
about 80 percent mica by grain count. In 2003, the relationship was revised so that 25 percent
mica by weight is equal to about 45 percent mica by grain count, and 40 percent mica by weight
to about 70 percent mica by grain count.

The MRT was not able to identify any algorithm that consistently converted data from one of
these methods to percent of area covered or percent by volume. Without some method of
conversion or a system to relate grain counts or percent by weight to percent area covered, it is
difficult to consistently identify horizons (in the field) that have potential paramicaceous or
micaceous mineralogy.

The MRT conducted a review of soil pedon data (primarily from the NRCS-Soil Survey
Laboratory) of high-mica soils sampled throughout the Southern Appalachian Mountains,
focusing on grain count data. Grain counts are routinely conducted on the dominant fraction
within the range limits defined in Soil Taxonomy. The fractions analyzed have been
significantly narrowed over the years from 0.02 mm to 20 mm in 1975, from 0.02 mm to 2.0 mm
in 1999, and from 0.02 mm to 0.25 mm in 2003.

In order to determine the mica content of the < 2.0 mm soil, the percent mica in the analyzed
fraction was extrapolated to represent the coarse silt through very coarse sand fraction. This
value was used to represent the percent mica on a < 2.0 mm basis. The total percent of coarse
silt through very coarse sand was multiplied by the percent mica to approximate mica content.
The MRT used this procedure to select representative pedons for characterization and bulk
sampling. In each of the pedons, differences in the results of the two methods did not affect
mineralogy class.

Example:
  - grain count data of the fine sand fraction (0.10 to 0.25 mm) of a horizon contains 35
     percent muscovite and 15 percent biotite, for a total of 50 percent mica minerals.
  - the coarse silt through very coarse sand fractions are 75 percent of the < 2mm fraction.

       50 x 75 = 37.5 or about 35 to 40 percent mica (about 1/3 to 1/2 of a broken ped surface)
        100

This procedure was established in order to provide a link between laboratory analysis and field
identification of mica. Without this link, calibration of field soil scientists or consistent
comparison of the high-mica components from map unit to map unit could not be achieved.

Table 1 compares quantity estimates of mica from a single-fraction grain count to grain count of
the coarse silt through very coarse sand fraction. Fine sand was dominant for the 0.02 to 0.25
fraction of each sample.

                                                  4
Table 1. Grain count comparisons.
Grain count
Sample Percent Percent
number mica* mica**
CoSi VFS FS MS CoS VCoS
2-1 55 69 61 48 60 58 52 50
2-2 63 77 66 59 64 45 50 49
2-3 71 73 71 72 76 62 63 63
2-4 46 57 41 25 4 4 20 18
2-5A 47 54 72 49 28 12 33 22
2-5B 70 82 90 81 51 1 67 57
* Single grain count (fine sand); ** Multiple grain count (coarse silt through very coarse sand)
It must also be kept in mind that the content of mica in a sample is only one of the important
factors in developing interpretations. Some variability of the reported percent mica is likely not
critical to the success of any developed criteria. It appears that inclusion of particle-size data,
landform criteria, and geologic information are also important to any generalized interpretation.
Therefore, the continued use of data on a single, dominant fraction seems adequate in most
cases.
As in the past, laboratory flexibility for the needs of the data user is critical. The option of the
soil scientist to request the analysis of additional fractions should be maintained as particle-size
data accompanied by field examination of the site warrant. The MRT concluded that grain
count of the single dominant fraction, for the most part, was adequate for determining
mineralogy and volume estimates.
The grain conversion method was applied to several datasets of high-mica soils to determine its
applicability. Of the 57 datasets reviewed, the coarse silt plus sand fraction averaged about 50
percent for fine and fine-loamy horizons and about 75 percent for coarse-loamy and sandy
horizons. Table 2 shows the relationship of fine- or coarse-textured soils that have
paramicaceous or micaceous sand mineralogy to estimated mica content.
Table 2. Relationship of particle size, mineralogy, and mica content.
Particle-size class Sand mineralogy Content estimate
Fine-loamy or fine: Paramicaceous (45% mica by GC x 50% (CoSi + S) / 100) = 23% about 1/5 to 1/3
Wt. avg. CoSi + S = 50 Micaceous (70% mica by GC x 50% (CoSi + S) / 100) = 35% greater than 1/3
Coarse-loamy or sandy: Paramicaceous (45% mica by GC x 75% (CoSi + S) / 100) = 34% about 1/3 to 1/2
Wt. avg. CoSi + S = 75 Micaceous (70% mica by GC x 75% (CoSi + S) / 100) = 53% greater than 1/2
5Following this guide, a fine-loamy horizon with paramicaceous mineralogy would typically have
a content of about one-fifth (20%) to one-third (33%) mica in the coarse silt to very coarse sand
fraction. The same approximate content would be observable on a broken-face ped. This
procedure provides a ”general” guide for field soil scientists to determine if a horizon has
sufficient mica content to classify in a paramicaceous or micaceous mineralogy family.
The MTR recommends content of mica be evaluated and recorded in all pedon
descriptions, where present, and the method of measurement identified (e.g.,
comparison to quantity chart, conversion from grain count data, etc.).
It has come to the attention of the MRT that the quantity charts provided in the Field Book for
Describing and Sampling Soils may not be accurate. Reference to these charts by field soil
scientists are an important step to properly identifying mica content as well as other soil
features.
The MTR recommends evaluation and conformation of the quantity charts provided in
the Field Book for Describing and Sampling Soils.
The MRT questioned the value of determining mica by weight for application in the Cooperative
Soil Survey Program. Even though methods have been developed to determine content by
weight (froth flotation, electromagnetic separation, vibration, etc.), none are routinely conducted
by soil science laboratories nor could universally accepted procedures be identified.
In addition, there is very limited published data available for review and comparison of
methodologies. The research of Harris in the 1980’s suggested there was a curvilinear
relationship (fig. 3) between grain count and weight and that dividing grain count data by a
factor of 8 (diameter to height ratio of platy grains) would be a possible procedure to convert
grain count data to a weight percent basis.
Figure 3. Methods used to convert grain count values to percent mica by weight.
6Rebertus and Buol (1989) developed an equation to model the conversion, but were unable to
independently verify the model. They indicated that grain shape, size, cleavage, and density
were all factors that influenced this relationship and concluded that any conversion of grain
count data to another reporting basis (weight or volume) was impractical. At that time, the
consensus was that a grain count was the measure of the mica content of the soils, reflecting
both the size and shape of the grains. Therefore, scientists researching this topic
recommended grain count values as a reporting basis (Harris and Zelazny, 1985; Rebertus and
Buol, 1989).
Five bulk samples were sent to the North Carolina Minerals Lab, Asheville, NC, for weight
analysis. Using the weight to grain count relationship identified in the Keys to Soil Taxonomy,
(2003), comparison of grain count data by the NRCS-SSL to weight data from the Minerals Lab
was relatively consistent. The process was complicated by the fact that the time required for
the NC Minerals Lab to conduct tests and report their findings was lengthy, and when additional
samples were submitted, analysis could not be completed.
A possible method for converting mica by grain count to percent mica by weight was suggested
by the National Soil Survey Center by dividing the percent mica by grain count by (the percent
mica by weight plus 5 times the other grains in the count). This number should be multiplied by
the amount of silt plus sand in the fine-earth fraction (as a decimal fraction).
Example: (Pedon 00NC-021-015, Chandler Series, C horizon)
- 88 percent (wt.) silt plus sand
- 70 percent mica (by grain count)
- 30 percent other grains in the count
- 70 percent (wt.) mica
70% mica by grain count
× 88% ( wt.) silt plus sand = % mica ( wt.) for the 2µ to 2 mm fraction
70% mica by wt. + (5 × 30% other grains)
Using this formula, the percent mica, by weight is about 28 percent. This is the approximate
value identified in the Robertus and Buol model.
The MRT agreed the central focus when quantifying mica should be a laboratory procedure to
confirm field observations or to allow for calibration of field soil scientists. Since grain counts
are the established procedure used by the NRCS-Soil Survey Laboratory for identifying mica
content and a conversion procedure has been proposed for comparison of field estimated
content to measured grain counts, the need for identification of mica (by weight) may not serve
any additional purpose.
The MRT recommends mica by weight be dropped as measurement criteria used for
mineralogy families in soil taxonomy.
It was agreed that once characterization and reference samples for the Mica Research Project
were collected, subsamples should be made available to field staff (upon request) for
calibration. These samples are in storage at the MLRA Region 14 Office located in Raleigh,
NC. Subsamples may be obtained by contacting John Kelley, MLRA Soil Scientist. See Exhibit
2 for a list of available calibration samples and associated data.
7The MRT recommends standardized samples of micaceous soils be made available to
field soil scientists so they can be used for comparison and calibration of mica content
and size.
2) Size of the mica and its relation to the coarseness of non-platy soil material. Often, mica
dominantly occurs in the finer sand fractions. The identification and quantification of mica in
these fractions is very difficult and requires the use of a hand lens. It is not uncommon for a
horizon that has sufficient grain counts of mica for the paramicaceous or micaceous mineralogy
family to have only a small amount of observed mica (e.g. few flakes of mica).
The Keys to Soil Taxonomy, Ninth Edition, 2003, indicates only the 0.02 to 0.25 mm fraction
(coarse silt to fine sand) be considered when determining placement in the micaceous or
paramicaceous mineralogy families. This requires each horizon, when described, to be
examined with a hand lens if a realistic estimate of the volume of mica is to be obtained or if a
comparison to grain count data is made.
Mica is presently described as a concentration of inherited minerals. Concentrations are
defined by kind, quantity, size, contrast, color, moisture state, shape, location, hardness, and
boundary. Sizes of concentrations are not subdivided by class for materials less than 2 mm.
Since cemented materials greater than 2 mm in size are identified as rock or pararock
fragments, additional separations are needed for mica minerals or other cemented materials
finer than 2 mm.
Subdividing the “fine” class of concentrations will lead to misunderstanding of point data
presently stored in the NASIS Pedon program. To adequately describe and define inherited
materials, these geogenically formed remnants should be separated into their own unique
group. Exhibit 3 provides criteria for the establishment of “inherited materials”.
The MTR recommends a separate property table for “Inherited Materials” be established
for point and aggregate data as used in the NASIS data structure, Soil Survey Manual,
National Soil Survey Handbook, Soil Taxonomy, etc.
Once mica content reaches a significant amount, it affects the way in which the soil ribbons,
influencing the determination of soil texture (fig. 4 and fig. 5). Many soil scientists over estimate
the amount of clay due to the “slick” feel imparted to the soil as it is ribboned. This requires re-
calibration by the soil scientist similar to that required when texturing soils with high amounts of
organic matter. To identify this characteristic, a “micaceous” texture modifier is proposed. An
operational definition for the micaceous texture modifier is provide in Table 3.
Table 3. Pedon horizon texture modifier.
Code
Types Criteria:
PDP NASIS
OTHER
≥ 1/3 of ribboned surface covered by mica flakes (ribbon formed by
gradually increasing pressure to a specimen held between extended thumb
Micaceous
and forefinger in such a manner that some shear force is exerted on the
specimen.)
8Figure 4. Texture ribbon with more than Figure 5. Mica residue remaining on hand
1/3 of the surface covered with mica. after texturing.
The MTR recommends “micaceous” be added to the list of “other” compositional texture
modifiers as used in the NASIS data structure, Soil Survey Manual, National Soil Survey
Handbook, Soil Taxonomy, etc.
Mica fragments greater than 2 mm are populated in the NASIS data structure as rock
fragments. The pedon description programs presently being used by NRCS require populating
fragment-kind from a choice list. This list does not include mica. The only related option is
schist, mica. Adding mica to the choice list will more accurately reflect horizon composition.
For example, a soil with about 50 percent mica (many mica flakes) that has flakes ranging from
0.02 to 20 mm in size (about 1/2, 2mm-20 mm) would appropriately be described as:
...; 10 percent fine mica flakes and 15 percent coarse mica flakes; 25 percent 2 mm to 20 mm
mica fragments; ...
The MRT recommends “mica” be added to the Pedon Horizon Fragment-Kind choice list
in NASIS Pedon.
3) Manner in which aggregates respond when exposed to pressure. Another physical property
of mica when ribboned (as when determining texture) is the characteristic “greasy” feel. As a
soil aggregate is broken and rubbed between thumb and forefinger, the platy particles impart a
“slick feel” to the fingers and a “sheen” or shiny appearance to the ribboned aggregate. When
smeared, the stacked plates of mica break down similar to a deck of cards being fanned. Soil
aggregates when crushed in hand leave a residue of mica (fig. 6 and fig.7).
The observance of this characteristic is often used by field soil scientists to verify the presence
of mica. If the aggregate contains large amounts of mica, the ribbon will appear to be
completely covered by mica. This often leads the soil scientist to over-estimate the mica
content as compared to laboratory grain counts or weight determinations. However, this greasy
feel is a characteristic unique to soils with significant amounts of mica and may be an important
indicator when evaluating soil performance.
9Figure 6. High-mica soil aggregate. Figure 7. Residue from high-mica soil.
Greasiness can be defined as the capacity of the soil, when ribboned, to impart a “slick feel” to
the fingers and a sheen or shiny appearance to a ribboned aggregate. Table 4 lists the classes
and criteria for greasiness that are proposed.
Table 4. Greasiness classes.
Failure Class: Criteria: Use a 3 cm block. (Press between thumb and forefinger.)
Material ribbons as expected for texture class. Little or no mica residue on hands when
Non-greasy1
rubbed.
Material ribbons easily between thumb and forefinger. Moderate mica residue on
Semi-greasy1
hands when rubbed.
Material ribbons very easily between thumb and forefinger. Significant mica residue on
Greasy1
hands when rubbed.
1
Greasiness failure classes are used dominantly with soil materials that contain significant amounts of
mica.
The MRT recommends that greasiness classes be added to the traditional manner of
failure classes described in the NRCS Soil Survey Manual.
B. Study the relationships of geology, climate, topography, etc., to mica content and determine
if repetitive patterns exist.
The MRT reviewed geology maps, soil maps, topographic maps, and other related materials. It
was agreed that representative landscape and geologic units (formations, groups, etc.) could be
used to roughly determine the geographic extent of high-mica soils. The team members were
confident these types of resource materials should be used when plotting or revising soil
boundaries or geographically separating or correlating soil components at the series level.
However, it was noted that geologic formations in and of themselves were only an indication of
the dominant parent materials and subsequent mica content of the overlying soil. This did not
exclude the possibility of non-mica soils occurring in areas mapped by geologists as high-mica
10geologic materials. It was agreed that a consistent method of quantifying mica was imperative if
correlating mapunits and component composition were to be consistent from area to area.
C. Develop a list of field indicators as influenced by mica.
It was noted by several of the MRT that land surface conditions (i.e., degree of erosion, type of
erosion, slip scars, cat steps, failed water impoundments, etc.) may be a means of identifying or
confirming the presence of high-mica soils. Time did not allow for adequate investigation of this
issue and no conclusions or recommendations are offered.
II. Data Population & Soil Interpretations
A. Determine an appropriate depth for the interpretive control section of soils influenced by
mica (possibly 0 to 200 cm or bedrock contact).
The term “control section” has multiple meanings as applied to soil taxonomy. It is used as a
reference zone for family and series level criteria. Field soil scientists make and record
observations and commonly communicate on the basis of the soils control section; however, no
attempt has been made to establish a control section for soil interpretations. The lack of an
established interpretive control section prompted several hours of discussion by the MRT.
Many members were concerned that recording soil properties to a depth of only 150 or 200 cm
may not be adequate, especially when evaluating soil performance in high-mica areas.
Individuals working in the mountains suggested that the base depth of consideration be
extended to hard bedrock, even where bedrock occurs at a depth of several meters. Although
the MRT members were in agreement that the underlying geological materials should be
considered when making interpretations, it would not be practical to routinely conduct such
extremely deep (2 to 10 meters) observations or attempt to populate soils properties to these
depths in the NASIS database.
It was agreed the zone of consideration when interpreting soils high in mica should be at a
minimum depth of two meters or to hard bedrock, whichever is shallower. Where observations
can be made in deep cuts, this information should be recorded and used as a basis to modify or
adjust concepts.
B. Define use and management factors that affect interpretations.
In traditional Soil Survey Reports, map unit descriptions and the use and management section
provide users with a list of potential soil concerns, limitations, and practices that may help to
overcome a particular limitation posed by a soil property or quality. The MRT reviewed these
sections and discussed different ways to identify factors related to the use and management of
high-mica soils.
Resource specialists such as engineers, geologists, and university staff were invited to
participate in two of the MRT meetings. Some attended the session and others responded in
writing or provided input by telephone. Both private and NRCS engineers were in agreement
that soil limitations posed by mica could be overcome by special design. The major concern
identified by these specialists was type of design and installation costs, not the severity of the
limitation.
11Other sources indicated mica sand was a poor sand source for construction materials. No new
or additional use and management statements were developed or are recommended.
C. Determine a list of soil properties or qualities that are affected by mica.
In conjunction with resource specialists, the MRT identified compaction, compression, strength,
slippage, erodibility, and piping/jugging as soil properties and qualities that could potentially be
affected by content and size of mica. Time did not allow for a thorough review of each of these
properties. Team efforts concentrated on soil strength, slippage, and erodibility.
Using the guides established in sections I. A. 1) and I. A. 2), soils were placed into four general
groups to evaluate performance and associated soil properties:
Group 1—Fine mica in a fine matrix Group 2—Fine mica in a coarse matrix
Group 3—Coarse mica in a fine matrix; Group 4—Coarse mica in a course matrix
(Fine mica is dominantly < 0.25 mm in diameter; coarse mica is dominantly 0.25 to 2.0 mm in diameter)
(Fine matrix ≥ 50 percent passing No. 200 sieve and ≥ 18 percent clay; coarse matrix is < 50 percent passing No.
200 sieve)
1) Soil Strength. Even though consensus exists that mica affects soil strength, its effect has
not been fully investigated or documented. For example, the “Pavement Design Guide for
Subdivision and Secondary Roads” (Virginia Department of Transportation), identifies mica, in
association with the AASHTO classification, as a factor when rating soil load support
characteristics (strength). No methodology for measuring mica is provided. Content is
determined by visual observations and subjectively identified as low, moderate, or high with
borderline cases decided by the District Materials Engineer, Virginia Department of
Transportation. No attempt is made to empirically quantify mica.
NRCS uses AASHTO Group Index (GI) to identify “low strength” as a soil limitation. For
example, a group index of ≤ 5 is considered not limiting, a group index of > 5 to < 8 is
considered somewhat limiting, and a group index of ≥ 8 is considered limiting for local roads and
streets. A total of 26 horizons of representative high-mica soils from the Southern Appalachian
Mountains and the Western Piedmont were submitted to the Soil Mechanics Laboratory, Ft
Worth, TX, for analysis. A review of the data indicated 20 of the samples (77 percent) had a
group index of < 5, 2 of the samples (8 percent) had a group index of 5 to < 8, and 4 of the
samples (15 percent) had a group index of > 8.
Of the samples with a “very limiting” rating, the AASHTO classification was A-7-5 and the
Unified classification was MH. The soils rated “somewhat limiting” had an AASHTO
classification of A-5 or A-6 and a Unified classification of ML. Soils with a “very limiting” rating
had a clay content of 40 percent or more and the soils with a “somewhat limiting” rating had a
clay content of 18 to 30 percent.
Mica is not the overriding factor in determining soil strength. The percent fines, liquid limit, and
plasticity index are the critical properties used in determining soil strength. The MRT concluded
that the incremental effect of additional amounts of mica or the varying size of mica cannot be
determined without further study. However, the MRT did conclude that significant amounts of
fine or coarse mica in association with a fine matrix (Groups 1 and 3) have a limiting effect on
soil strength.
122) Soil Slippage Potential. The hazard for soil slippage is used with the NASIS data structure.
Criteria used in the rating are in the National Soil Survey Handbook, Part 618, Exhibit 17. Soil
interpretations that use soil slippage as criteria to determine a restrictive feature are listed in
Exhibit 4 of this report. Criteria used in the NSSH rating guide (NSSH, Part 618, Exhibit 17)
center on topography and landform or geologic materials. The content and size of mica are not
considerations.
Exhibit 4 of the MRT report is a draft guide proposed for testing in MLRA136 and MLRA130.
The guide takes into consideration the increasing potential for soils to slide as slope, mica
content, and mica size (for a given particle size) increase.
The guide was developed early in the project and separates mica content into six groups. It is
offered only as an example of a general format to help identify the relative soil properties.
Criteria similar to this guide could be incorporated into the NSSH exhibit or a separate
independent supplement could be developed. Class assignment population in NASIS would be
based on the most limiting class determined by either the modified NSSH exhibit or an
independent supplement.
Another factor to consider, which was not implemented in the draft guide, is slope configuration.
As slope configuration differs from convex to linear to concave, internal water movement and
surface water movement are altered. Concentrated flow of water across or through high-mica
soils significantly affects slope stability.
The MRT recommends a guide for soil slippage potential be developed and tested that
incorporates criteria for content and size of mica and soil slope percent and
configuration.
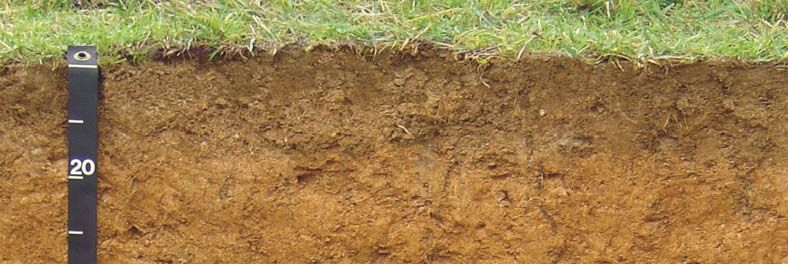
(3) Soil Erodibility. Observations of high-mica soil landscapes in humid environments indicate a
more “rounded” surface morphometry (fig. 8). Where severely eroded, high-mica soils tend to
form U-shaped gullies. Based on field mapping experience, several of the MRT members
indicated high-mica soils (under similar conditions) were more erosive than soils that contained
little or no mica. This was readily observable where the underlying soil materials (primarily C
horizons) had been exposed on the soil surface (fig. 9).
Figure 8. Rounded landscapes associated Figure 9. Saprolite underlying high-mica
with high-mica soils. soils.
13Soil erodibility factors (Kf and Kw) are used to identify the potential for soil erosion. These
factors are the basis for quantifying soil detachment and raindrop impact. The values assigned
to the individual factor are based on five soil properties: percent silt plus very fine sand, percent
very coarse sand, organic matter content, structure, and subsoil saturated hydraulic
conductivity. The Kw factor (whole soil) versus the Kf factor (fine-earth fraction) is adjusted for
the armoring effect of rock fragments. Where rock fragments exist, Kw is always less than Kf.
However, with high-mica soils, the fine-earth fraction is significantly affected not only by the size
and quantity of the sand grains but by the shape of the grains as well. The present criteria for
determining Kf does not take into consideration the shape of the sand grains. The MRT
concluded that adjusting the Kf factor for high mica content, possibly increasing the factor by
one class, was appropriate but outside the scope and objectives of this project.
The MRT recommends further investigation into modifying soil erosion factors (Kw and
Kf) based on particle shape.
The MRT concluded that mica most likely affects all of the properties identified; however, the
extent of the effect is not clearly understood or is not sufficiently documented. It was decided
that establishing erodibility class criteria for the aforementioned soil properties was outside the
expertise of the MRT; therefore, no specific recommendations for adjusting these properties are
offered. Onsite investigation and sampling of the soil for related engineering properties was
considered the best way to maximize soil performance.
D. Establish parameters, or ranges, for limitation classes and their appropriate class
separations.
From the beginning, the MRT struggled with consistently determining mica content in relation to
soil performance. What one person identified as 20 percent mica another person identified as
30 or 40 percent mica. This lack of consistency emphasizes the need for an agreed-to method
for determining mica content. However, the team was in general agreement as to the degree of
limitation mica posed at a particular site. In an effort to establish consensus among team
members, several techniques for characterizing mica were tested.
The traditional class separation of low, moderate, and severe was discussed as well as a green,
yellow, and red class separation. These classes correspond to management statements such
as (1) no additional management required, (2) mica content poses a management concern, and
(3) mica content poses a management limitation. In addition, an extensive effort was made to
coordinate and develop relational concepts within three main target areas—quantity of mica,
interpretive effect of mica, and taxonomic classification of high-mica soils.
Initially, a three-tiered class system was implemented. This seemed to fit best the way NRCS
has historically identified class separations. For example, quantity: few, common, or many;
interpretive class: not limited, somewhat limited, or very limited; and taxonomic class: mixed,
paramicaceous, or micaceous.
Several guides were tested, modified, and re-tested. Over time, it became apparent that as the
amount of variables or classes of variables considered increased, the likelihood of developing a
useable guide decreased. In addition, limited research in this area indicates a two-tiered
system (the soil is either affected or is not affected) may be all that is needed.
14From an engineering perspective, the relative effect of mica (Harris et al., 1984) is most
pronounced at lower levels (10 to 15 percent by weight) and tapers off significantly as levels
increase, indicating that additional classes are unnecessary. In subsequent research, Harris
and Zelazny (1985) recommended 10 percent by weight (grain count of 40) be implemented as
the break-point for non-micaceous/micaceous soils. This principal was supported by John Witty
(NRCS) in a letter addressing series differentia (07/05/1989). Dr. Witty suggested a separation
at 10, 12, or 15 be used as series criteria, depending on which value was considered critical for
interpretations.
If no more than two separations are needed, only one break-point is required. Below the break-
point, no mention of mica as an interpretive limitation is made. Above the break-point, mica is
identified as a management consideration with an appropriate statement such as, “Due to high
mica content, special planning and design may be necessary. On-site investigation is
recommended.”
The MRT recommends a two-tiered system be implemented when establishing
interpretive classes to separate high-mica soils from low-mica soils.
E. Choose methods (field, laboratory, etc.) for comparing soil conditions within the interpretive
control section.
See discussion provided in section 1. A. 1), 2), and 3) of this report.
3. NASIS Issues
A. Determine which NASIS data elements (primarily representative values) should be modified
in order to achieve appropriate soil interpretations.
Data elements within the NASIS data structure that are potentially affected by mica include soil
slippage potential, liquid limit, plasticity index, AASHTO rating, AASHTO Group Index, and
Unified Classification. These elements should be populated from hard data values as
determined from standard procedures of representative soils. No additional adjustment for grain
shape or quantity is required.
However, new data elements are needed to provide information related to mica, including
quantity (percent of area covered), size, and manner of failure. Presently, mica is described in
the “Pedon” module of NASIS in the Pedon Horizon Concentrations table. However, data
stored in NASIS “Data Mapunit” Component tables are typically used to generate soil
interpretations. Once the recommended addition of the inherited materials table to the Pedon
Horizon table has been made, the new table could be added as a subtable to the Component
Horizon table.
The MRT acknowledges modification of the NASIS data structure would be costly and would
require input from numerous individuals (i.e., soil scientists, programmers, etc.). However, the
team feels strongly that mica related properties should be captured in the NASIS data structure
and that data elements should be reflective of those properties identified by the team as being
important to interpreting the soil.
15The MRT recommends an appropriate procedure for capturing mica quantity, method of
measurement, size, and manner of failure in the NASIS data structure.
B. Determine NASIS reports needed to reflect soils influenced by mica.
Prior to the establishment of NASIS (National Soils Information System), interpretations were
generated from the SCS-Soil 5 form. This form identified soil properties and interpretations by
mapping phase. If a generated interpretation did not provide the anticipated result, the soil
property class used in rating the soil would be edited. For example, micaceous soils in western
North Carolina were thought to have low strength even though the generated interpretation did
not account for this.
If the associated values for liquid limit, plasticity index, and percent passing the No. 200 sieve
did not generate a severe rating, the class was simply changed to severe in the SOI-5
database. This produced the desirable class limit without modifying individual soil properties.
This was known as overriding the SOI-5. An asterisk was used to identify the override on the
printed SOI-5 form.
A similar override process does not exist in NASIS. This makes it necessary to incorporate all
soil properties critical to generating accurate soil interpretations into the database. To judge the
potential influence mica has on soil interpretations, the MRT reviewed the standard National Soil
Interpretation reports and the criteria used in rating soils.
A summary of the findings are provided in Exhibit 4. The first part of the exhibit identifies the
mica related factors (soil properties or qualities) identified by the MRT as important when
making a soil interpretation and the restrictive features generated within the report. Rating
classes (limitations, suitabilities, and potentials) are also identified.
The second part of the exhibit lists the national interpretive tables commonly used in published
soil survey reports and the web soil survey along with the soil property being evaluated and its
restrictive feature. Also included are notes made by the team for future criteria modification.
The MRT identified 16 interpretations where mica-related information would be beneficial. Most
interpretations could be improved by the addition of soil slippage potential as rating criteria;
others could be improved by the addition of the greasiness manner of failure classes.
Another option considered was the incorporation of a data element for mica content in order to
generate a rating class and restrictive feature statement without attempting to isolate a
particular soil property or quality. For a soil interpretation such as “local roads and streets” with
a rating of “not limited,” in place of modifying the present soil slippage potential guide and
adding the property to the criteria used when generating the report, simply add mica content as
restrictive feature.
For example:
Mica Content. Soils with high mica content affect the soil’s traffic-supporting capacity and slope
stability. The soil features considered are the family mineralogy class, and mica content of a
layer with RV clay < 18 and mica volume ≥ 35 percent or RV clay ≥ 18 and mica volume ≥ 20
percent. Evaluate layer thickness within 200 cm.
16Limiting ≥ 50 cm (or 100 cm)
Somewhat Limiting ≥ 25 cm
Not limiting < 25 cm
(e.g., Somewhat limited--high-mica materials or unstable materials)
There are several approaches to incorporating mica related soil properties into the NASIS data
structure, many of which are outside the scope of the MRT. The support and cooperation of
several key individuals from field staff, MO staff, and the National Soil Survey Center are
necessary in order to meet the needs identified in this report.
The MRT recommends a new workgroup be created to address NASIS data population
and soil interpretation issues.
4. Application--Soil Series Descriptions and Soil Classification
A. Revise existing series range in characteristics on a continuum to eliminate gaps in the
range of soil properties.
One of the soil properties historically used to separate soil series in the Southern Appalachian
Mountains is mica content. Many of these series have counterparts based on what was thought
to be interpretive differences (e.g., slope stability, soil strength, erodibility, etc.). For example,
the low-mica Evard series (fine-loamy, parasesquic, mesic Typic Hapludults) is considered a
counterpart to the high-mica Fannin series (fine-loamy, paramicaceous, mesic Typic
Hapludults). A key to the low- and high-mica soils is provided in Exhibit 6.
Evard soils have less than 20 percent mica throughout and Fannin soils have more than 20
percent mica in the B and C horizons. Soil components that have low mica in the upper part
and high mica in the lower part fall into a gap. Some have been included or mapped with the
Evard series since they do not have paramicaceous mineralogy, while others have been
included with the Fannin series, which is thought to be interpretively similar.
Before a universal correlation decision can be made, it is imperative that standard field
procedures for estimating mica and a method for laboratory conformation be established.
Procedures outlined in section 1. A. 1), 2) and 3) provide a method for consistent identification
of mica. Once these procedures are implemented, consistent correlation can follow. An
additional benefit to implementing an agreed-to procedure is that it allows for the review and
comparison of previously collected field data and laboratory datasets. Data from older surveys
can be compared to those being collected from on-going initial and update soil surveys.
The MRT identified the following three options for correlating soils with low mica in the upper
part (upper meter) and high mica in the lower part (lower meter):
(1) Correlate as a “high-mica substratum” phase of the referenced low-mica soil
(2) Correlate as a taxadjunct to the referenced high-mica soil
(3) Establish a new soil series
Options (1) and (2) are appropriate, but would require consistent application from survey area to
survey area. Option (3) allows for a more consistent approach.
17The MRT recommends establishing new series for those soils that have low mica content
in the upper part and high mica content in the lower part.
This recommendation will necessitate a review of published soil surveys and potential
maintenance of the spatial and tabular data. Potentially affected soil maps and the associated
database do not require immediate revision. This review and revision can be conducted over a
period of time as the soil survey program transitions from the traditional “once-over” soil survey
to the “new soil survey” and as MLRA soil survey project offices are established. Implementing
a creditable agreed-to procedure was considered more important than the time of transition.
B. Study taxonomic criteria and make necessary recommendations.
From the limited research available for high-mica soils, there is an indication that once a critical
threshold level has been reached, no additional influence is exhibited on soil performance, even
as mica content continues to increase (Harris, et al., 1984). Data from this research and
historical NRCS (SCS) communications indicate this critical threshold level may be lower than
the values presently assigned to the paramicaceous and micaceous mineralogy families.
Based on available data, the critical mica content for soil interpretations is most likely 40 percent
or more (by grain count). Soil taxonomy presently classifies a soil as paramicaceous if it has a
grain count value of 45 or more. The MRT concluded that this value is similar enough to the
values indicated in the present scientific literature that lowering the value to 40 percent (by grain
count), as suggested in some of the literature, is unnecessary.
Presently, there are 71 soil series identified as high mica in the upper part—53 in the
paramicaceous family and 18 in the micaceous family. Exhibit 6 has a detailed listing of these
series. No series correlated in the eastern U.S. could be identified as being established solely
on the basis of paramicaceous versus micaceous mineralogy. It is not anticipated that any
series would be dropped by reclassifying family mineralogy from paramicaceous to micaceous.
The MRT recommends eliminating the paramicaceous mineralogy family from Soil
Taxonomy and changing the definition of micaceous to “more than 45 percent (by grain
count) mica and stable mica pseudomorphs in the 0.02 to 0.25 mm fraction.”
Another consideration discussed by the MRT was the need to identify the type of mica, primarily
to differentiate between biotite and muscovite. Many team members thought that the
mineralogy of the mica may be a better key to soil performance than the quantity of mica once
the critical break-point had been reached. This concept was developed after several hours of
debate by the MRT and the comparison of soil performance observations by field soil scientists.
Proposed changes in section E of the mineralogy key in Soil Taxonomy are as follows:
E. All other mineral soil layers or horizons, in the mineralogy control section, that have:
1. More than 45 percent (by grain count) mica and stable mica pseudomorphs in the 0.02 to 0.25 mm
fraction; more than 75 percent of the total mica minerals are biotite.
Biotitic
or
182. More than 45 percent (by grain count) mica and stable mica pseudomorphs in the 0.02 to 0.25 mm
fraction; more than 75 percent of the total mica minerals are muscovite.
Muscovitic
or
3. More than 45 percent (by grain count) mica and stable mica pseudomorphs in the 0.02 to 0.25 mm
fraction.
Micaceous
Example: A Bt horizon that has 50 percent (by grain count) mica minerals composed of 40
percent Biotite and 10 percent Muscovite would be in a biotitic mineralogy family.
The MRT recommends the proposed mineralogy key be circulated for review and testing.
19Conclusions
The presence of mica in soils in significant amounts has traditionally been thought to affect soil
performance. In mountainous areas such as western North Carolina, eastern Tennessee,
Virginia, and other parts of the U.S. where high-mica soils exist, slope stability is a concern.
Soils high in mica and other platy minerals have low soil strength and are susceptible to
accelerated erosion and landslides. The major issues addressed by the Mica Research Team
include:
1) Micaceous soils can be identified in the field, but recording properties in the
morphological description that quantify the problem is difficult. Methods for describing
mica are inconsistent and often the zone where the limiting properties occur are below
the depth of observation.
2) Quantification of mica and identification of criteria to reliably predict interpretive
problems remains elusive. A single particle-size fraction is commonly quantified in
laboratory analysis (by grain count) and this value is equated to the mica content in the
total sand and silt. An additional problem is the correlation of mica by volume, grain
count, and weight percent.
3) Consistent correlation and classification of high-mica soils from region to region cannot
be accomplished without standard conventions.
The MRT was assembled to address these and other mica-related issues. Starting in the
summer of 2003, the MRT has made a concerted effort to develop a methodology for field soil
scientists to consistently describe mica and its associated properties.
In summary, the MRT concluded the best approach to identification of mica-affected soils may
be to separate only low- from high-mica soils. Research does not tend to support the need for
additional separations. The critical issue identified by the MRT is consistent documentation of
mica. Using the procedures described in this report, content estimates can be confirmed by
laboratory grain counts. Soil mechanics data can be used to confirm soil properties that may
pose soil limitations. Provisions need to be made that will allow for the types of data identified in
this report to be recorded in the NASIS data structure.
The MRT also reviewed soil interpretations as provided in standard soil survey reports and the
web soil survey. Until such time as the recommendations in this report or other similar
procedures are established, generated soil interpretations will not adequately reflect the
limitations posed by high mica content. Additional work in this area remains.
Members of the MRT appreciate the opportunity to have participated in this project and
acknowledge the strong administrative support of MO-14 and MO-18. Staff from the National
Soil Survey Center, Soil Survey Laboratory, and other resource specialists greatly contributed to
the team’s accomplishments. Many of the concepts and methods evaluated by the team are a
direct result of conversations with and suggestions by these individuals.
Submitted by:
20REFERENCES
Harris, W.G., J.C. Parker, and L.W. Zelazny. 1984. Effects of mica content on engineering
properties of sand. Soil Sci. Soc. Am. J. 48:501-505.
Harris, W.G., and L.W. Zelazny. 1985. Criteria assessment for micaceous and illitic classes in
soil taxonomy. p. 147-160. In J.A. Kittrick (ed.) Mineral classification of soils. 1985. Soil Sci. Soc.
Spec. Pub. 16.
Harris, W.G., L.W. Zelazny, J.C. Baker, and D.C. Martens. 1985. Biotite kaolinization in Virginia
Piedmont soils: I. Extent, profile trends, and grain morphological effects. Soil Sci. Soc. Am. J.
49:1290-1297.
Kretzschmar, R., W.P. Robarge, A. Amoozegar, and M.J. Vepraskas. 1997. Biotite alteration to
halloysite and kaolinite in soil-saprolite profiles developed from mica schist and granite gneiss.
Geoderma 75:155-170.
Materials Division, Virginia Transportation Research Council, and Secondary Roads Division.
2000. Pavement design guide for subdivision and secondary roads in Virginia. Virginia
Department of Transportation.
Rebertus, R.A., and S.W. Buol. 1989. Influence of micaceous minerals on mineralogy class
placement of loamy and sandy soils. Soil Sci. Soc. Am. J. 53:196-201.
Soil Survey Division Staff. 1993. Soil survey manual. Soil Conservation Service. U.S.
Department of Agriculture Handbook 18 [Online]. Available:
http://soils.usda.gov/technical/manual/ (verified 4 May 2006).
Soil Survey Staff. 1999. Soil taxonomy: A basic system of soil classification for making and
interpreting soil surveys. 2nd edition. Natural Resources Conservation Service. U.S.
Department of Agriculture Handbook 436.
U.S. Department of Agriculture, Natural Resources Conservation Service, 2005. National Soil
Survey Handbook, title 430-VI [Online]. Available: http://soils.usda.gov/technical/handbook/
(verified 4 May 2006).
21SUMMARY OF RECOMMENDATIONS
The following recommendations have been reviewed by the project participants and are
supported by the mica research team:
Soil Survey Standards Issues
1. Evaluate and record content of mica in all pedon descriptions, where present, and identify
the method of measurement (e.g., comparison to quantity chart, conversion from grain count
data, etc.).
2. The MTR recommends evaluation and conformation of the quantity charts provided in the
Field Book for Describing and Sampling Soils.
3. Drop mica by weight as measurement criteria used for mineralogy families in Soil
Taxonomy.
4. Make standardized samples of micaceous soils available to field soil scientists so they can
be used for comparison and calibration of mica content and size.
5. Establish a separate property table for “Inherited Materials” for point and aggregate data as
used in the NASIS data structure, Soil Survey Manual, National Soil Survey Handbook, Soil
Taxonomy, etc.
6. Add “micaceous” to the list of other compositional texture modifiers as used in the NASIS
data structure, Soil Survey Manual, National Soil Survey Handbook, Soil Taxonomy, etc.
7. Add “mica flakes” to the Pedon Horizon Fragment-Kind choice list in NASIS Pedon.
8. Add greasiness classes to the manner of failure classes in the Soil Survey Manual.
9. Develop and test a guide for soil slippage potential that incorporates criteria for mica content
and size and soil slope percent and configuration.
10. Implement a two-tiered system when establishing interpretive classes to separate high-mica
soils from low-mica soils.
11. Identify appropriate methods for capturing mica quantity, method of measurement, size, and
manner of failure for incorporation into the NASIS data structure.
12. Create a new workgroup to address NASIS data population and soil interpretation issues.
13. Establish new series for those soils that have low mica content in the upper part and high
mica content in the lower part.
14. Eliminate the paramicaceous mineralogy family from Soil Taxonomy and change the
definition of micaceous to “more than 45 percent (by grain count) mica and stable mica
pseudomorphs in the 0.02 to 0.25 mm fraction.”
15. Circulate proposed revision of the mineralogy key for review and testing.
22You can also read