Republic of Belarus February 2018 - Investor Presentation / February 2018
←
→
Page content transcription
If your browser does not render page correctly, please read the page content below
RepublicofofBelarus
   Republic      Belarus
Investor Presentation / February 2018
          February 2018
Disclaimer

THIS PRESENTATION HAS BEEN PREPARED AND IS PROVIDED EXCLUSIVELY BY THE REPUBLIC OF BELARUS (THE “REPUBLIC") AND IS CONFIDENTIAL. IT MAY NOT BE FORWARDED OR DISTRIBUTED WITHOUT THE PRIOR EXPRESS
CONSENT OF THE REPUBLIC. NO OTHER ENTITY, WHETHER INVOLVED IN THE USE OF THIS PRESENTATION OR NOT, HAS PARTICIPATED IN THE PREPARATION OF THIS PRESENTATION AND ASSUMES ANY LIABILITY ARISING HEREUNDER.
IF THIS PRESENTATION HAS BEEN RECEIVED IN ERROR IT MUST BE RETURNED IMMEDIATELY TO THE REPUBLIC AND ANY COPIES SHALL BE DESTROYED.

INFORMATION IN THIS COMMUNICATION IS NOT BASED ON INDIVIDUAL CIRCUMSTANCES OF ANY RECIPIENT AND SHOULD NOT BE RELIED UPON AS AN ASSESSMENT OF SUITABILITY FOR ANY SUCH RECIPIENT OF A PARTICULAR
(FUTURE) PRODUCT OR TRANSACTION. IT DOES NOT CONSTITUTE INVESTMENT ADVICE AND DOES NOT INTEND TO CONTAIN INFORMATION AS TO THE SUITABILITY OF ANY (FUTURE) PRODUCTS OR TRANSACTIONS NOR DOES IT
PURPORT TO IDENTIFY ALL THE RISKS ASSOCIATED WITH ANY (FUTURE) PRODUCT OR TRANSACTION. THIS COMMUNICATION IS NOT TO BE SEEN AS A COMMITMENT BY ANY ENTITY (INCLUDING THE REPUBLIC) WITH RESPECT TO ANY
(FUTURE) PRODUCT OR TRANSACTION AND SHOULD NOT BE CONSIDERED AS A SOLICITATION OR OFFER WITH RESPECT TO ANY (FUTURE) PRODUCT OR TRANSACTION. ANY DECISION TO PURCHASE ANY (FUTURE) PRODUCT OR ENTER
INTO ANY (FUTURE) TRANSACTION SHOULD BE BASED UPON THE INFORMATION CONTAINED IN ANY ASSOCIATED OFFERING DOCUMENT. PRIOR TO DEALING IN ANY (FUTURE) PRODUCT OR ENTERING INTO ANY (FUTURE)
TRANSACTION, THE ECONOMIC RISKS OR MERITS, AS WELL AS THE LEGAL, TAX AND ACCOUNTING CHARACTERISTICS AND CONSEQUENCES AND INDIVIDUAL APPROPRIATENESS SHOULD BE CONSIDERED AND IT SHOULD BE ENSURED
THAT THE RELEVANT RISKS CAN BE ASSUMED.

THIS PRESENTATION CONTAINS FORWARD-LOOKING STATEMENTS. THE WORDS “BELIEVE”, “EXPECT”, “ANTICIPATE”, “INTEND”, “PLAN” AND SIMILAR EXPRESSIONS IDENTIFY FORWARD-LOOKING STATEMENTS. ALL STATEMENTS OF
FACTS INCLUDED IN THIS PRESENTATION INCLUDING, WITHOUT LIMITATION, THE REPUBLIC’S ECONOMY, FISCAL CONDITION, POLITICS, DEBT OR PROSPECTS MAY CONSTITUTE FORWARD-LOOKING STATEMENTS. SUCH FORWARD-
LOOKING STATEMENTS INVOLVE KNOWN AND UNKNOWN RISKS, UNCERTAINTIES AND OTHER FACTORS WHICH MAY CAUSE THE REPUBLIC’S ACTUAL RESULTS, PERFORMANCE OR ACHIEVEMENTS TO BE MATERIALLY DIFFERENT FROM
ANY FUTURE RESULTS, PERFORMANCES OR ACHIEVEMENTS EXPRESSED OR IMPLIED BY SUCH FORWARD-LOOKING STATEMENTS. SUCH FORWARD-LOOKING STATEMENTS ARE BASED ON NUMEROUS ASSUMPTIONS (NOT ALL OF
WHICH ARE SPECIFIED HEREIN OR CAN BE ASCERTAINED AT THIS TIME) REGARDING THE REPUBLIC’S PRESENT AND FUTURE STRATEGIES AND THE ENVIRONMENT IN WHICH THE REPUBLIC WILL OPERATE IN THE FUTURE.
FURTHERMORE, CERTAIN FORWARD-LOOKING STATEMENTS ARE BASED ON ASSUMPTIONS OR FUTURE EVENTS WHICH MAY NOT PROVE TO BE ACCURATE. AS A RESULT, ANY FORWARD-LOOKING STATEMENTS ARE INDICATIVE AND
FOR INFORMATION AND/OR DISCUSSION PURPOSES ONLY. THE FORWARD-LOOKING STATEMENTS IN THIS PRESENTATION SPEAK ONLY AS OF THE DATE OF THIS PRESENTATION AND MIGHT BE SUBJECT TO CHANGE WITHOUT NOTICE.

THIS PRESENTATION IS NOT DIRECTED TO, OR INTENDED FOR DISTRIBUTION TO OR USE BY, ANY PERSON OR ENTITY THAT IS A CITIZEN OR RESIDENT OR LOCATED IN ANY LOCALITY, STATE, COUNTRY OR OTHER JURISDICTION WHERE
SUCH DISTRIBUTION, PUBLICATION, AVAILABILITY OR USE WOULD BE CONTRARY TO LAW OR REGULATION OR WHICH WOULD REQUIRE ANY REGISTRATION OR LICENSING WITHIN SUCH JURISDICTION.

THE INFORMATION IN THIS PRESENTATION HAS NOT BEEN INDEPENDENTLY VERIFIED. THE INFORMATION AND OPINIONS HEREIN ARE BELIEVED TO BE RELIABLE AND HAVE BEEN OBTAINED FROM SOURCES BELIEVED TO BE RELIABLE,
BUT NO REPRESENTATION OR WARRANTY, EXPRESS OR IMPLIED, IS MADE WITH RESPECT TO THE FAIRNESS, CORRECTNESS, ACCURACY, REASONABLENESS OR COMPLETENESS OF THE INFORMATION AND OPINIONS. THERE IS NO
OBLIGATION TO UPDATE, MODIFY OR AMEND THIS PRESENTATION OR TO OTHERWISE NOTIFY THE RECIPIENT IF ANY INFORMATION, OPINION, PROJECTION, FORECAST OR ESTIMATE SET FORTH HEREIN CHANGES OR SUBSEQUENTLY
BECOMES INACCURATE. ALL PROJECTIONS, VALUATIONS AND STATISTICAL ANALYSES ARE PROVIDED TO ASSIST THE RECIPIENT IN THE EVALUATION OF MATTERS DESCRIBED HEREIN. THEY MAY BE BASED ON SUBJECTIVE
ASSESSMENTS AND ASSUMPTIONS AND MAY USE ONE AMONG ALTERNATIVE METHODOLOGIES THAT PRODUCE DIFFERENT RESULTS AND TO THE EXTENT THEY ARE BASED ON HISTORICAL INFORMATION, THEY SHOULD NOT BE
RELIED UPON AS AN ACCURATE PREDICTION OF FUTURE PERFORMANCE. PAST PERFORMANCE IS NOT INDICATIVE OF FUTURE PERFORMANCE. NONE OF THE REPUBLIC, THEIR RESPECTIVE ADVISERS, CONNECTED PERSONS OR ANY
OTHER PERSON ACCEPTS ANY LIABILITY WHATSOEVER FOR ANY LOSS HOWSOEVER ARISING, DIRECTLY OR INDIRECTLY, FROM THIS PRESENTATION OR ITS CONTENTS. THE INFORMATION CONTAINED HEREIN IS SUBJECT TO CHANGE
WITHOUT NOTICE.

THIS PRESENTATION SHALL NOT BE INTERPRETED AS AN INVESTMENT RESEARCH IN ACCORDANCE WITH ART 24 OF DIRECTIVE 2006/73/EC AND ANY PROVISIONS APPLICABLE THERETO HAVE NOT BEEN TAKEN INTO CONSIDERATION.
DIRECTIVES ON THE INDEPENDENCE OF RESEARCH DO NOT APPLY.

                                                                                                      2
Contents
Key Highlights
Economic Landscape
Monetary Policy and the Banking Sector
Government Budget
Public Debt
3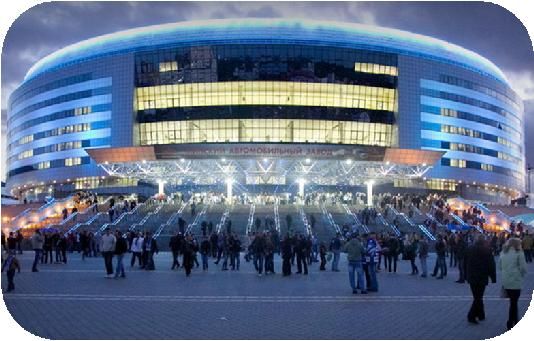
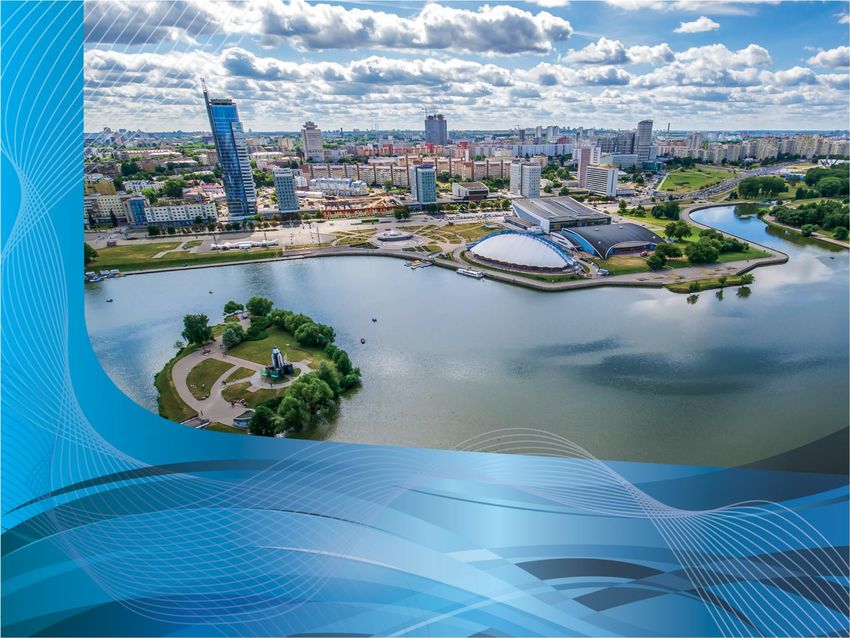
Key Highlights

                     Minsk-Arena Ice Hoсkey Complex

                 4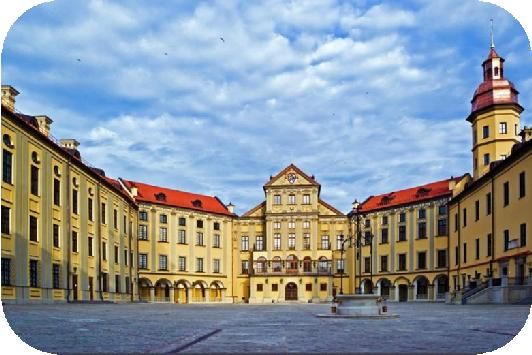
Overview
Geographical Position                                                                     Key Indicators - 2017
                                                                                                                                                                 2
                                                                                          Area                                                     207,595 km
                                                                                          Population                                                    9.5 mn
                                                                                          Currency (as of 13.02.2018)                           USD/BYN = 1.9959
                                                                                                                                            B (Stab.) / B (Stab.) / Caa1
                                                                                          Current Credit Ratings (S&P/F/M)
                                                                                                                                                       (Stab.)
                                                                                          GDP, USD bn ¹                                      54.4 bn (BYN 105.2 bn)
                                                                                          GDP growth y-o-y ¹                                            2.4%
                                                                                          GDP per capita, USD (PPP), thsd. ²                             18.6
                                                                                          Foreign trade turnover ³, USD bn                               63.4
                                                                                          Industrial production, % of GVA                               31.0%
                                                                                          Inflation, Dec / Dec ¹                                        4.6%
                                                                                          Budget balance, % of GDP ¹                                    3.0%
                                                                                          Public debt, % of GDP                                         39.3%
                                                                                          External public debt, % of GDP                                30.7%

 Key Historical Events
                                                                                                           Foundation of           National        S&P upgrades            Fitch
                   Treaty on Establishing the                     USD 3.5 bn IMF Establishment of the      the Eurasian                            Belarus to “B”/         upgrades
                                                                                                                                   Human Rights
                                                                                                                                                   Stable                  Belarus to
                   Union State of Belarus and                     SBA            Customs Union of Belarus, Economic Union          Strategy
                                                                                                                                                   USD 1.4 bn              “B”/Stable
Independence       Russia Signed                                  Programme      Kazakhstan and Russia     Presidential vote       approved
                                                                                                                                                   Eurobonds issued        OECD⁵
                                                                  agreed
                                                                                                                                                                           upgrades
  1991 1992
        1992               1997         2000                      2007        2009         2010 2011                           2015    2016       2017 2018                Belarus to 6th
                                                                                                                                                                           credit risk
                                                                                                                                                                           group
Membership Belarus became       Creation of the EurAsEC S&P and Moody’s          Debut USD 1.0 bn      USD 3.0 bn               Parliamentary            Visa-free 10-day
in the CIS a member of          (Belarus, Russia,       ratings assigned         Eurobond issue        ACF                      elections                entry to Brest and
           the IMF and          Kazakhstan, Kyrgyzstan,                                                Stabilisation            Redenomination           Grodno regions
           the World Bank       Tajikistan)                                                            Programme                of the BYN               introduced for
                                                                                                                                USD 2.0 bn EFSD⁴         77 countries, incl.
                                                                                                                                Programme signed         EU and US
                                                                                                                                Fitch rating assigned

Sources: National Statistical Committee of the Republic of Belarus, National Bank, Ministry of Finance, International Monetary Fund (“IMF”)
¹ On a preliminary basis. ² IMF estimate. ³ Includes data on trade of goods. ⁴ Eurasian Fund for Stabilisation and Development. ⁵ Organisation for Economic Cooperation
and Development
                                                                                      5
Key Investment Highlights

                       Industry oriented economy, supported by skilled human capital

                             Economy returned to growth path, prudent policies resulted in macroeconomic
                             stabilisation

                                  Fiscal discipline and conservative debt management reflected in continuous
                                  budget surplus, manageable debt level and proven track record of debt servicing

                                         Key structural and SOE¹ reforms are on track with notable progress. Stable
                                         government and institutional capacity to drive further reforms

                                         Deep network of IFI and bilateral partners continues to be broadened and
                                         diversified

                                  External liquidity position has stabilised and strengthened through proactive
                                  government policy and external financing

                             Investor friendly environment evident in high FDI per capita, as compared to peer
                             countries. Continued deepening economic cooperation with China

¹ State owned enterprises

                                                             6
Successful Macroeconomic and Fiscal Stabilisation
Despite recent externally-driven headwinds, Belarus has managed to restore its macroeconomic stability and foreign trade. In 2017,
the country resumed its economic growth

 Record Low Inflation                                    Narrowing Current Account Deficit                           Strengthened Foreign Reserves
 CPI, % Dec / Dec                                        Current Account Balance, % of GDP                           USD bn

                                                                                                         -0.9%
     21.8%                                                                                                                8.1
                                                                 -2.9%                                                                                                 7.3
                                                                                                     -3.6%
             16.5%                                                                          -3.2%                                   6.7
                           16.2%                                                    -6.9%                                                    5.1             4.9
                                   12.0% 10.6%                                                                                                       4.2
                                                                           -10.4%
                                               4.6%

 2012     2013      2014     2015     2016 2017E             2012     2013    2014      2015      2016      9M         2012       2013    2014     2015      2016     2017
                                                                                                           2017

 Robust Public Finance Position                            Manageable and Stable Debt                                Return of Real Growth
 Public Sector Budget Balance, % of GDP                    % GDP                                                     Real GDP Growth, % Y-o-Y

                                                                    Public Debt           Gross External Debt¹
                                             3.0%                                                 78.5% 74.8%                                                       2.4%
                                                                                          67.3%                       1.7%                 1.7%
                                                                                                                                 1.0%
                                                            51.5% 52.7%         50.9%
                            1.5%      1.5%                                                        39.4% 39.3%
                                                                                          32.5%
                    1.1%
 0.7%                                                       23.7% 22.4%         22.3%                                                                              -2.5%
          0.2%                                                                                                                                       -3.8%

 2012     2013      2014     2015      2016    2017E         2012     2013     2014       2015    2016     2017      2012        2013     2014     2015    2016      2017E

Source: National Statistical Committee, National Bank, Ministry of Finance
¹ Includes total debt of the General Government, Central Bank, deposit organisations and other sectors. Data as of 30.09.2017.

                                                                                      7
Single B Rating with a Strong Credit Profile

GDP per Capita, USD thsd, 2017E                                                          Public Debt, % of GDP, 2017

           5.9                                                                                                                          59.0
                                     5.6
                                                                                                                           47.3

                                                               3.5                                    39.3

        Median BB                  Belarus                  Median B                                Belarus              Median BB    Median B

Budget Balance, % of GDP, 2017E                                                          Current Account, % GDP, 2017E
5

4

            3.0
3

2

                                                                                                                                       -2.5
                                                                                                                           -0.9¹
1

0

                                      -3.0                                                           -4.2
-1

-2

                                                                -4.0
-3

-4

          Belarus                 Median BB                  Median B                              Median B              Belarus     Median BB

Sources: S&P - Sovereign Risk Indicators (14 December 2017 ), Ministry of Finance, National Statistical Committee, IMF
¹ 9M 2017 data.

                                                                                     8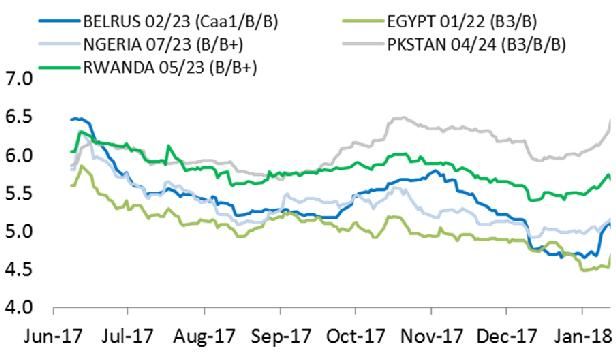
Recent Foreign Policy Developments
Relations with the EU
Trade and industrial cooperation increased. Textile quotas for Belarus were abolished in February 2017
Within EU’s technical assistance programmes Belarus can apply for EUR 29 mn annually
European Investment Bank’s mandate was extended to Belarus
Ongoing negotiations on simplification of visa procedures and on readmission - most issues have been agreed and a draft
agreement is under preparation
High-level memorandum of understanding (“MoU”) on the extension of TEN-T network to Belarus
Belarus joined the Eastern European Energy Efficiency and Environment Partnership (E5P), funded by the EU
The EU will allocate EUR 3 mn for a project, supporting the economic policy of Belarus. The project will involve the World Bank
and will be running in 2018-2020
Relations with China: “One Belt, One Road“ Initiative
Development of industrial projects, similar to the Great Stone Industrial Park
Signing agreements allowing participation of Chinese investors in the capital structure of Belarusian companies
Relations with the World Trade Organisation
Belarus has accelerated its negotiations with the World Trade Organisation (“WTO”). As of December 31, 2017, 16 bilateral
market access protocols with WTO members had been successfully closed
Bilateral protocols with China, the EU and the US are expected to be concluded in 2018 – 2019, with a goal of becoming a WTO
member by 2019 year-end
Relations with the OECD
Belarus’ position in organization’s country risk classification improved in January 2018
9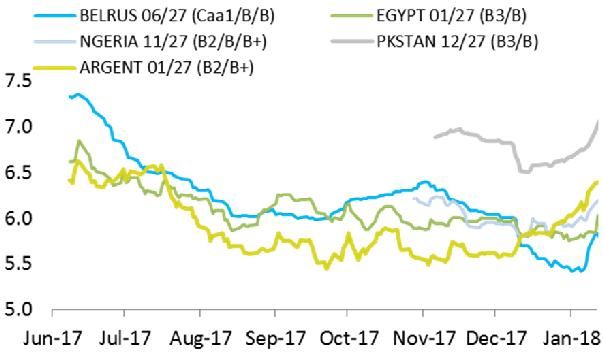
Economic Landscape

                          BelAZ 75710 – the world’s largest haul truck

                     10
Highly Diversified and Industry Focused Economy
Notable results in industrial production growth and exports have driven the economic growth of Belarus in 2017
Industry Structure, % of Total Industrial
Export Destinations, 2017¹ Production, 2017E
Food, beverages and tobacco Mining & metallurgical
24.8% production 7.7%
Russia 43.9%
Others 9.2% Textiles, clothing,
leather, fur 3.9%
Wood and paper Machinery,
products, vehicles &
Others 17.7% printing 4.0% equipment 9.4%
Coke & refined
Electricity, gas, steam, petroleum,
hot water and air chemical, rubber &
Ukraine 11.5% conditioning supply 9.1% plastic, mineral
EU 26.9%
non-metallic products
31.8%
Exports and Imports Structure, 2017 Components of GDP, %
100%
95%
Exports Imports 85%
48% 51% 52% 52%
70% 54% 55% 70%
Means of transport 8.7% Minerals 29.0%
Machinery 9.4%
Metals 7.0% Food 55%
products
Food Other 15.3% 13.2% 45%
40% 33%
Products 37% 29% 25% 22%
16.6%
Other 15.4% 33%
Chemical 25%
Chemical products 20%
products 14.6% 10%
Minerals 24.6% 14% 13% 14% 15% 16% 15%
18.4% 0%
Metals 10.0% Machinery 17.8% -5% -5%
2012 2013 2014 2015 2016 9M '17
Households Gross fixed capital formation
Statistical discrepancy Net exports
Source: National Statistical Committee Inventory changes Non-profit institutions
General government GDP growth (RHS)²
¹ Exports of goods.
² Represents year-end growth for 2016 and 2017E
11Belarus is on a Path of Economic Growth
Proactive actions taken by the Government mitigated the negative impact of external shocks on the economy and established a
foundation for growth. Belarus possesses a vast growth potential based on development of private sector, effective foreign
investments, financial market development and new technologies.
Real GDP Growth, % Y-o-Y
Real GDP growth in 2017, according to preliminary estimates, has
2.4
been positive (+2.4% YoY), after two years of economic downturn. 1.7 1.7
The key drivers behind the GDP performance include the stronger 1.0
industrial sector output, increased exports (+22% 9M 2017), in
particular, higher prices of oil and oil products (key components of
the Belarus’ exports) and the economic recovery of the main trading
partners of Belarus – Russia, the EU and Ukraine
Industrial growth of +6.0% in 2017 was mainly attributed to sectors
-2.5
such as machinery and equipment (+25%), wood & paper products
(+14%), pharmaceutical (+12%) and chemical (+11%) products. At -3.8
the same time, improvements in quality parameters, such as
profitability, net profits and lower inventory levels are also óbserved 2012 2013 2014 2015 2016 2017E
Additionally, consumer demand, underpinned by the credit growth
in the banking sector has aslo had a positive effect on the
rebounding of the economy in 2017
GDP per Capita (USD thsd PPP), 2017E GDP Composition by Economic Sector
27.9
26.1 12% 12% 12% 13% 14% 13%
24.1
24% 27% 28% 30%
18.6 32% 31%
17.4
15.2 6% 6% 6%
13.0 14% 6% 6% 6%
14% 12% 12% 10%
10.6 11%
29% 26% 25% 25% 27%
25%
7% 10% 10% 8% 6% 5%
8% 7% 7% 6% 7% 8%
2012 2013 2014 2015 2016 2017
Agriculture, forestry and fishing Construction
Industry Trade
Transport Services
Net taxes on products
Sources: National Statistical Committee, Ministry of Economy, IMF for “GDP per Capita (USD thsd PPP), 2017”
12The Government has Prioritized Attracting FDI
…and has put in place arrangements that are expected to have positive impact on FDI in the coming years. Additionally, Belarus has
taken recent steps to lift restrictions on profit repatriation.
FDI Inflow, USD bn / % Net FDI per Capita 2012 – 2016 Average, USD thsd
2.9 2.9
2.7 470
2.3 2.3
2.1
318
2.2 289
235
1.8 1.6 164 153
1.4 1.3 1.2
58
2012 2013 2014 2015 2016 2017
-78
Net FDI (USD) Net FDI/GDP (%) Kazakhstan Serbia Croatia Georgia Belarus Azerbaijan Egypt Russia
FDI Inflows by Country, 2017¹ FDI Inflows by Sector, 2017¹
Communications
6.1% Other 7.4%
Russia 37.3%
Other 9.2% Industrial sector
15.8%
Wholesale and
China 1.5% retail; repairs
Germany 1.1% Netherlands 1.1% of cars &
Austria 1.5% motorcycles 46.7%
Latvia 1.5%
CIS (other than Lithuania 2.4% Transport
Russia) 3.6% activities 24.0%
UK 32.2%
Cyprus 8.6%
Sources: National Statistical Committee, National Bank, IMF for countries other than Belarus
¹ Excluding the banking sector.
13IT Sector is Steadily Growing and has a Prominent Role in the Economy
Belarus has become a leading Eastern European IT hub and the development of the sector is prioritised by the Government
IT sector highlights Belarus Hi-Tech Park
Providing services globally to 60+ of Fortune’s 200 largest
32,000
companies
software engineers employed in the IT sector of the HTP
HTP residents with foreign or joint ownership amount to 59%
> USD 1.0 bn of the total 192 resident companies
HTP software and IT-services export expected in 2017 91% of the software products of HTP are exported
20x Preferential treatment for resident companies:
increase export volume between 2006 and 2016 - favourable tax regime until 2020 (incl. exception from income
tax and VAT)
Top 9 - lower personal income tax
in Primary Locations for Outsourcing & Service Delivery centres
in EMEA¹ - exterritorial principle of registration
- access to qualified workforce
Decree on Development of Digital Economy
Adopted in December 2017² IT Services Growth
ICO and Export of IT services, USD mn
Self-driving Capital flow
tokens Share of IT services, % of total export of services
vehicles deregulation
to be allowed 120 0
14%
16
14
100 0
12
Attraction of 800
957.5
Venture
10
IT-education foreign IT-
investment
600 8
5%
specialists 400
6
2% 4
200
47.9 274.1
2
Blockchain
0 0
‘English law’ 2006 2011 2016
technology
¹ According to the global IT research and consultancy company Gartner
² To come in force in March 2018
14Continuing the Constructive Dialogue with the IMF
… with a view of further implementation of crucial economic reforms.
Current status
Annual consultations under Article IV of the IMF`s Articles of Agreement held in October - November 2017
Belarus and the IMF agreed on the direction and scope of required policy measures, keeping different views on the pace of their
implementation
IMF Directors welcomed the progress made in strengthening financial sector’s stability, narrowing the current account deficit,
growing the foreign reserves as well as stronger monetary policy and inflation targeting results achieved by the Government and
National Bank of Belarus
The IMF raised its 2018 growth forecast for the economy of Belarus to 1.8% (from below 1.0%)
In 2018, the IMF will continue to provide technical assistance to Belarus, in particular, in respect to monetary policy modelling
process
Discussions toward an IMF`s Extended Fund Facility programme are on hold.
Completed reforms in line with recommendations Areas of recommended improvement
Financial sector action plan detailing measures and
timeframe for each of the FSAP 2016 recommendation
Speed of structural reforms
New Emergency Liquidity Assistance framework
Utility tariffs adjustment
Targeted social support programme, offsetting utility Budget policy and public debt management, in line
reforms with recommended deficit and debt levels
Central fiscal risk function set up at the Ministry of Finance
Further financial stability due to the still high NPLs
SOE legislation amended and dollarization of the economy
2017 budget execution expected with a surplus
15Belarus Follows a Systematic Reform Process
…to achieve macroeconomic stability and build a foundation for growth.
Reforms implemented in 2016 - 2018
Generally abolished
Price regulation
(save for social important goods within 90 days during the year)
Utility tariffs for households Increased
FX export revenues The share of surrender requirement decreased from 30% to 10%
Gradual increase of the retirement age from January 2017 by six months till target
Pensions
age of 63 / 58 years for men / women is reached
Public finance management Transition to medium-term (three-year) performance-oriented budget planning
Measures aimed at entrepreneurship development, stimulating business activity and
Business environment
ease of administrative barriers for doing business
Implementation of a wide range of reforms, concerning tranfer pricing, VAT invoicing,
Taxation
taxes on gambling, tax controls
Government plans for structural transformations by 2020
1 SOE reform and privatisation process 5 Improvement of the financial market
2 Enhancement of market competitiveness 6 Adoption of fiscal risks’ assessment system
3 Full utility cost recovery (except heating) 7 Continuous
environment
improvement of the business
Reforms of the labour market and social
4 Phasing-out of directed lending 8 safety nets
In addition, the Government intends to terminate subsidies to utility sector by 2025
Source: Ministry of Finance
16Monetary Policy and the Banking
Sector
National Bank’s commemorative coins – repeated
winners of international contests
17Reserves Have Strengthened
…as a result of proactive policy and efforts to attract external liquidity. In 2017, the consolidation of positive trends in the economy
and monetary sector continued. Domestic foreign exchange market is functioning steadily and the foreign currency supply
consistently exceeds the demand.
BYN / USD Exchange Rate Dynamics¹ The main objective of the monetary policy of the National
BYN Bank of the Republic of Belarus (the “National Bank”) is to
2,5 redenomination provide price stability
In 2015, the National Bank switched from a crawling peg of
2,0 the BYN to a floating exchange rate regime
Interventions of the National Bank are limited and done only
1,5 Official to smoothen out the currency basket² trading
exchange rate In 2017, Belarus replenished its foreign exchange reserves via
1,0 (13.02.2018): dual-tranche Eurobond transaction. Gold and foreign
1.9959
exchange reserves have grown by USD 2.4 bn in 2017 to USD
0,5 7.3 bn or 2.5 months of import cover as of January 1, 2018.
янв.12 янв.13 янв.14 янв.15 янв.16 янв.17 янв.18 The target is to reach 3.0 months of import cover by 2020
International Reserves and M2 Development, USD
10,0 Foreign reserves as of 01.01.2018
(preliminary data): USD 7.3 bn
8,0
6,0
4,0
2,0
0,0
Jan-15 Jun-15 Nov-15 Apr-16 Sep-16 Feb-17 Jul-17 Dec-17
International Reserve Assets, USD bn M2³, USD bn
Source: National Bank (https://www.nbrb.by/engl/statistics/MonetaryStat/BroadMoney/ ; https://www.nbrb.by/engl/statistics/Rates/RatesDaily.asp ;
https://www.nbrb.by/engl/statistics/ReserveAssets/assets.asp)
¹ Redenominated values. ² Set as of November 1, 2016 as: RUR – 50% (from 40%), USD – 30% (unchanged), EUR – 20% (from 30%)
³M2 data converted in USD using the official exchange rates of the BYN for respective months.
18Monetary Policy Measures Have Successfully Brought the Inflation Down
Consumer inflation has decreased from 10.6% in 2016 to a record low level of 4.6% in 2017E. Price stability remains a key priority for
the National Bank
CPI (Dec/Dec) and IPPI Trends Guidelines
21.8 The CPI growth in annual terms decreased two-fold to an
20.6 16.5 17.0 estimated 4.6% in December 2017, compared to 10.6% in
16.2
12.0 December 2016. This was the lowest inflation level on
10.7 10.6 11.2
13.5 record since the early 1990s
8.9 4.6
The target for 2018 is to keep the inflation rate not higher
than 6.0%
2012 2013 2014 2015 2016 2017E
The National Bank envisages gradual introduction of
CPI IPPI inflation targeting in the middle-term and the changes in
monetary aggregates in 2017 reflected the policy of control
of money supply, which is part of this medium-term goal
CPI Inflation was Significantly Lower in 2017 and is in Line with Peers
23.5
12.0
7.3
6.0
4.6¹ 4.2 3.4
1.1
Egypt Azerbaijan Kazakhstan Georgia Belarus Russia Serbia Croatia
Source: National Statistical Committee and IMF 2017 data for peer statistics. ¹ Estimate
19Banks Remain Well Capitalised and Regulations are Tightened
Belarusian banks remain resilient, although macroeconomic conditions pose challenges. The measures implemented by the authorities
in order to improve the governance and to protect banks have sustained the strength of the key indicators in the sector in 2017
Key Parameters of the Banking Sector
There are 24 active banks in Belarus: 5 state-owned, 14 controlled
by foreign investors and 5 controlled by private local capital¹
2012 2013 2014 2015 2016 2017
The minimum regulatory capital requirement is met by all banks
and the average capital adequacy ratio in the sector continues to Total Assets, USD bn² 38.5 44.5 47.1 39.7 32.4 34.5
be high: 18.5% as at December 31, 2017.
Deposits / Liabilities, % 45 44 45 47 47 52
NPLs are reduced due to transfer of bad agricultural loans from
banks to the Asset Management Agency, dealing with defaulting
debts of agricultural producers NPL³, % 0.7 1.3 0.9 1.9 4.0 2.0
Since January 1, 2018, Basel III liquidity indicators, i.e. the liquidity Problem Assets⁴, % 5.5 4.4 4.4 6.8 12.8 12.9
coverage ratio and the net stable funding ratio have been
implemented as secure functioning requirements. Additionally, in Return on Total Assets, % 1.8 1.9 1.7 1.0 1.3 1.4
relation to the sufficiency of Core Tier I Capital, a countercyclical
buffer and a buffer of system significance have also been Return on the Regulatory
introduced 12.7 13.8 13.1 8.4 10.8 9.6
Capital, %
New Basel Committee standards for determining credit,
operational and market risk will be implemented in 2018
Deposits by customer Loans by borrower
Banking Sector Capital Adequacy Ratios type as of 31.12.2017 type as of 31.12.2017
4% 4%
11%
20.8% 23%
18.7% 18.6% 18.5%
17.4% Total: Total: 40%
14.6% 15.5% USD 17.6 bn 27% USD 19.7 bn
58%
13.0% 13.0% 12.8% 33%
10.5% 11.5%
Public Sector
2012 2013 2014 2015 2016 2017 Private Sector
Adequacy of the regulatory capital, %⁵ Individuals
Tier I Capital Adequacy Ratio, %⁶ Non-bank Financial Institutions
Source: National Statistical Committee, National Bank
¹ Excluding banks in process of liquidation. ² Converted with USD/BYN exchange rates of the National Bank as of December 31st of each year. ³ Share of assets from groups IV
and V to gross assets (see Appendix). ⁴ Share of assets from groups III, IV and V to gross assets (see Appendix). ⁵ As per Basel III, regulatory capital consists of Tier I and Tier II,
capital previously subject to regulatory restrictions excluded; off-balance reserves for doubtful losses deemed as necessary; trust property assets; previously issued senior
loans; subordinated loans. ⁶ Tier I Capital Adequacy (Basel III) set at 6.0% since 01.01.2016.
20Financial Sector Reform is Underway
Top 5 Commercial Banks in Belarus as of 31.12.2017¹ Privatisation Targets
% of % of
Total Total
Banking Banking The Government has plans to privatise stakes of Bank Moscow-
Assets, bn Equity,
Sector Sector Minsk and Belinvestbank in the period 2018 - 2020:
USD² bn USD²
Assets Equity
* 14.3 42% 1.9 40% Belinvestbank
* 5.1 15% 0.9 18% - the Government will be seeking a strategic investor for not less
than 75% of the capital of the bank
2.2 7% 0.3 6%
- EBRD has an active MoU with the government regarding
2.2 6% 0.3 5% technical support for the privatisation of the bank until January
2020
2.2 6% 0.3 5%
- In December 2017, EBRD provided a loan of EUR 50.0 mn to
* Indicates state-owned banks. Belarus, which was on-lent to Belinvestbank in support of its Tier
Average Refinancing and Loan Rates II capital. EBRD is also considering to join the share capital of the
bank in 2018
Rate for new loans in BYR
Rate for new FX loans
Average refinancing rate Bank Moscow-Minsk
37.0 Average interbank market annual rate
- the National Bank has an active MoU with EBRD, supporting the
33.3 30.9 privatisation of the bank , incl. via a pre-privatisation lending
34.5 support, designated for SME loans, totaling USD 20 mn
25.3
25.6 24.9
21.5 21.3
- the MoU supports possible minority acquisition of EBRD (25% +
21.2
one share) via subscription of future share issuance
37.7 35.7 35.5 38.4 26.3 13.4
9.1 9.2 10.0 9.6 the Government and EBRD intend to limit their share
8.6 8.8 13.9 -
6.5 participations via the sale of a controlling stake in the capital of
the bank to a strategic investor by January 1, 2020
2012 2013 2014 2015 2016 2017
Source: National Bank of the Republic of Belarus.
¹ Excluding the Development Bank of Republic of Belarus ( operating as agency for state funding, aiming to reduce the excessive credit growth through direct lending and
to enable commercial banks to operate at market terms). ² Converted at a USD/BYN rate of 1.9727.
21Government Budget
“Students’ Village”, Minsk
22Prudent Budget Oversight
…and diversified revenue base are evidenced in continuous budget surpluses year after year.
Revenue Structure, 2017E Expenditure Structure , 2017E
Non-tax revenues Income Utilities and residential
12.3% tax 10.1% construction 4.0% National defence 2.6%
Tax on profit 6.8% Public health 10.8% Education 12.4%
Revenues of the Judicial power,
SPF¹ 26.2% Property tax 3.8% law enforcement
General public
expenses (incl. and safety 4.8%
USD debt service) 18.3% USD
VAT 21.5% Other 2.5%
21.8 bn 20.2 bn
Other taxes and Excise taxes 5.5% National
revenues of other economy 10.8%
funds 5.6% Tax revenues from Social policy
foreign trade 8.3% (incl. SPF¹) 33.8%
Strong budget performance with expected surplus in 2017 attributed to: an estimated annual GDP growth of 2.4% (vs. 0.2% projected), slow-down
of estimated CPI to 4.6% in 2017 (vs. 12.6% projected), recovering oil prices and additional revenues from export customs duties on petroleum
products
Public Sector Budget, % of GDP²
1.5% 3.0%
60%
4%
0.7% 0.1% 1.1% 1.5% 50%
1%
40%
-2%
-5%
40.7% 40.0% 41.9% 41.8% 40.1% 39.0% 42.1% 40.6% 41.2% 39.7% 40.8% 37.8%
30%
-8%
20%
-11%
10%
-14%
-17% 2012 2013 2014 2015 2016 2017E 0%
-20% -10%
Revenues Expenditures Budget balance
Source: Ministry of Finance
¹ Social Protection Fund
² Public sector budget consists of consolidated budget, extra-budgetary funds and extra-budgetary assets of budget organisations.
23Key Budget Policy Targets and Measures
Macroeconomic stability as a priority of the budget policy
Strategy for long-term budget sustainability
Ensuring complete fulfilment of obligations on redemption and servicing of public debt
Increasing the efficiency of budget expenditures by broad implementation of performance
budgeting
Improving the government support by implementation of projects’ assessment
Budget Policy - Restrictive Measures: Medium-Term Budget Limits:
Optimisation of public investments
Reduction of budget cross-subsidies Budget surplus targets
Decreasing of direct lending to SOE (up to Debt to be partially redeemed from the
BYN 1.2 (approx. USD 0.6 bn¹) in 2018 from budget surplus
BYN 1.9 bn (approx. USD 1.0 bn¹) in 2017), Public debt: the Debt Management Strategy
this form of funding is expected to be sets out a maximum limit of 45% of GDP
narrowed over time
¹ USD/BYN exchange rate of 1.9727 as of December 31, 2017
242018 Budget Based on Conservative Assumptions
The key targets of the 2018 budget are fiscal system’s sustainability and efficient usage of budget recourses
Budget Parameter 2018
Projected budget surplus BYN 766 mn (approx. USD 390 mn)
Projected budget surplus, % GDP 0.68
Revenues, % GDP 40.84
Expenditures, % GDP 40.16
External public debt limit USD 19.6 bn
External guaranteed debt limit USD 3.0 bn
Domestic public debt limit BYN 10.0 bn (approx. USD 5.1 bn)
Domestic guaranteed debt limit BYN 3.1 (approx. USD 1.6 bn)
Goal: utilise the results from the outperformance to create budget buffers for possible absorption of shocks
Base Assumptions of Budget 2018 Principles of Budget 2018
Positive GDP growth at 1.2% 1. Tax burden equal to 2017
The 2018 budget has assumed a CPI (Dec/Dec), which is
lower or equal to 7.4% (vs. 12.4% projected in Budget 2. Performance budgeting
2017)
3. Excess of budget revenues over budget expenses
Budget surplus will be used for repayment of part of
public sector external debt
Source: Ministry of Finance (Law on the 2018 Republican Budget and Law on the 2018 Social Protection Fund Budget from 31 December 2017)
25Ongoing Tax Reforms
…aimed at improving investment climate, reducing tax burden and stimulating private sector growth.
Major Tax Reforms Tax Burden, % of GDP
2012
2012
─ profit tax¹ reduced from 24% to 18% 26.0 25.9
─ reduced profit tax for innovative and high-tech companies 25.6
25.3
─ simplified tax rates for SMEs introduced 25.1
2013
2013 24.3
─ further reduction of taxes for SMEs
2014
2014
─ companies’ taxable profit reduced by R&D and investment 2012 2013 2014 2015 2016 2017
deductions
─ simplified tax accounting rules introduced
A new edict “On Taxation” from January 2018 provides for:
2015
2015
─ profit tax¹ for banks and insurers increased from 18% to 25% - indexation by 7.4% of tax rates in BYN, deductions – by 10.1%
─ personal income tax increased from 12% to 13% and income tax relief – by 10.1%
─ local taxes adjusted - 20% increase of the gross operating income in the simplified
taxation criteria
2016
2016
─ improved supervision of transfer pricing - new income tax treatment rules for corporate bond incomes
of foreign legal entities not operating through a permanent
─ electronic VAT invoicing introduced as of 01.07.2016
establishment in Belarus
2017
2017
─ increase of gambling tax rates, depending on income (up to In the 2016 Fiscal Freedom category of the US research
2.3 times) centre The Heritage Foundation Belarus ranks 89.8 (out of
─ improved tax control due to introduction of “economically
100 total score)
justified costs”
In World Bank’s “Doing Business-2018” report Belarus
2018 ––2020
2018 2020 takes 96th place in the “Paying Taxes” category (i.e. an
─ expansion of tax bases by reducing tax benefits improvement by 87 points since 2011)
─ moratorium on the increase of tax rates and introduction of
new taxes, duties
Source: Ministry of Finance
¹ Tax on income and capital gains. ² Preliminary estimate
26Public Debt
The M1 (E30) highway, reconstructed with EBRD
support, toll equipment by Kapsch TS (Austria)
27Belarus Consistently Demonstrates Conservative Debt Management
The Sovereign has an impeccable track record of timely and unconditional service of its debt obligations. All sources for public debt
redemption and service in 2018 are secured or defined
As of December 31, 2017, the public debt of Belarus stood at USD 21.4 bn or 39.3% of GDP (well below Maastricht criterion (60%) and EU-28 levels
(82.5% Q3’17))
Debt service and principal dues as per the Budget Code of Belarus are prioritised over other payments in the central government budget
Public Debt, % of GDP Comparison of Public Debt Levels, % of GDP 2017E
Maastricht criterion: 60% 101.2%
Legislative ceiling: 45% 81.9%
70.9%
10.9% 8.6% 46.4%
9.8% 41.3% 39.3%
4.8% 5.3% 5.7% 17.4% 17.4%
22.7% 28.5% 30.7%
18.9% 17.1% 16.6%
2012 2013 2014 2015 2016 2017
Domestic Public Debt External Public Debt
Public Debt Repayment Schedule, USD bn
External Debt - Principal External Debt - Interest Domestic Debt - Principal Domestic Debt - Interest
0.06
0.15 0.10 0.08 0.37
0.26 0.22 0.30
0.41 0.54 0.64
1.00 1.18 0.04
0.85 0.76 0.04
0.76 0.17
0.77 0.54 0.11
0.75 0.46
2.93
2.13 2.28 2.22
1.63 1.67 1.84 1.76
2018F 2019F 2020F 2021F 2022F 2023F 2024F 2025F
Sources: Ministry of Finance and IMF 2017 data for peer statistics.
28Debt Management Strategy Sets Clear Targets
The objectives and tools of public debt management and their further development are advised by the IMF and IBRD.
External loans are aimed at: (i) developing country’s economic potential (i.e. project financing), (ii) refinancing the outstanding debt and
(iii) supporting currency reserves’ build-up
The Government plans to gradually reduce the amount of guaranteed debt from current USD 3.9 bn (7.2% of GDP) as of December 31, 2017
As of December 31, 2017, the average residual maturity of external public debt was 5.3 years and its average interest rate - 4.7%
Public Debt Structure as of 31.12.2017 Public Debt by Instruments as of 31.12.2017
By Interest Rate By Currency
1.0% 0.5%
Multilateral loans
6.2% 21.8% 17.4%
46.4% Domestic Local bonds
Domestic public debt
public debt 44.0% 17.5%
42.0%
International bonds 10.3%
40.4% 0.1%
56.0%
External 92.3% External 50.5%
public debt 53.6% public debt Bilateral loans
Floating Rate Fixed rate USD RUB EUR
CNY BYN
Projected External Public Debt Repayment
Sources 2018, USD bn Debt Management Strategy 2015 - 2020
Key Targets
Decrease future payments’ pressure
0.4 Domestic government bonds Lower cost of borrowing
Increase average debt maturity
0.6 Eurobonds Create benchmark yield curve
USD
3.6 bn Measures
0.2 EFSD tranche
2.4
Other FX income, reserves formed in Budget surplus will be used for public sector debt repayments
2017 and export custom duties on Diversification of funding sources and available instruments
crude oil and petroleum products Improve legislative framework for local and foreign investors
Limits on nominal amounts of domestic and external public debt
Public debt to GDP limited at 45%
Source: Ministry of Finance
29Funding from IFIs and Major Bilateral Lenders
Belarus is diversifying and broadening its already deep network of IFI and bilateral partners.
Negotiations regarding the extended fund facility programme are on hold, however Belarus continues its consultative dialogue
with the IMF: parties do not have disagreements on the direction of the policy measures, aims and tasks; Belarus aims at a
greater flexibility in policy terms and measures and is continuing its dialogue with the IMF
On May 15, 2017, the EIB and Belarus signed a framework agreement, which is expected to provide access to the EIB‘s Eastern
Partnership financing
Ongoing are eight investment projects and two grants for almost USD 775 mn
Funding targeted at infrastructure projects, sustainable energy, public services, health, education sectors
The new Framework Strategy 2018 – 2022 of the World Bank for Belarus is in the pipeline (exp. adoption by March 2018)
10-year USD 3.0 bn credit agreement in support of the balance of payments, currency market, banking sector and the economy,
ACF¹ signed in 2011 (o/w USD 2.6 bn disbursed in 2011-2013)
A three-year stabilisation programme approved in March 2016 and backed by a USD 2.0 bn loan of seven tranches, o/w five
(USD 1.6 bn total) already disbursed
2014 – 2017 investments of USD 75 mn focused on financial sector, retail trade, real estate, construction materials and trade
finance. An est. USD 50 mn of investments in other sectors received in 2017
New investment activities to encompass public-private partnerships, banking sector, projects supporting private sector through
trade finance
2016 – 2019 EBRD’s strategy for Belarus approved
MoU on improving the management of state enterprises signed in 2017
Active agreements for EUR 163 mn as of December 2017. Programmes, supporting via partner banks SME lending (EUR 7.7 mn),
trade facilitation (EUR 36.2 mn), risk allocation programme (EUR 3.2 mn), water supply and sanitation (EUR 40mn) and other
lending programmes ( EUR 15 mn)
In 2017, a loan of EUR 50 mn was provided to Belarus to support the capitalisation of Belinvestbank
A number of other projects with various IFIs and development banks: Belarus is also working on expanding its cooperation with
Other IFIs IFIs such as the Nordic Investment Bank and NEFCO
The Eurasian Development Bank implemented in the country projects for a total worth of USD 980 million
Russia
In September 2017, the Russian Federation disbursed a USD 700 mn loan to Belarus for refinancing its external public debt
The outstanding bilateral loans from the Russian Government and banks were USD 7.6 bn as of December 31, 2017, o/w the
indebtedness related to the financing of the Belarusian Nuclear Power Plant (“NPP”) construction was USD 2.7 bn. Additionally,
USD 292 mn under a USD 500 mn credit line of Vnesheconombank was utilised in connection with the NPP
China Existing loan agreements for USD 4.6 bn with Eximbank of China and China Development Bank in support of various sectors of
the economy (USD 3.2 bn outstanding loans as of 31.12.2017)
Source: Ministry of Finance ¹ The Anti-Crisis Fund
30Belarus’ Sovereign Bonds Perform Strongly in the Market
Belarus’ outstanding bonds are now trading in yield terms in line with better rated sovereigns
Z-Spreads of Belarus’ Sovereign Bonds, bps
In 2017, Belarus came with a dual-tranche Eurobond
transaction in the international markets: USD 800 mn due 2023
and USD 600 mn due 2027
The low yield environment, allowed the government to extend
its securitised debt duration, establishing a liquid 10-year
benchmark in USD and refinancing smoothly its Eurbond
maturing in 2018
Considerable spread compression of Belarus’ sovereign bonds
2023s (-210 bps) and 2027s (-214 bps) since their issuance,
evidences the favourable investor perception of the credit
Belarus’ positively developing credit story has also been
affirmed by the consecutive rating upgrades by S&P (Oct/ 2017)
and Fitch (Jan/2018)
Bid Yields of Belarus 2023 and Peers Bid Yields of Belarus 2027 and Peers
Source: Bloomberg
31Building a Platform for Future Growth
Implementing
Continuous Budget
Reforms at All Levels
Surplus
of Government
Liberalisation of Local
Conservative Debt
Business
Management
Environment
Diversified and
Stabilized Liquidity
Industrialised
and Tamed Inflation
Economy
Broadening Network
Export Driven Growth
of IFI Partners
32Appendix
Nesvizh Castle (XVI c.), UNESCO world heritage
33Categorisation of Problem Loans
Classification of Bank Loans
From April 1, 2018, as NPL will be classified assets from Standard - risk group I
V-VI risk groups, as well as restructured debt from IV-VI
groups Under supervision - risk group II
Problem assets - risk groups III-V
The credit risk of banks’ assets is measured and
Non-performing loans - risk groups IV-V
classified according to the following principles:
i. evaluation of debtor’s ability to perform its
obligations Groups of Government Guaranteed Loans
ii. quality and adequacy of collateral
8 - 90 days overdue – risk group III, requiring a special
iii. number of renewals and duration of past-due reserve of 30–50% of the liability amount
loans
91 - 180 days overdue – risk group IV, with a special
iv. available information about any debtor’s risk
reserve of 50 -100%
more than 180 days overdue – risk group V, with a
The criterion “90+ days” is not the only one used to special reserve of 100%
classify loans as non-performing. Considered are also:
─ unsecured loans
─ debtor`s financial instability Groups of Loans without Government Guarantees
─ loans, extended one and more than one times 8 - 90 days overdue – risk group IV, requiring a special
─ loans of debtors, whose financial status cannot reserve of 50-100% of the loan amount
be assessed
90+ days overdue – risk group V, with a special reserve
─ non-resident debtors (excl. banks) with no or requirement of 100%
low ratings
─ loans with encumbered assets
all of which can be at the same time non-performing for
less than 90 days.
34You can also read