RESEARCH ON THE WECHAT INFORMATION TRANSMISSION TOPOLOGY BASED ON SOCIAL NETWORK ANALYSIS
←
→
Page content transcription
If your browser does not render page correctly, please read the page content below
Send Orders for Reprints to reprints@benthamscience.ae
                                          The Open Cybernetics & Systemics Journal, 2015, 9, 121-130                                    121

                                                                                                                       Open Access
Research on the WeChat Information Transmission Topology Based on
Social Network Analysis

Wang Kun* and Sun Duoyong

College of Information System and Management, National University of Defense Technology, Changsha, Hunan,
410073, P.R. China

           Abstract: With the rapid development of mobile internet technology, Social Media has become an important way for us
           to communicate with others. Meanwhile, Social Media is regarded as the most popular information exchange and knowl-
           edge-sharing platformS by more and more people, making its network structure and information transmission topology at-
           tracted a wide attention. WeChat is one of the most commonly used Social Media in China, which was developed by
           Tencent in 2011. Due to the number of WeChat customer is very huge, traditional analytical methods become not applica-
           ble. In this paper, we try to use Social Network Analysis (SNA), which being capable of handling huge data, to reveal the
           relationship networks of WeChat. On this basis, we choose a WeChat user randomly, and listed part of groups that he par-
           ticipated in. Through analyzing its network architectures and data indicators, we found out three main information trans-
           mission topology of WeChat.

Keywords: Information transmission topology, social network analysis, WeChat.

1. INTRODUCTION
     With the popularization of network and development of
mobile internet technology, people have been entered into a
new era which is more open and more sharing. Communica-
tion between people has broken the limitations of space and
time and no longer confined to the real world, more and
more information exchange occurs in the Social Media. With
the gradual powerful network community features, Social
Media has become a powerful medium, and it had a strong
impact on the traditional platform. As a new transmission
method, Social Media is not only personal privacy, but also
stress publishing public information in private space. While
it is an extension of the real world, Social Media will occupy
a very important position in the future social development.
    WeChat is one of the most famous Social Media in
China, which occupies a considerable market share in the
similar applications, such as MiTalk, momo, etc. (Fig. 1).
WeChat provides several services as Mobile Text, Voice
Messaging, Group Chat, Moments, and Location Sharing. It
began to provide a Web-based client, with messaging and
file transfer functions, in 2012. This means that it is possible
to join into the WeChat network by your computer without a
Smartphone. According to Xinhua, WeChat total users
reached about 355 millions, in October 2013, that approxi-
mately thirty percent is abroad [1]. In addition, Combined
Monthly active users of the Weixin and WeChat increased
by 57% Year over Year to 438 million at the end of second
quarter, 2014[2].                                                         Fig. (1). Active users of the three mainstream Social Media in the
                                                                          last 2 years [3].

*Address correspondence to this author at the College of Information         Although the Growth rate fluctuated up and down every
System and Management, National University of Defense Technology,         month, the number of WeChat active user is still increasing
Changsha, Hunan, 410073, P.R. China; E-mail: quinone@163.com              quickly (Fig. 2).

                                                       1874-110X/15       2015 Bentham Open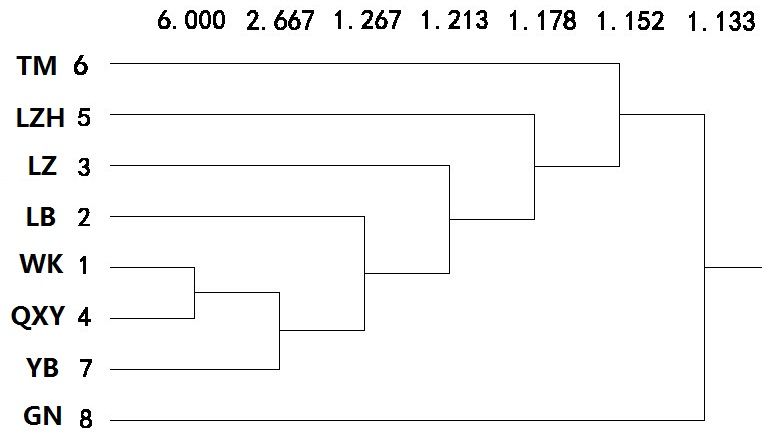
122   The Open Cybernetics & Systemics Journal, 2015, Volume 9                                                    Kun and Duoyong

Fig. (2). Active users of Wechat in last 2 years [4].

    In social sciences, the structural research methods which      individuals and small groups from the whole network analy-
based on information interaction between society actors are        sis. Node and relationship are the basis of SNA theories,
called Social Network Analysis (SNA). SNA is used to study         models and applications.
individuals and their relationships. It seeks to reveal patterns
                                                                       Centrality degree is the most commonly used indicator to
of the relationships, and tries to obtain the network structure,
                                                                   measure the network properties, which is also the basis of
functions and content of the groups, as well as the status of
                                                                   SNA. In recent years, several of scholars were trying to in-
individuals in the groups. Due to its complex structure, this
                                                                   novate this concept in order to consummate the index system
research decided to use the methods of Social Network              of SNA. Dr. Nasrullah Memon proposes a series of concep-
Analysis to study the information transmission topology of
                                                                   tions such as Network Efficiency, Dependency Centrality,
WeChat.
                                                                   and Location Role Centrality [8]. This paper is based on
                                                                   studying the network of a randomly chosen WeChat cus-
2. THE MAIN MEASURES OF SOCIAL NETWORK                             tomer aiming to obtain the information transmission topol-
ANALYSIS                                                           ogy based on the SNA. Here we will mainly study the char-
    Social networks research appeared early in 1934. Mo-           acteristics from "Density", "Centrality" and "Cohesive Sub-
reno, who was a famous American social psychologist, be-           group". We will give a brief introduction about these indica-
gan to study small groups with the method of Morphometry.          tors at the very beginning [9].
Another few scholars thought that Social network Analysis
originated from the theory of Anthropology in England, be-         2.1. Network Density
cause Radcliffe Brown was the first person who proposes the            This is the most commonly used research index in SNA.
concept of social network. J.A. Barnes, D. Cartwright, T.M.        In networks, a point may be (in addition to itself) connected
Ncomb, and A. Bavelas were all representatives who per-            to any other points, Network Density is mainly used to de-
formed their research on Social networks very early [5, 6].        scribe how closely the links between nodes in the graph.
    Social network refers to the collections between social        This indicator is most dependent on the inclusiveness and
actors and their relationships, and it is composed of multiple     nodal degree of the networks. In the undirected network,
points (social actors) and connections between points (the         which has n points, the connection from point A to point B is
relationship between actors) [7]. Before the Internet appears,     a line, it is most likely to have n(n-1)/2 different pieces (1).
SNA is only used to study the real society groups. In recent       In the directed network, the data matrix is asymmetric, and
years, SNA has begun to research groups who exist in the           the line from point A to point B does not necessarily contain
virtual space. The functions of SNA are finding features of        the one from point B to point A. Therefore, the maximum
Research on the WeChat Information Transmission Topology The Open Cybernetics & Systemics Journal, 2015, Volume 9 123
number of connections might have exactly equal to the all ent kind of networks, we often put the sum of distances di-
points it has, that is n(n-1), and the calculation formula of the vided by (n-1), then the indicator will become standardiza-
directed network became a bit different to that in the undi- tion, its expression is as follows (7):
rected network (2). n
Du =
1
(1)
"d ij
j=1
(
n n !1 / 2 ) C RPi
!1
= (7)
( n !1)
1
Dd = (2) 2.5. Clustering Analysis
(
n n !1 )
Clustering Analysis starts from the members in social
2.2. Point Centrality network and relationships between them [12]. Social Struc-
ture is used to describe relationship mode among social ac-
Point Centrality is used to describe the importance of po- tors, no matter whether really exists or underlying (Wellman
sition with a point in the entire network. This concept is de- and Berkowitz, 1988; Berkowitz, 1983; Scott, 2000). The
rived from the Sociometrics. A. Bavelas verified the follow- concept of cohesion subgroup includes the N-Cliques (Scott,
ing assumptions that once relationship was established, if 2000; Wasserman and Faust, 1994), N-Clan (Alba and R. J.
one point has direct link with almost every point in the net- Mokken, 1973), K-Plex (Seidman and Foster), K-Core, and
work, this point is on the center position, which would hold Lambda Set (Borgatti, Everett and Shirey, 1990). When con-
greater rights in this network [10], when he firstly got his nections between some members of a network are much
groundbreaking research on Point Centrality (Freeman, closer, these points would be classified as the cohesion sub-
1979:215). Point Centrality can be measured by the number group. The contents, in which Clustering Analysis needs to
of points which has directly contact with this point in the explain, are how many cohesion subgroups exist, and how to
network. In directed network, it always has two indicators, explain the relationship between members of a sub-group.
which we called in-centrality and out-centrality. The unified The relationships of actors in same cohesion subgroup would
formula is as follows (3): be more frequent, direct, and active, and we could find this
conclusion thought many different ways [13].
xi + xo
C RD = (3)
(
2 n !1 ) 3. RELATED WORKS
Information transmission topology is description about
2.3. Betweenness Centrality network structure and it is also a problem-solving approach
According to the historical experience, if a point is on in some ways and layers. Since the establishment of Social
many shortcuts of other points (shortest path), this actor oc- Communication, researchers paid much attention to study the
cupies an important position, because it holds such position information dissemination mode, and proposed hundreds of
that can affect the group by controlling the proceeding of models. Traditional models help us to understand network
information transmission. According to the concept of itself and general principles more fully. In previous studies,
“Structural Hole”, Burt put forward a situation that relation- models were built on the basis of sociological research, and
ship of point A and point B is relied on point C, if the links they put much more emphasis on the social propagation. The
between them must across the other points [11]. Between- information transmission topology can be divided into three
ness Centrality measures the degree of how a certain node cases: the Linear Model, the Feedback Model and the Social
could control the information transmission channel in the System Model [14].
network, which is as follow (5) (6): In the Linear Model, the most obvious flaw is that the
n n process of information transmission in human society is de-
(
C ABi = ! ! g jk (i) / g jk , j < k, j " k " i ) (5) scribed as the one-way flow line, ignoring the feedback fac-
j k tors and other social factors. The Feedback Model reflects
the reality of this proceeding more objectively and accu-
2C ABi rately, but it still has not provided a clear description of rela-
C RBi = (6)
2
n ! 3n + 2 tionship between the information transmission and society
(Fig. 3). The Social System Model is recognized to be a huge
2.4. Closeness Centrality leap in this area. Researchers took more attention about
problems and conditions in the process, and explicitly placed
Closeness Centrality is an indicator how a point can it among the general community research (Fig. 4).
avoid others' control in a network. A. Bavelas, G. Sabidussi
and other scholars defined Closeness Centrality according to
measure "distance" between these points (Friedman, 1979).
The quantification definition is to calculate sum of distances
between a point and all the other points in the whole net-
work. If the "distance" is very short, such point is "closer" to
the other ones. Its influence about information resources,
power, prestige and other aspects would become higher. In
Fig. (3). Example of the feedback model.
order to facilitate comparing Closeness Centrality in differ-124 The Open Cybernetics & Systemics Journal, 2015, Volume 9 Kun and Duoyong
information transmission topology. Although the product of
traditional research is similar to the reality community, the
classic model of Social Media is still different. As Wechat is
a typical social media, original methods became unsuitable,
in order to analyze the topology and behavior of such
groups, it is necessary to use methods from social network
analysis [22]. By modeling the individuals and groups, we
faced in a network, we can measure many kinds of important
properties in this network through the visualization methods,
especially information transmission topology, which we
Fig. (4). Example of the social system model.
would discuss in this paper.
Small-world network is one of the most important basic
theories in complex network theory. It can be traced back to 4. ANALYSIS OF WECHAT USER'S DATA BASED
the earliest Konigsberg Seven Bridges Problem. Euler, one ON UCINET
of the most famous international mathematicians in 18 cen-
tury, used the method of Graph Theory for solving the his- We have chosen a WeChat user randomly, and listed the
toric challenge [15]. The two landmark paper, “Collective groups that he joined as the basic data. The first step is to
dynamics of 'small-world' networks” and “Emergence of establish the user’s analysis matrix, and then we can have a
scaling in random networks”, were published by professor comprehensive study about this network. It mainly includes
Watts and Barabasi respectively in the end of last century. Centrality and Clustering Analysis. Centrality analysis is to
Moreover, these two distinguished papers have led directly reveal the prominent one with high activity in the network,
to the huge changes in scientific exploration of Complex which is significant for impact of the entire organization.
Network Science [16]. Clustering is used to find the similar partners. According to
theory of SNA, they may exhibit similar behaviors in the real
The Six Degrees of Separation, which was proposed by world.
the famous American Social Psychologist Milgram, pointed
out that the “weak link” was very prevalent in our society. UCINET is a kind of software which can help simplify
The theory indicates that everybody is six or fewer steps the quantitative analysis of social networks. It can format the
away from any other one in this world, so that a chain of data from a directed or undirected network into an adjacency
“friend to friend” can established links or transmit informa- matrix, and describe the features of a network by numerical
tion among any two persons in a maximum of six steps. This and visual representation. It also contains capability to utilize
Experiment has originally designed and implemented Fri- some relational databases and reveals features of this kind of
gyes Karinthy, in 1929 [17]. Professor Watts and his team network [23].
tried to recreate Milgram's famous experiment through the Based on data of the randomly chosen WeChat user [24],
Internet in 2001, when he was teaching at Columbia Univer- and according to the conversion formula: S=AAT, we can get
sity. They set up a program that invited about 48,000 senders the Affiliation Matrix (Table 1) and the Adjacency Matrix
randomly and requested them to deliver an e-mail message (Table 2).
to 19 certain targets. The participants was coming from 157
different countries all over the world. The results show that 4.1. Centrality Analysis
the average number of intermediaries was around 6 [18]. In
recent years, Karl Bunyan released an interesting application Network and its node has many characteristics, such as
which can calculate the degrees of separation among differ- density, centrality and so on. The node's centrality degree is
ent users in the Facebook. We call it as “Six Degrees”. Its mainly includes Point Centrality, Betweenness Centrality,
calculation show that the maximum degree of separation is and Closeness Centrality. As the Centralities above are par-
12, whereas the average one is only 5.73 [19]. ticularly dependent on initial distance among the nodes, we
would have every reason to believe that there are obvious
Based on these theories above, Social Media was usually differences between the globally central and locally central.
expressed as the grouping of individuals into specific groups, In order to solve this problem, Professor Banacich proposed
just like the urban communities or neighborhood subdivision a new concept in 1987, which called “Banacich Power”. In
in country. Such as a study of 5.2 billion Twitter users with response to suspicions of a few other scholars (Knoke and
these kind of relationships has shown that the average dis- Burt, 1983) Professor Banacich promoted his own research
tance is only 4.67. According to the statistics, almost every- and the latest achievement was the general measurement
one on Twitter are less than 6 steps away from each other, formula (8):
while about half of them are only 4 steps away [20]. The
networks are full filled with millions of individuals who are
trying to meet others, to share the first-hand information or Ci = ! rij (" + # c j ) (8)
j
pictures of cooking, gardening, sports, and even finding em-
ployment, interest groups and so on. The topics are as varied After the calculation of UCINET, All above-mentioned
and rich as the story of our universe [21]. indicators are shown in Tables 3 and 4. Because of the dif-
With the emergence of Social Media, especially after the ferences between the Graph Centrality and Centralization of
popularization of the Wireless Networking, the exchange of a Graph, this paper is focused on the former one. In order to
information becomes more and more frequent in virtual net- facilitate the following analysis, most of the data were sub-
work space. It also has opened up new areas for studying stantially taken normalized.Research on the WeChat Information Transmission Topology The Open Cybernetics & Systemics Journal, 2015, Volume 9 125
Table 1. The affiliation matrix of the WeChat user.
G1 G2 G3 G4 G5 G6
WK 1 1 1 1 1 1
LB 1 0 0 1 0 1
LZ 1 1 0 1 0 1
QXY 0 0 1 0 1 0
LZH 1 0 0 1 0 0
TM 1 0 0 1 0 0
YB 0 0 0 0 1 0
GN 0 0 0 1 0 0
Table 2. The adjacency matrix of the WeChat user.
WK LB LZ QXY LZH TM YB GN
WK 6 3 4 2 2 2 1 1
LB 3 3 3 0 2 2 0 1
LZ 4 3 4 0 2 2 0 1
QXY 2 0 0 2 0 0 1 0
LZH 2 2 2 0 2 2 0 1
TM 2 2 2 0 2 2 0 1
YB 1 0 0 1 0 0 1 0
GN 1 1 1 0 1 1 0 1
Table 3. The user's centrality analysis degree.
(3-1)
Degree Centrality NrmDegree Centrality Share Centrality NrmBonacich Power
WK 15.000 53.571 0.227 4.568
LZ 12.000 42.857 0.182 3.655
LB 11.000 39.286 0.167 3.350
TM 9.000 32.143 0.136 2.741
LZH 9.000 32.143 0.136 2.741
GN 5.000 17.857 0.076 1.523
QXY 3.000 10.714 0.045 0.914
YB 2.000 0.030 0.030 0.609126 The Open Cybernetics & Systemics Journal, 2015, Volume 9 Kun and Duoyong
(3-2)
FlowBet Centrality nFlowBet Centrality PrBet Centrality EgoBet Centrality
WK 25.368 60.399 28.000 10.000
LZ 4.368 10.399 6.000 0.000
LB 4.322 10.291 6.000 0.000
TM 3.994 9.509 6.000 0.000
LZH 3.994 9.509 6.000 0.000
GN 2.086 4.966 6.000 0.000
QXY 6.000 14.286 3.000 0.000
YB 4.000 9.524 3.000 0.000
(3-3)
Closeness Centrality Farness Centrality Reach-Based Centrality NormdwRea Centrality
WK 100.000 7.000 8.000 1.000
LZ 77.778 9.000 7.000 0.875
LB 77.778 9.000 7.000 0.875
TM 77.778 9.000 7.000 0.875
LZH 77.778 9.000 7.000 0.875
GN 77.778 9.000 7.000 0.875
QXY 58.333 12.000 5.500 0.688
YB 58.333 12.000 5.500 0.688
Table 4. Results of structural hole measures.
(4-1)
EffSize Measures Efficie Measures Hierarc Measures Indirec Measures
WK 4.067 0.581 0.155 0.511
LZ 1.542 0.308 0.104 0.730
LB 1.591 0.318 0.094 0.765
TM 1.704 0.341 0.061 0.814
LZH 1.704 0.341 0.061 0.814
GN 1.633 0.327 0.007 0.904
QXY 1.167 0.583 0.110 0.389
YB 1.000 0.500 0.000 0.667Research on the WeChat Information Transmission Topology The Open Cybernetics & Systemics Journal, 2015, Volume 9 127
(4-2)
Degree Measures Density Measures Constra Measures Ln(Cons Measures
WK 7.000 1.179 0.386 -0.951
LZ 5.000 1.700 0.658 -0.419
LB 5.000 1.800 0.679 -0.387
TM 5.000 2.000 0.697 -0.361
LZH 5.000 2.000 0.697 -0.361
GN 5.000 2.400 0.729 -0.316
QXY 2.000 1.000 1.003 0.003
YB 2.000 2.000 1.389 0.329
Table 5. Results of cohesive subgroup analysis.
(5-1)
Level Users (Concor)
1 WK, LB, LZ, GN, LZH, TM; YB, QXY
2 WK; LB, LZ, TM, GN, LZH; YB, QXY
3 WK; LB, LZ; TM, GN, LZH; YB, QXY
(5-2)
Level Users (K-Plex) Fig. (5). K-Plex analysis of the Wechat user.
1 WK, LB, LZ, LZH, TM, GN 4.2. Clustering Analysis
2 WK, LB, QXY Clustering is used to distinguish the objects into multiple
groups that the ones in same cluster have higher similarity,
3 WK, LB, YB but are very different to the other parts. Similarities and dis-
4 WK, LZ, QXY
similarities are assessed based on the data describing the
objects. It is defined as "a statistical classification technique
5 WK, LZ, YB for determining whether the individuals of a population
would fall into different groups by making quantitative com-
6 WK, QXY, LZH
parisons of multiple characteristics" (Jain, 2009). Although
7 WK, QXY, TM concept of N-Cliques is much clearer and easier for under-
standing, its vulnerability is very obvious. Once we move
8 WK, QXY, YB some nodes of a network, the structure would become very
9 WK, QXY, GN different [27]. In routine research, we often adopt K-Plex to
improve robust. After gradually reduce the attribution val-
10 WK, LZH, YB ues, we can get Table 5 as the results of classification. This
11 WK, TM, YB part of clustering analysis is based on the Hierarchical Clus-
tering and Concor Partition Diagram.
12 WK, YB, GN
Although the UCINET could only handle binary value in
Structural Hole is an important theory of Social Capital, Hierarchical Clustering, the main information still contained
and it is shown that people would get some advantages only in the results, and the dendrogram (Fig. 5) as follow can give
because of their position in the network. The central node us a gut feeling about it.
could reap some additional benefits in the network, as the From the results, we can see that users are more likely to
diverse connections could provide them much more oppor- be classified into one group, when the connections between
tunities and useful intelligence [25]. When two points pos- them are analogous to others. YB and QXY are classmates in
sess non-redundant path, we can be sure there is a structural real life, who were both admitted in September 2014. And
hole between them. Meanwhile, an ideal network structure the other ones are students of the same supervisor. WK plays
requires both clusters and structural holes [26]. In this part, a relatively large role in this network, because he is across
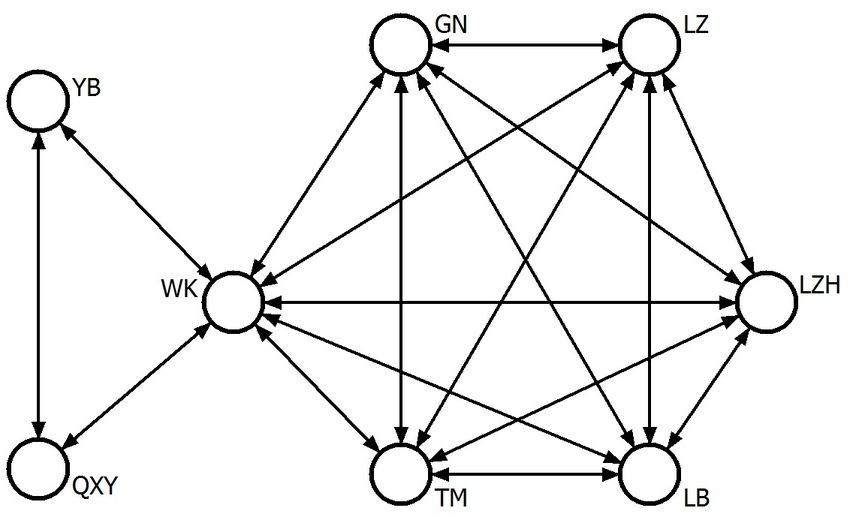
we will perform some specialized Structural Hole measures. the two groups. That is what we called “Structure Hole”, and128 The Open Cybernetics & Systemics Journal, 2015, Volume 9 Kun and Duoyong
Fig. (6). Sociogram of the random chosen Wechat user.
we can understand the network easier and more intuitionally may comment on different topics, while common interests
though the following Fig. (6). really play a decisive role in this topology. The network den-
sity is much smaller, and the center points will have rela-
5. THE WECHAT INFORMATION TRANSMISSION tively high Point Centrality which will lead to a higher con-
TOPOLOGY trol to the others. The rest points in this network also have a
higher Closeness Centrality, so they are easily to be con-
After understanding structure of these groups above, and trolled. In this model, members would have greater equality,
combining with characteristics analysis, we can summarize because no one could really hold the center position in this
several topology that exist in information transmission, process of information transmission for a long time. The
mainly about Point to Point Topologies, Mesh Topology, Star commonly used function in the software, Group Chat, would
Topology. As this paper is focused on information transmis- be the best example for this topology (Fig. 8).
sion topology, it is possible for the researchers to reveal
these characteristics based on data from a random chosen
user. We will give a brief primary analysis of these topolo-
gies as following [28]:
5.1. Point to Point Topology
In some cases, the discussion among Wechat user usually
focused on one topic, which leads to the appearance of Point
to Point Topology. This model is the most convenient way of
information exchange, and it is always contained of only two
points and the topics are specific that others can not involve
in it. In this mode, External-Internal Index is -1, which
means information flow entirely takes place in cohesion sub-
group. Points in this pattern can completely control each
other, and once any partner exits, it would lead to failure of
the information interaction. Since, its structure is very sim-
ple, no matter in feedback, frequency, and many other as-
pects, Point to Point Topology is most efficient mode. Al-
most every user, who was under the private chat, was in this Fig. (8). Example of the Mesh Topology.
mode (Fig. 7).
5.3. Star Topology
In this mode, it would have a relatively stable center of
the whole network. The approach of information flow is one-
way, that means the center release the information and the
others have to obtain it. In Wechat, the most direct instance
Fig. (7). Example of the Point to Point Topology. is that you share some comments or photos in the Moments.
In this case, other friends may just wait and see, that makes
5.2. Mesh Topology
the information sender having a high Point Centrality. The
In many cases, there are various basic views in discus- structure of information flow in this mode is also showing
sions, which form of several factions, but they are still in the like the Tree Topology. This topology is the best way for the
same group. There will be two or more centers which more information publisher to enhance his subjective willing. It
or less have some correlations. The individuals at this status only depends on stability of the center node at this status,Research on the WeChat Information Transmission Topology The Open Cybernetics & Systemics Journal, 2015, Volume 9 129
ACKNOWLEDGEMENTS
UCINET is a social network analysis program developed
by Professor Steve Borgatti, Martin Everett and Lin Free-
man. This software is distributed by Analytic Technologies
[29]. Our research is financially supported by the National
Natural Science Foundation of China (Grant No.71473263)
and the Specialized Research Fund for Doctoral Program of
Higher Education of China (Grant No.20134307110020).
REFERENCES
[1] “WeChat”. Available: http://en.wikipedia.org/wiki/WeChat#cite_
note-48 [Accessed: Oct. 19, 2014].
[2] “Tencent Announces 2014 Second Quarter and Interim Results”.
http://tencent.com/en-us/content/ir/news/2014/attachments/20140813.
pdf [Accessed: Oct. 19, 2014].
[3] “CIOTC”. Available: http://www.ciotc.cn/a/Industry/wuxianchen-
gshi/2013/0303/5758.html [Accessed: Oct. 19, 2014].
[4] “Micro Letter dated live showing subscriber growth, micro-chennal
gaming has become a major force pulled”. Available: http://
www.sfw.cn/xinwen/442082.html [Accessed: Oct. 19, 2014].
Fig. (9). Example of the Star Topology. [5] Z.Z. Fang, “Basic concepts and methods of social network re-
search,” Journal of Huazhong University of Science and Technol-
ogy (Social Science Edition), vol. 3, pp. 111-112, 2005.
whether such model can successfully complete the process of [6] C. Prell, Social Network Analysis: History, Theory and Methodol-
information transmission or central idea can be recognized ogy, SAGE Publications, 2011.
by the others. It can be seen in the Sociogram that the User [7] M. Emirbayer, and J. Goodwin, “Network analysis, culture and
WK occupied such key role in the network. The topology the problem of agency” American Journal of Sociology, vol.
can be abstracted into the following graph (Fig. 9). 99, no. 6, pp. 1411-1454, 1994.
[8] N. Memon, and D. L. Hicks, “Detecting Key Players in Terrorist
Network: A Case Study of 9-11,” In: The 3rd International Confer-
6. CONCLUSION ence on Availability, Reliability and Security, IEEE computer soci-
ety, 2008.
(1) This study has briefly introduced the theories of So- [9] J. Liu, An Introduction to Social Network Analysis, Social Science
cial Network Analysis at the beginning. And then, Based on Academic Press (China), 2004 (in Chinese).
its own concept and methods, we mainly get three kinds of [10] A. Bavelas, “A Mathematical Model for Group Structures,” Human
Organization, vol. 7, pp. 16-30, 1948.
information transmission topology that exist in the network [11] S. Burt Ronald, Structural holes: the Social Structure of Competition,
of general Wechat user, such as the Point to Point Topology, Harvard University Press, 1992.
Mesh Topology, and Star Topology. Meanwhile, this paper [12] J.D. Luo, Social Network Analysis (2nd Edition), Social Sciences Aca-
also gives some detail resolutions about these models with demic Press(China), 2010 (in Chinese).
the results of UCINET. [13] S. Wasserman, and K. Faust, Social Network Analysis: Methods
and Applications, Cambridge University Press, New York and
(2) Social Media is not only a channel of information Cambridge, 1994.
transmission, but also a small online community. It has be- [14] A. Galeotti, C. Ghiglino, and F. Squintani, “Strategic Information
Transmission Networks,” Journal of Economic Theory, vol. 148,
come an essential service for the internet company to provide 1751-1769, 2013.
for the participants. With the rapid development of mobile [15] A.L. Barabasi, and R. Albert, “Emergence of scaling in random
internet, the future of Social Media not only relies on the networks,” Science, vol. 286, pp. 509-512, 1999.
efforts of users, but also depends on the management of the [16] M. Mitchell, Complexity: A Guided Tour, Oxford University
Press, 2009.
providers. [17] M. Newman, A.L. Barabasi, and D.J. Watts, The Structure and
Dynamics of Networks, Princeton University Press, Princeton, NJ,
ABOUT THE AUTHORS 2006.
[18] D.J. Watts, and S.H. Strogatz, “Collective dynamics of 'small-
First Author Wang Kun, College of Information System world' networks,” Nature, vol. 393, pp. 440-442, 1998.
and Management, National University of Defense Technol- [19] “Six Degree: Comes in your time is up” Available:
ogy, Master Degree Candidate. The author’s major is the http://blog.karlbunyan.com/2009/06/24/six degrees-come-in-your-
time-is-up/ [Accessed: Oct. 19, 2014].
Social Network Analysis, International Relations. 3 papers [20] “Six Degrees of Separation, Twitter Style,” April 30, 2010. [Ac-
received by EI. cessed: Oct. 19, 2014].
[21] “What is Social Networking” Available: http://www.whatissocial
Second Author Sun Duoyong, College of Information networking.com/ [Accessed: Oct. 19, 2014].
System and Management, National University of Defense [22] J.P. Scott, Social Network Analysis: A Handbook (2nd Edition),
Technology, Professor, Ph.D.Supervisor. The author’s major SAGE Publications, 2000.
is National Security and Crisis Management. [23] M. Bastian, S. Heymann, and M. Jacomy, “Gephi: an open source
software for exploring and manipulating networks,” In: The 3rd In-
ternational Conference on Weblogs and Social Media, May 2009,
CONFLICT OF INTEREST pp. 361-362.
[24] “WeChat”. Available: https://wx.qq.com/. [Accessed: Oct. 19,
The authors confirm that this article content has no con- 2014].
flict of interest. [25] R. Burt, “Structural Holes and Good Ideas,” American Journal of
Sociology, vol. 110, no. 2, p. 349, 2004.130 The Open Cybernetics & Systemics Journal, 2015, Volume 9 Kun and Duoyong
[26] R. Burt, Structural Holes: The Social Structure of Competition, [28] “MediaChina”. Available: http://academic.mediachina.net/article.
Harvard University Press, Cambridge, MA, 1992. php?id=6398 [Accessed: Oct. 19, 2014].
[27] S.B. Seidman, B.L. Foster, “A graph-theoretic generalization of the [29] “UCINET Software”. Available: http://www.analytictech.com/
clique concept,” Journal of Mathematical Sociology, vol. 6, pp. ucinet/ [Accessed: Oct. 19, 2014].
139-154, 1978.
Received: September 16, 2014 Revised: December 23, 2014 Accepted: December 31, 2014
© Kun and Duoyong; Licensee Bentham Open.
This is an open access article licensed under the terms of the Creative Commons Attribution Non-Commercial License (http://creativecommons.org/-
licenses/by-nc/3.0/) which permits unrestricted, non-commercial use, distribution and reproduction in any medium, provided the work is properly cited.You can also read