Resident and Community Characteristics Report - Community-Based Care Adult Foster Homes - Portland State University
←
→
Page content transcription
If your browser does not render page correctly, please read the page content below
Community-Based Care
Resident and Community
Characteristics Report

Adult Foster Homes

Paula C. Carder, PhD
Jacklyn Kohon, PhD
Aubrey Limburg
Amanuel Zimam
Megan Rushkin, MPH
Margaret B. Neal, PhD    Spring, 2016
Acknowledgments

This report was prepared in collaboration with the following stakeholders:

Oregon Department of Human Services

Oregon Health Care Association

Leading Age Oregon

Concepts in Community Living, LLC

Additional Contributors from Portland State University:
       Tanya Kindrachuk, Tiffany-Amber Ganir, Sheryl Elliott, MUS, Max West, Cat McGinnis

Special thanks to all of the Community-Based Care providers throughout the state of Oregon
who contributed to this effort, especially those who welcomed us into their communities to
discuss this project.

Suggested citation:

Carder, P., Kohon, J., Limburg, A., Zimam, A., Rushkin, M., Neal, M. (June, 2016). Oregon
Community-Based Care Survey 2016: Adult Foster Homes. Funded by Oregon DHS.

Contact:

Paula C. Carder, Ph.D.
Institute on Aging                   p. 503.725.5144
Portland State University            f. 503.725.5100
PO Box 751                           carderp@pdx.edu
Portland, Oregon 97207               www.pdx.edu/ioa

                                                                                             2
Table of Contents
           Acknowledgments…………………………………………………………………………………………. 2
           Executive Summary ......................................................................................... 4
           Key Findings .................................................................................................... 5
           Background ..................................................................................................... 7
           Adult Foster Home Characteristics ................................................................... 9
           Adult Foster Home Staff ................................................................................ 12
                         Who Works in Adult Foster Homes? ..................................................... 12
           Rates, Fees, and Medicaid Use....................................................................... 17
                         How Much Do Adult Foster Homes Cost?............................................. 17
           Community Services and Policies ................................................................... 20
                         What are Common Services and Policies?............................................ 20
           Residents ...................................................................................................... 22
                         Who Lives in Adult Foster Homes? ....................................................... 22
           Policy Considerations and Conclusions .......................................................... 29

           Appendix A: Methods .................................................................................... 30
           Appendix B: Additional Tables ....................................................................... 34
           Appendix C: References ................................................................................. 38
           Appendix D: Survey Instrument ..................................................................... 41

                                                                                                                            3
Executive Summary
This report describes adult foster homes in Oregon. An adult foster home (AFH) is a type of
licensed community-based care (CBC) setting that provides residential, personal care, and
health-related services, primarily to older adults.

The study collected information from adult foster homes to achieve the following four main
goals.

           1:                                    2:
           Describe adult foster home            Describe current residents’ health
           characteristics, including staffing   and social characteristics
           types and levels, policies, and
           monthly charges and fees

           3:                                    4:
           Compare current results to prior      Compare setting types for
           Oregon surveys and to national        differences that might affect
           studies of similar setting types to   access, quality, or costs
           identify changes and possible
           trends

The study findings are intended to provide information that state agency staff, legislators,
community-based care providers, and consumers may use to guide their decisions. Providing
state-level information was one of the goals of Oregon’s LTC 3.0 planning process.

Survey
In 2016, Portland State University’s Institute on Aging (IOA) mailed a questionnaire to a sample
of 626 AFHs in Oregon; 319 providers responded, for a response rate of 51 percent. The
questionnaires asked about resident and staff characteristics, services, policies, and monthly
rates and fees. The study methods are described in Appendix A (page 30). Some questions were
asked both this year and last year; if so, we report the prior findings for comparison. Other
questions were new this year.

                                                                                               4
Key Findings
Homes
There were 1,692 AFHs with a licensed capacity of 7,475 Higher in Oregon
beds. AFHs than
Survey respondents were licensed to care for 1,401 Nationally
residents and reported 1,218 current residents, for Diabetes:
an occupancy rate of 87 percent. 22% in Oregon
Twenty-two percent of AFH operators were certified nursing 16% Nationally
assistants (CNAs). Serious mental
Seventeen percent of current AFH owners indicated that they illness:
were thinking about selling or transferring their home in the 15% in Oregon
next five years. 9% Nationally
Staff
Intellectual or
Forty-two percent of AFHs employed at least one caregiver.
developmental
Nineteen percent of caregivers had a professional certification disabilities:
as either a CNA, certified medication aide (CMA), or licensed 9% in Oregon
personal nurse (LPN). 1% Nationally
Forty-six percent used a standardized falls risk assessment.
Seventy-six percent of providers encouraged staff and other
home occupants to get an annual flu vaccination.
Lower in
Compared to the 2015 report:
Oregon AFHs
Resident managers were employed by 24 percent of AFHs,
than Nationally
compared to 16 percent last year.
AFHs reported fewer visits from health service professionals. Cancer:
7% in Oregon
Rates and Fees 11% Nationally
The mean monthly charge was $3,202. Falls:
Seventy percent of AFHs charged an additional fee for 15% in Oregon
catheter/colostomy care, advanced memory care, two- 21% Nationally
person transfer assistance, and advanced diabetes care.
The majority of AFHs (84 percent) accepted Medicaid.
Ninety percent of AFHs would allow current private-pay residents
who became eligible for Medicaid to stay in the home.
Community Services and Policies
Sixty-nine percent of AFHs listed hitting others/acting in anger as a reason for a move-
out notice.
5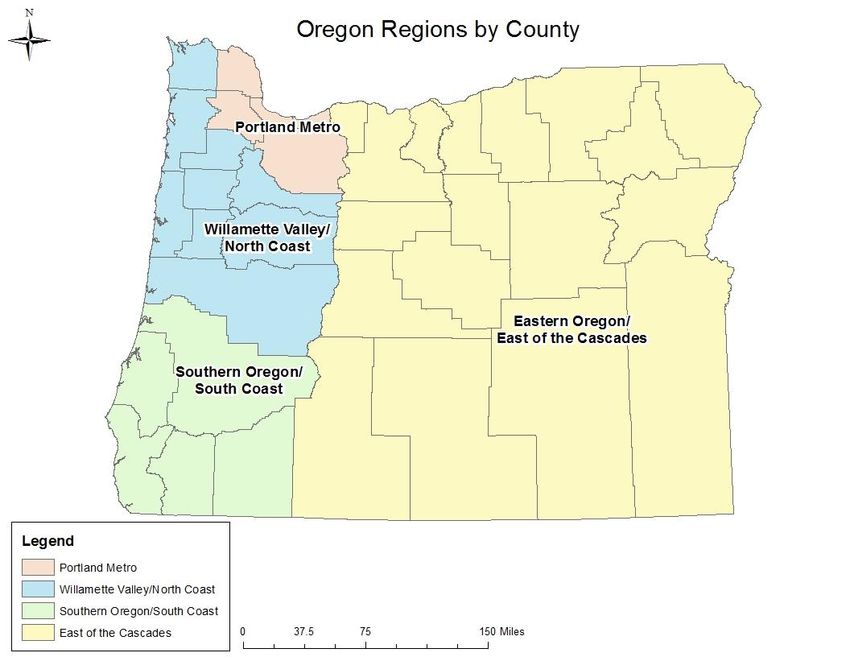
Residents
Eighteen percent of residents were unable to leave the home because it was too
physically or emotionally taxing.
Thirty-four percent of residents used antipsychotic medications compared to 25
percent of nursing home residents, based on a national study.
Compared to the 2015 report:
More residents were 85 years or older this year.
Fewer residents moved in from assisted living or residential care –24 percent last year
and 13 percent this year.
Fewer residents died at the home – 49 percent this year and 59 percent last year.
More residents took nine or more medications – 54 percent this year and 50 percent
last year.
Compared to assisted living, residential care, and memory care communities, AFHs
reported:
Shorter lengths of stay, with 30 percent of AFH residents staying less than 90 days
compared to 18 percent in the other CBC settings.
More residents with Alzheimer’s disease or other dementias, with 49 percent
compared to 46 percent in other CBC settings.
Lower rates of falls in AFHs (15 percent) compared to other CBC settings (27 percent).
A higher use of antipsychotic medications, with 34 percent of AFH residents taking an
antipsychotic medication compared to 26 percent in other CBC settings.
Typical Adult Foster Home Resident
Female, 77 years old, and White, non-Hispanic
Moved in from home
Stayed for 3-6 months
Moved due to end of life
Average monthly charge: $3,202
6Background
Adult foster homes provide a unique type of community-based care (CBC). Oregon’s model,
developed in the 1980s, has been profiled as a national example. Like other licensed CBC
settings (e.g., assisted living, residential care, and memory care), AFHs offer and coordinate
supportive services on a 24-hour basis. Oregon administrative rules (OAR 411-50) require AFHs
to promote resident self-direction and participation in decisions that emphasize choice, dignity,
privacy, individuality, independence, and home-like surroundings. Adult foster homes are
meant to be “family-like” and 85 percent are homes in which the owner’s family members also
reside.
Oregon’s AFHs are single-family residences where the owner and/or employees provide access
to 24-hour care and supervision for up to five adults who typically have difficulty managing
daily personal care activities. Services include assistance with activities of daily living (ADL) such
as eating, dressing, bathing, with instrumental activities of daily living (IADL) such as medication
administration and meal preparation, and assistance with behaviors associated with dementia
(e.g., disorientation, confusion, and wandering). Additional health-related and social services
may be provided or coordinated. A wide variety of residents are served in AFHs, including some
who primarily need room, board, and minimal personal assistance as well as residents who
need full personal care, have dementia (such as Alzheimer’s disease), or residents who need
skilled nursing care provided with the help of community-based registered nurses.
Nationally, some states permit fewer than five residents, though some states allow more, and
some states license assisted living/residential care as any CBC setting with one or more
residents (Carder, O’Keeffe, & O’Keeffe, 2015). Some states limit the type of assistance that
AFHs may provide to meals and personal care, but Oregon permits AFHs to serve individuals
who meet the state’s nursing home level-of-care criteria and to receive Medicaid payments on
behalf of residents who meet eligibility criteria.
Oregon Department of Human Services (DHS) contracted with Portland State University’s
Institute on Aging to collect information from AFH providers, including:
Health promotion policies/activities
Staff training
Access to healthcare providers
Household occupants
Provider and staff certifications
Monthly rates and fees
Move-out triggers
Marijuana policies
Providers were asked questions about their current residents, including:
Care needs and acuity level
Demographics
Length of stay and move-in and -out information
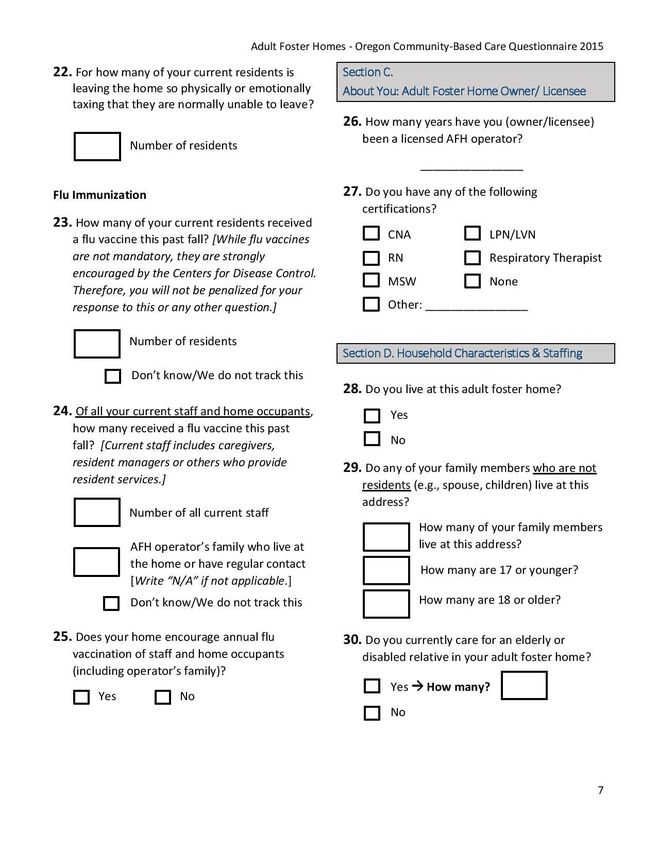
7 Flu immunization
Payment source
Health service use
AFHs in Oregon are licensed by DHS, with the exception of those in Multnomah County.
Multnomah County is responsible for licensing and overseeing AFHs within the county
(Multnomah County, 2011, p. 5).
At the start of the current survey, there were 1,692 AFHs with a licensed capacity of 7,475
beds. This report describes results based on a random statewide survey of 626 AFHs. Of these,
319 responded, for a 51% response rate. The research methods are described in Appendix A,
page 30. In addition to this report and the one from last year, PSU completed a report based on
a statewide survey of assisted living, residential care, and memory care, available from DHS and
PSU1.
1
Available at https://www.pdx.edu/ioa/oregon-community-based-care-project
8Adult Foster Home Characteristics
This section includes:
Number of adult foster homes and licensed capacity
Information about foster home providers
Challenges and positive aspects of being an adult foster home operator
Plans to sell or transfer an AFH to another owner
Licensed Capacity and Occupancy Rates
A total of 319 AFHs completed the questionnaire. Survey respondents were licensed to care
for up to 1,401 residents (capacity) and reported a total of 1,218 current residents
(occupancy), for an occupancy rate of 87 percent (Table 1). This occupancy rate does not
describe the number of homes at full capacity. Given that AFHs are small, operating at capacity
might be important for the home’s economic sustainability. For example, a home licensed for
five residents could have between one and five residents. Sixty-percent of AFH providers were
at full capacity. Of the homes licensed for five residents, 62 percent actually had five residents
(see Table 2). This reality explains the difference between the overall occupancy rate of 87
percent and the lower percentage of homes operating at full capacity.
Table 1 –Occupancy Rate
Total Licensed Capacity of Occupancy of survey Occupancy rate
Survey Respondents respondents
1,401 1,218 87%
Table 2 – Rate of AFH Respondents at Full Capacity
Licensed capacity At maximum capacity
% (n) % (n)
1 resident 6% (20) 100% (20)
2 residents 3% (9) 78% (7)
3 residents 6% (20) 50% (10)
4 residents 13% (40) 30% (12)
5 residents 72% (230) 62% (143)
Overall 319 60% (191)
Adult Foster Home Providers
Providers had been licensed for 11.5 years on average, ranging from one to 41 years. About half
had been providers for one to 10 years, and 14 percent had been providers for over 20 years.
Eighty-five percent of providers lived at their AFH, and of those, 72 percent had family
members living in the home. Of these family members, 29 percent were age 17 or
younger. These numbers differ from last year’s reported rates (See Table 3).
9Table 3 – Providers Living in AFH by Year
2015 2016
% (n) % (n)
Live at AFH 89% (200) 85% (272)
Family in AFH 56% (115) 72% (196)
Average number of family
members 2.1 2.2
17 or younger 32% (76) 29% (126)
18 or older 68% (162) 71% (303)
AFH providers may care for a relative who is elderly or disabled and is not counted as part of
the licensed capacity—seven percent of providers cared for an elderly or disabled relative in
their AFH.
The majority of AFHs reported having private rooms (90 percent) rather than shared rooms (10
percent).
Providers are not required to hold a health care certification or license. However, 22 percent of
AFH providers were CNAs, which was the most commonly reported health care certification.
Table 4 – Provider Certification by Year
Provider Provider
certification, certification,
2015 2016
CNA 21% (48) 22% (70)
RN 5% (11) 5% (17)
LPN/LVN 4% (8) 3% (10)
MSWphysical disabilities (APD) had a lower annual staff turnover rate, at 50 percent, compared to
other long-term care settings. In addition, slightly fewer AFH operators referenced issues with
Medicaid reimbursement as their most significant challenge. More specifically, they cited low
reimbursement rates for services provided, and some reported difficulties with the increasing
complexity and amount of paperwork required for reimbursement. Other AFH operators
reported care for residents with Alzheimer’s or other dementias and working with families of
residents as their most significant challenges.
When asked to identify the most positive aspects of being an AFH operator, nearly all
respondents cited caring for their residents and making a difference in their residents’ lives.
Others reported having their own business as the most positive aspect of being an AFH
operator. The following examples represent some of the most common responses.
“The [most positive] aspects of [being an] adult foster home operator are being your own boss
and knowing you do meaningful work that is important.”
“Being there for residents and families in usually a most difficult time is rewarding. We get to
provide them with peace in knowing that our residents are well taken care of in a warm and
loving environment. “
“Making a difference in someone's life is a goal we love. Providing what the elderly need is my
reward, or better to say being able to provide it when needed makes us accomplished. The
beauty about foster care homes is the one-on-one care that is meant for the most vulnerable
population: the elderly.”
Planning to Sell Home
As a way of understanding the stability of current AFHs in the near future, providers were asked
if they were thinking about selling or transferring their AFH to another owner. Seventeen
percent (52 homes) of current AFH owners indicated that they were thinking about selling or
transferring their home in the next five years.
11Adult Foster Home Staff
Who Works in Adult Foster Homes?
AFH providers may hire full- or part-time caregivers to provide personal care assistance to
residents. These staff are not required to be licensed or certified, but all paid caregivers must
complete DHS-approved training, complete in-home training provided by the owner/manager
of the AFH, and be competent to address residents’ needs (Oregon Department of Human
Services, 2013).
If the licensed AFH provider does not live in the home, a resident manager must be employed
and reside on-site. Resident managers were employed by 24 percent of AFHs (76 homes), and
of these, 84 percent had one resident manager and 16 percent had two. Last year’s report
found that 16 percent of AFHs employed a resident manager.
Forty-two percent of homes employed at least one caregiver (see Table 5). Most AFHs
employed one to three caregivers, although 12 percent of homes did not employ a caregiver,
compared to 20 percent last year. AFHs employed, on average, 2.2 caregivers (compared to 1.6
last year). In the prior report, 20 percent reported having employed no additional caregivers.
Table 5 – Number of Caregivers Employed by Year
Number of caregivers, 2015 Number of caregivers, 2016
% (n) % (n)
0 20% (46) 12% (38)
1 35% (80) 23% (72)
2 26% (58) 32% (100)
3 9% (20) 19% (61)
4 2% (4) 8% (24)
5 or more 8% (18) 7% (21)
This year, providers were asked whether their caregivers (if any) held any healthcare
certifications or licenses. Most caregivers did not hold a certification or license, though 19
percent did (Table 6). Oregon administrative rules do not require AFH caregivers to hold
healthcare certifications.
12Table 6 – Caregiver Certifications
Caregivers
% (n)
LPN/LVN 2% (15)
CNA 14% (94)
CMA 3% (22)
Personal Care
81% (552)
(not licensed or certified)
Staff Training Topics
Adult foster home providers, resident managers, and caregivers are required to complete at
least 12 hours of annual continuing education. Providers were asked whether they had covered
any of several training topics in the prior 12 months. As shown in Figure 1, the top five most
common training topics were medication administration, safety, disease-specific training,
resident rights, and nutrition.
Medication administration 91%
Safety 89%
Disease-specific 82%
Residents' rights 78%
Nutrition/food management 75%
Communication/problem solving 71%
How to prevent communicable diseases 68%
Abuse 64%
Working with families 60%
Person-directed care 58%
Other 21%
0% 10% 20% 30% 40% 50% 60% 70% 80% 90% 100%
Figure 1 – Staff Training Topics Covered in the Prior 12 Months
Besides the staff training options listed in the questionnaire, the most common additional
training topics described by providers included resident-specific needs (e.g. behavior
management for residents with Alzheimer’s/dementia, enhancing resident well-being, end-of-
life care), regulations (e.g., marijuana law, DHS regulations), and additional staff training (e.g.
communication with medical providers, record keeping, documentation).
13Cultural Compatibility
As a possible indicator of fit between resident and staff culture, we asked about languages
other than English spoken by both residents and staff. The language most commonly spoken by
staff was Romanian. For residents, the most common language was Spanish. These numbers
are small, however, with only four percent of all residents primarily speaking a language other
than English. Thirty-six homes reported at least one resident who spoke a language other than
English, and of these, 39 percent (14 homes) reported language compatibility between the
resident and an employee (Table B.1 in Appendix B).
Visits to the Adult Foster Home by Health Service Professionals
AFH providers serve individuals who may have difficulty leaving the home for health services.
The survey asked whether health service professionals visited the home to provide services
and/or training.
Figure 2 compares the percent of homes that were visited by each of six types of professionals.
For 2016, in order of most to least, homes were visited by a: licensed nurse, case manager,
physical or occupational therapist, medical doctor (MD) or nurse practitioner (NP), hospice
worker, mental health provider, and dentist/dental hygienist. Twelve percent of homes were
not visited by any of these health professionals.
80% 76%
72%
70% 66%
60%
50% 49%
50%
38% 39%
40% 36% 35%
31%
30%
20%
20% 13%
10%
0%
Licensed nurse Case manager PT or OT MD or NP Hospice Mental health
2015 2016
Figure 2 – Visits from Health Service Professionals in 2015 and 2016
14Table 7 provides information about visits by health service providers in each of four regions in
Oregon (see Figure A.1 in the Appendix for map of regions).
Table 7 – Visits from Health Service Professionals by Region
Region 2: Region 3:
Region 1: Region 4:
Willamette Southern
Portland East of the Total
Valley/North Oregon/South
Metro Cascades % (n)
Coast Coast
% (n) % (n)
% (n) % (n)
Hospice 36% (54) 25% (20) 24% (13) 35% (12) 31% (99)
Nurse 74% (111) 48% (38) 57% (31) 82% (28) 66% (208)
MD 50% (75) 25% (20) 9% (5) 32% (11) 35% (111)
MH 15% (23) 15% (12) 6% (3) 6% (2) 13% (40)
Physical/occupational
42% (63) 27% (21) 46% (25) 38% (13) 38% (122)
therapist
Case manager 47% (71) 52% (41) 48% (26) 65% (22) 50% (160)
Dentist/hygienist 16% (24) 3% (2) 4% (2) - 9% (28)
Other 11% (16) 5% (4) - 6% (2) 7% (22)
Total 150 79 54 34 317
The rates of visits by health service professionals vary somewhat from those reported last year.
For all regions, AFHs reported fewer visits from health service professionals compared to last
year. Although the percent of homes reporting that a case manager visited was lower this year,
the survey was modified from last year when the question referred to social worker or case
manager. Next year’s survey will again include social worker.
AFHs in Region 1, the Portland Metro region, reported the greatest percentage of visits from
hospice workers, medical doctors, and dentists/dental hygienists. AFHs in Region 3, Southern
Oregon/South Coast, reported the greatest percentage of visits from physical and/or
occupational therapists. AFHs in Region 3 was the most likely to have had no health
professionals visit the home in the past 90 days. AFHs in Region 4, East of the Cascades,
reported the highest percentage of visits from nurse and home health providers and case
managers. Visits from dentists or dental hygienists was not asked in the prior survey.
Health Promotion Activities
Providers were asked to describe their policies regarding two health promotion activities: falls
risk assessment and encouraging flu vaccinations for staff. Falls among older adults are an
important public health issue; falls are the eighth leading cause of unintentional injury for older
Americans and result in as many as 16,000 deaths in a year (Oliver, Healy, & Haines, 2010).
15Oregon’s DHS encourages AFH providers to use a validated fall risk assessment tool such as the
Centers for Disease Control’s STEADI (Stop Elderly Accidents, Deaths and Injuries) tool, the TUG
(Timed Up and Go) test, or another tool that has been shown to reliably assess fall risks among
older adults. Forty-six percent of homes used a fall risk assessment tool as a matter of
standard practice or on a case-by-case basis (Figure 3).
23% 21%
23%
33%
Don't know No Case-by-case Yes
Figure 3 – Use of a Fall Risk Assessment Tool
Providers were asked whether they encourage employees and other home occupants besides
the AFH residents (e.g., provider’s family members) to get an annual flu vaccination. Oregon
statute [§ 433.416] does not permit employers to require vaccinations as a condition of
employment, unless such immunization is otherwise required by federal or state law, rule, or
regulation [1989 c.949 §3]. However, DHS supports the Centers for Disease Control
recommendation that all health service workers be vaccinated annually against influenza (CDC,
2015a), and encourages facilities to provide easy vaccination access for staff through on-site flu
clinics and to provide staff with accurate information regarding the importance of influenza
vaccines. Seventy-six percent of AFH providers encouraged employees and other home
occupants (besides residents) to get an annual flu vaccination.
16Rates, Fees, and Medicaid Use
How Much Do Adult Foster Homes Cost?
The cost of AFHs, as with other CBC settings, is an important topic for both state policymakers
and residents who pay using personal resources. Providers were asked several questions about
payment sources (private and Medicaid), monthly base and total charges, fee structures, and
additional fees.
Sixty-three percent of the responding AFHs had private-pay residents. Providers were asked to
describe the average total monthly private-pay charge for a single resident living alone and
receiving the lowest level of care in a private room (Table 8). The mean monthly charge for the
191 responding AFHs was $3,202. When comparing the average total monthly charges by the
four regions in Oregon, the highest rates were found in the Portland Metro area, and the
Willamette Valley/North Coast.
Table 8 – Average Total Monthly Charge for Private Room
Minimum Average Maximum
Region 1: Portland Metro $950 $3,325 $5,325
Region 2: Willamette Valley/North Coast $570 $3,170 $6,000
Region 3: Southern Oregon/South Coast $800 $3,018 $4,300
Region 4: East of the Cascades $700 $2,950 $4,350
AFH providers structure their monthly rates in at least four different ways. Forty-six percent of
homes charged each resident the same monthly rate, 21 percent charged a base rate plus
additional fees based on services provided, 19 percent based the monthly rate on the resident’s
care needs, and 13 percent negotiated with the resident (or payee) based on ability to pay
(Figure 4).
1%
13%
19% 46%
21%
Flat monthly rate Base rate plus fees
Monthly rate based on care needs Rate negotiated with resident
Other
Figure 4 – Rate Structures Reported by AFHs
17While homes had different ways in which they charged residents for care and services, this
affects the number and percentage of residents paying in these different ways. Fifty percent of
AFHs charged their residents a flat monthly fee. However, of current residents, only 18 percent
lived in a home that charges a flat fee. The majority of residents paid a base rate plus additional
fees based on services provided (Figure 5).
9% 1%
18%
55%
18%
Base rate plus fees Flat monthly rate
Monthly rate based on care needs Rate negotiated with resident
Other
Figure 5 – Percent of Private-Pay Residents Paying by Type of Rate
AFH providers sometimes charge additional fees for certain services (Table 9). The most
commonly reported services for which an additional fee was charged included:
catheter/colostomy or similar care (77 percent), advanced memory care (72 percent), two-
person transfer assist (72 percent), advanced diabetes care (70 percent) and night-time care
(68 percent).
Table 9 – Available Services and Additional Charges
Available Charge
% (n) % (n)
Night-time care 86% (171) 68% (116)
Advanced MC 68% (134) 72% (97)
Two- or more person transfer assist 68% (133) 72% (97)
Obesity care 41% (82) 46% (38)
Catheter/colostomy 76% (150) 77% (116)
Advanced diabetes care 81% (161) 70% (111)
Other 73% (30) 77% (24)
18Medicaid
The majority of AFHs—84 percent—accepted Medicaid as a source of payment for residents.
The 265 AFHs that accepted Medicaid reported 719 current residents whose payment is
Medicaid. Twenty-four providers had a Medicaid contract in the past but no longer do. In
addition, 90 percent of AFHs reported that they would allow a current private-pay resident
who spent down their assets to the Medicaid level to stay and pay with Medicaid (if they
qualified).
Profession Charges
With data from DHS on Medicaid expenditures paid in 2015 (including room and board charges)
and data provided by respondents on the average monthly charge for single occupancy, we
estimated the total annual private pay charges for AFHs in Oregon. As indicated in Figure 6, the
total estimated charges were $171,391,409, of which 61 percent were private pay charges, 39
percent were for Medicaid services (see Appendix A, Table A.2 for detailed calculations).
Medicaid services
(total paid),
$66,944,729
39%
Private Pay
(estimate),
$104,446,680
61%
Medicaid services (total paid) Private Pay (estimate)
Figure 6 – Estimated Total Annual Charges for AFHs in Oregon
19Community Services and Policies
What are Common Services and Policies?
Move-Out Policies
Providers were asked which of four needs and behaviors would typically prompt a move-out
notice to a resident (Table 10). Oregon rules (OAR 411-50) permit AFH operators to move out or
transfer a resident for any of seven specified conditions, including medical reasons, behaviors
that pose an imminent danger to the resident or others, and behaviors that interfere with the
rights of other residents. Sixty-nine percent of AFHs listed hitting others/acting in anger as a
reason for a move-out notice. A much smaller percentage of homes listed the other three
topics as reasons for a move-out notice. These results are similar to those for other CBC settings
in Oregon. Specifically, 41 percent of AL, RC, and MC settings listed hitting others/acting in
anger as a reason for a move-out notice, 23 percent listed wandering outside, 15 percent listed
two-person transfer assistance, and three percent listed sliding scale insulin (e.g., insulin dosage
varies daily and so the dosage cannot be pre-filled). Thus, a larger proportion of AFHs compared
to the other CBC settings reported that these behaviors and needs could prompt a move-out
notice.
Table 10 – Resident Needs and Behaviors that Prompt a Move-Out Notice
% (n)
Two-person transfer 27% (84)
Wandering outside 27% (84)
Sliding-scale insulin shots 5% (15)
Hitting/acting out towards residents/caregivers 69% (218)
Other 25% (79)
Additional reasons for a potential move-out notice described by providers included that the
resident’s care needs could not be met (9 percent), non-payment (8 percent), danger to self or
others (4 percent), failure to follow house rules (3 percent), and behavior-related difficulties (2
percent).
Marijuana Policy
Oregon has two laws concerning marijuana use that might affect AFH residents and staff. The
Oregon Medical Marijuana Act (Oregon revised statute 475) permits individuals with certain
chronic health conditions to use medical marijuana to treat symptoms associated with their
condition. In 2015, the state passed legislation regarding recreational use of marijuana (ORS
475B). Providers were asked if they had a written policy that allowed residents to use marijuana
for medical reasons, and if they had a written policy that allowed residents to use recreational
marijuana.
20Thirty percent of the responding AFHs reported they had a written policy that permits residents
to use medical marijuana. Fewer facilities (10 percent) have a written policy that permits
recreational marijuana use among residents. It is possible that some AFHs have written policies
that prohibit the use of either medical or recreational marijuana.
21Residents
Who Lives in Adult Foster Homes?
Of the 1,218 residents who were living in the responding AFHs, 66 percent were female, 90
percent were White, non-Hispanic, 91 percent single or un-partnered, and 42 percent were 85
years of age or older (Figure 7 & Tables B.2 and B.3 in Appendix B). Ages ranged from 27 to 103
years old with an average of 77 years of age. About 22 percent of residents were under 65 years
of age. Compared to last year’s report, these demographics are nearly unchanged.
6%
16%
42%
17%
18%
18-49 50-64 65-74 75-84 85 and over
Figure 7 – Age Distribution of AFH Residents
Although the majority of residents in AFHs were White, non-Hispanic (90 percent), residents
who were Hispanic of any race, Asian or Black each made up two percent of the resident
sample (6 percent in total). All other racial or ethnic groups made up one percent or less of the
resident sample.
Move-In and Move-Out Locations
AFH operators were asked to describe where residents had been living prior to moving into the
AFH, and the destination of residents who had moved out in the prior 90 days (Figures 8, 9, and
Table B.4 in Appendix B). The largest percentage of residents moved into their current AFH
from home (20 percent). It was much less likely for residents to move in from memory care (2
percent), a hospital stay (7 percent), or from an independent living setting (8 percent). These
numbers were similar to those from last year, except that fewer residents moved in from
assisted living or residential care – from 24 percent last year to only 13 percent this year.
22Don't know 0.40%
Other 2%
MC 2%
Hospital 7%
Independent living 8%
Home of relative 13%
AL/RC 13%
AFH 16%
NF 18%
Home 20%
0% 5% 10% 15% 20% 25%
Figure 8 – Resident Location Prior to Move-In
The majority of residents discharged in the prior 90 days died at the AFH (49 percent) (Figure
9). This represents a difference from last year, in which a reported 59 percent of residents
who moved out did so due to death. Among the residents who did not pass away in the home,
most moved to another AFH (10 percent) or to their home in the community (8 percent). There
was a difference over last year in the percentage of residents who moved out to assisted living
or residential care settings – from nine percent to five percent.
Other 2%
Independent living 2%
Hospital 3%
MC 4%
Home of relative 4%
NF 5%
AL/RC 5%
Don't know 7%
Home 8%
AFH 10%
Died 49%
0% 5% 10% 15% 20% 25% 30% 35% 40% 45% 50%
Figure 9 – Resident Move-Out Location
Length of Stay
Length of stay in AFHs is an important indicator of quality of care and quality of life for
residents because transitions between care settings negatively affects health and wellbeing.
Providers were asked to indicate the length of stay of all residents who moved out in the prior
90 days. Most of these residents had stayed for less than one year (62 percent). Stays of 30
23days or less accounted for about 12 percent of moves, and stays of 90 days or less accounted
for 30 percent of all moves (Figure 10 and Table B.4 in Appendix B). These rates were seven
percent and 18 percent, respectively in the other CBC settings surveyed. Shorter lengths of stay
were much more likely in AFHs, as compared to other CBC settings in Oregon, such as assisted
living, residential care, or memory care.
20%
18% 18%
18%
16% 15% 15%
14%
14%
12%
10% 9%
8%
6% 5% 5%
4%
2%
2%
0%
1 - 7 days 8 - 13 14 - 30 31 - 90 3-6 6 - 12 1-2 2 - 4 4 or more
days days days months months years years years
Figure 10 – Resident Length of Stay upon Move-Out
Personal Care Needs
Personal care needs include activities of daily living (ADLs) and other self-care activities that
adults need to function in daily life, such as eating, transferring from a bed to chair, dressing,
bathing, using the bathroom, support with incontinence, and mobility. Hedrick, Sullivan, Sales &
Gray’s (2009) study of adult foster care, assisted living, and adult residential facilities in
Washington reported that of the three types of settings, adult foster care homes were more
likely to assist residents with eating, mobility, transfers, and toileting. Among respondent
homes in Oregon, more than three-quarters of AFH residents required assistance with bathing
(82 percent).
Personal care needs in which more than half of residents required assistance include
incontinence, dressing, and using the bathroom. Seventy-seven percent of residents used a
mobility aid to get around and 47 percent required staff assistance with mobility. The 2014
national survey reported that residential care residents required support with these daily
activities at much lower rates compared to Oregon AFH residents (Table 11) (Harris-Kojetin,
Sengupta, & Park-Lee, 2016). Compared to the national findings, which included residences
with six or more residents, the percentage of residents needing assistance with ADLs was higher
in Oregon AFHs.
24Table 11 – Comparison of Residents’ Personal Care Needs
AFH AL/RC/MC National
% % %
Eating 24% 9% 20%
Transfer from bed/chair 43% 27% 30%
Dressing 59% 48% 47%
Bathing 82% 65% 62%
Using the bathroom 52% 39% 39%
Incontinence 60% 42% -
Getting around/mobility 47% 30% 29%
Mobility aid 77% 70% -
Resident Health & Health Service Use
Older persons are likely to have one or more chronic conditions that affect their ability to be
independent (Federal Interagency Forum on Aging-Related Statistics, 2012). The five most
common chronic conditions in AFHs were Alzheimer’s disease or other dementias,
hypertension, depression, heart disease, and arthritis (Table 12). These same top five chronic
conditions were also the most prevalent among other Oregon CBC settings and in findings from
the National Survey of Residential Care Facilities (Khatutsky et al., 2016). Forty-nine percent of
residents have Alzheimer’s/dementia compared to 46 percent of assisted living and
residential care residents in Oregon.
Table 12 – Chronic Conditions
% (n)
Alzheimer’s/dementia 49% (596)
Hypertension 45% (553)
Depression 40% (492)
Heart disease 39% (470)
Arthritis 38% (458)
Diabetes 22% (272)
Osteoporosis 16% (197)
Mental illness 15% (180)
COPD 15% (180)
Intellectual disability 9% (114)
Cancer 7% (84)
Drug and/or alcohol abuse 4% (48)
Total 1,218
25Rates of diabetes among AFH residents (22 percent) were higher among AFH residents
compared to other CBC settings in Oregon (19 percent) and the national rate of 15 percent
(Khatutsky et al., 2016). These rates were similar to all Oregonians age 65 and over (21 percent)
(CDC, 2015b). Cancer rates were the same among AFH residents as in other CBC settings at 7
percent and lower than national rates among residents of RC settings aged 65 and older at 11
percent. Osteoporosis was reported at a similar rate (16 percent) in AFHs, as compared to other
CBC settings in Oregon and nationally (15 percent for both). Rates of COPD were lower in AFHs
in Oregon at 15 percent, as compared to 22 percent in other CBC settings in Oregon and
nationally. However, AFH rates of COPD were higher than rates for Oregon adults age 65 and
over (10 percent) (CDC, 2015b). Rates of arthritis were lower (38 percent) for residents in AFH
compared to Oregon residents age 65 and over (51 percent) (CDC, 2015b).
Rates of depression were 40 percent for AFH residents compared to Oregon residents age 65
and over (21 percent) (CDC, 2015b). Serious mental illness was reported for 15 percent of AFH
residents compared to nine percent in other CBC settings. Prevalence of intellectual or
developmental disabilities was higher among the AFH sample at nine percent, as compared to
one percent in other CBC settings in Oregon and nationally. Four percent of AFH residents
reportedly experienced drug or alcohol abuse.
Most residents did not fall within the prior 90 days – 85 percent had zero falls (Figure 11). Ten
percent of residents had one fall and 5 percent had more than one fall within the prior 90 days.
Reported rates of resident falls in AFHs (15 percent) were lower than among other CBC
settings in Oregon (27 percent) and national statistics on falls among RC residents (21
percent) (Harris-Kojetin, Sengupta, & Park-Lee, 2016). Last year’s report found that 11 percent
of AFH residents had a fall. Of the AFH residents who fell in this current year, 20 percent
experienced a fall that resulted in an injury and 13 percent had a fall that resulted in
hospitalization (Figure 12).
5% 13%
10%
20%
67%
85%
0 falls One fall More than one fall No injury Injury Hospitalization
Figures 11 & 12 – Falls in Prior 90 days and Falls Resulting in Injury or Hospitalization
Hospital Use
Of the total number of AFH residents, 14 percent had been treated in a hospital emergency
department in the prior 90 days (Table B.6 in Appendix B). This figure is slightly higher than the
26national average of 12 percent among users of LTSS (Harris-Kojetin, Sengupta, & Park-Lee,
2016). Six percent of residents had been discharged from an overnight hospital stay in the prior
90 days, which is a lower rate than the national level (8 percent).
The National Survey of Long-Term Care Providers indicates that 62 percent of residential care
communities offer or arrange hospice services (Harris-Kojetin, Sengupta, & Park-Lee, 2016).
Although we did not ask if communities offered or arranged hospice services for their residents
we did ask providers to indicate how many of their residents had utilized hospice services in the
past 90 days. Those receiving hospice care was a total of 10 percent of all residents.
Among all AFHs who responded to the questionnaire, nearly half (45 percent) had at least one
resident who was treated in a hospital emergency room, 22 percent had at least one resident
who had been discharged from an overnight hospital stay, and 29 percent had at least one
resident who received hospice care during the prior 90 days. In last year’s report, 34 percent of
AFHs had at least one resident who received hospice care.
Residents who have Difficulty Leaving the Home
Eighteen percent of residents, compared to 13 percent of residents in assisted living and
residential care, were unable to leave the home because it was too physically and/or
emotionally taxing. These residents lived in 118 different AFHs, accounting for 37 percent of all
AFHs. Of these 118 AFHs, 77 percent had one or two residents who were unable to leave the
home. The purpose of this question was to identify the number of residents who might be
considered “homebound” based on the definition used by the Centers for Medicare and
Medicaid Services (CMS, 2014). Medicare recipients might be eligible for physician home visits
and other services if they meet the CMS definition of homebound.
Medications and Treatments
In Oregon, AFHs provide medication administration to residents who need or request such
assistance. Only two percent of residents take no medications or injections (Table B.7 in
Appendix B). Taking multiple medications, known as polypharmacy, presents possible risks of
adverse health effects (Maher, Hanlon, & Hajjar, 2014). Nursing facility studies show that
patients who are prescribed nine or more medications are at a higher risk of hospitalization
(Gurwitz et al., 2005). Clinical management of nine or more medications is used by the Centers
for Medicare and Medicaid Services as a quality indicator to assess health and health risks of
nursing facility residents (CMS, 2013; Zimmerman et al., 1995). The National Nursing Home
Survey reported that 40 percent of nursing home residents take nine or more medications
(Dwyer, Han, Woodwell, & Rechtsteiner, 2010). Among Oregon AFH settings, 54 percent of
residents were taking nine or more medications, which represents an increase of four
percentage points over the rate reported last year. This rate of polypharmacy (54 percent),
though similar to other CBC settings in Oregon overall (55 percent), is higher than the national
level (in nursing homes) and an increase of 4 percent over last year’s report.
27Antipsychotic medications were used by 34 percent of AFH residents compared to the
national rate of use among nursing home residents (25 percent) (Clark, 2012). Antipsychotic
medications are sometimes prescribed to treat behavior associated with dementia, but this
practice is not supported clinically and is considered off-label by the Food and Drug
Administration (CMS, 2015; FDA, 2008). The National Center for Assisted Living’s (NCAL) quality
initiative might provide lessons that could be applied to AFH settings. The NCAL set a goal of
reducing antipsychotic medication use in AL settings by 15 percent, or achieving a low off-label
usage rate of five percent (NCAL, 2015). In addition, the DHS EQC Tools and Resources website
is a good location for informing providers on the use of antipsychotic medications in older
persons.
Eighty percent of AFH residents received staff assistance to take oral medications. Eleven
percent received staff assistance with injection medications, two percent received injections
from a licensed nurse, and eight percent received other types of nurse treatments from a
licensed nurse. Use of nurse treatments can be an indicator of resident acuity (Beeber, et al.,
2014).
28Policy Considerations and Conclusions
This report provides information about adult foster home providers, services, and residents. As
the second statewide survey of these settings, it provides comparisons to information collected
last year, comparisons to other CBC settings, and new information. A follow-up survey will be
conducted in 2017 that will allow for additional comparisons over time and to other CBC
settings.
Policy topics that deserve additional attention include:
The finding that 18 percent of residents might meet the CMS definition of homebound
suggests that some residents might qualify for home visits by a medical doctor or nurse
practitioner, but it is unclear whether residents are receiving this benefit.
The rate of antipsychotic medication prescriptions (34 percent of residents) should be
reviewed and, if warranted, providers should receive information on the appropriate
use of antipsychotic medications and, if appropriate, how to reduce the use of these
medications to treat behavioral symptoms.
The percent of residents prescribed nine or more medications, as with other CBC
settings in Oregon, is higher than the national rate for nursing facility patients.
Information about reducing polypharmacy and prescribing practices could be
communicated to state agency staff, medical doctors and other prescribers as well as to
pharmacists who work with these settings.
Residents’ length of stays, while variable, were below 90 days for nearly one-third of
AFH residents. More information is needed to assess the potential reasons for short
stays.
Many AFHs were operating below capacity. This could result in financial instability for
these small operators.
Adult foster home residents had more personal care and health-related needs compared to
residents of assisted living (AL) and residential care (RC), and comparable to memory care
communities. Over half of AFH residents had dementia, more than either AL or RC. Thus, AFHs
provide frail older adults and persons with disabilities an important alternative to other CBC
settings and to nursing facilities.
29Appendix A: Methods
Common Acronyms Used in this Report
LTSS - Long-term Services Supports
APD - Division of Aging and People with Disabilities
DHS - Oregon’s Department of Human Services
OHA - Oregon Health Authority
CMS - Centers for Medicare and Medicaid Services
HCBS - Home and Community-Based Services
Data Collection Instrument - Questionnaire
This report represents the second year of data collection from adult foster homes in Oregon.
The questionnaire was developed in partnership with stakeholders from:
DHS, Division of Aging and People with Disabilities,
Oregon Health Care Association (OHCA),
Service Employees International Union Local 503, and
Leading Age Oregon.
Questionnaire topics included information about home settings and policies, resident
demographics, personal care needs, resident acuity, staffing, flu vaccination, and payment
information, such as rates, fees, and services.
Sample Selection and Survey Implementation
The population of licensed adult foster homes in Oregon as of December 2015 totaled 1,692
statewide. To achieve a generalizable sample size to sufficiently represent this population, a
minimum of 313 questionnaire respondents was needed. Assuming at least a 50% response
rate, we selected a sample of 626 AFHs. To select a sample that would be representative of
adult foster homes throughout the state, we first aggregated counties into four regions (see
Table A.1 and Figure A.1), then calculated the number needed from each region to create a
proportionate sample by region.
A questionnaire was mailed to each AFH in the sample. AFH licensees were asked to complete
the questionnaire and return it to PSU’s Institute on Aging (IOA) via fax, scan and email, or US
postal service. Providers were also given the option of completing the questionnaire over the
phone, which 25 respondents did. Completed questionnaires were checked for missing
information or inconsistencies and follow up calls were made to providers for clarification when
needed. Follow up calls were also made to providers to encourage a favorable response rate.
Data were entered into a database by IOA staff.
30Table A.1 – Regional Distribution of Sample and Response
Sample Response
Population Respondents
Population Rate
% (n) % (n)
% (n) % (n)
Region 1: Portland Metro 50% (847) 50% (313) 47% (150) 48% (150)
Region 2: Willamette
25% (415) 24% (150) 25% (80) 53% (80)
Valley/North Coast
Region 3: Southern
16% (268) 16% (100) 17% (53) 53% (53)
Oregon/South Coast
Region 4:
10% (162) 10% (63) 11% (35) 56% (35)
East of the Cascades
Total 1,692 626 318 51% (318)*
*One respondent completed the questionnaire anonymously and is, therefore, not reflected in
this total as the region is unknown in that case.
Figure A.1 – Oregon Regions by County used for Sampling
Survey Response
A total of 319 AFHs responded, for a response rate of 51 percent. See Table A.1 for details
about responses to the questionnaire by region. The region with the highest concentration of
AFHs was the Portland Metro region, while the East of the Cascades had the fewest, though the
31percentage of respondents was inversely related to the number of AFHs per region. The highest
percentage of respondents was from counties East of the Cascades, while the lowest
percentage was from the Portland Metro region.
Non-Response
A total of 307 AFHs from the sample did not respond to the questionnaire. Reasons given for
non-response included that response was not mandatory, the licensee was not comfortable
sharing information about their homes or residents, and too busy. Respondents are believed to
be no different than non-respondents for at least two reasons. First, representation across
regions was largely similar, with all near or above 50 percent. Second, the licensed capacity of
respondents’ AFHs were similar to that of non-respondents’ within the study sample. As with all
surveys, these findings represent the experiences of respondents and might not represent all
facilities in Oregon. However, a 51 percent response rate meets standard guidelines for reliable
and valid survey research.
Data Analysis
Quantitative data were entered into SPSS (a statistical software program), then checked for
errors (i.e., data cleaning). Quantitative data analysis entailed primarily descriptive statistics
(counts and percentages) and cross-tabulations.
The questions about flu vaccination proved to be unreliable and are therefore not reported
here.
Profession Charges
The calculation of industry charges was inspired by a similar calculation conducted using data
from the national survey of residential care communities (Khatutsky et al., 2016), resulting in
total estimated industry charges nationally. Our study, focused only on AFHs in Oregon, uses
the following method and data from DHS to reach an estimate for industry charges in Oregon.
In the following calculations, the estimated percentage of Medicaid residents was determined
by applying the ratio of facilities with a Medicaid contract among respondents with those of
non-respondents and assumes the same ratio of residents who are Medicaid beneficiaries.
Fewer Medicaid contracts among non-respondents likely results in fewer Medicaid beneficiaries
among non-respondent facilities. Rates of respondent facilities were applied to non-
respondents for occupancy rate and average monthly private pay charges.
32Table A2: Estimated Annual Profession Charges for Oregon AFHs
Estimated Monthly and Annual Profession Charges for Oregon CBC Settings
Questionnaire Respondent Facilities
Private Pay
Total current residents 1218
- Total current Medicaid beneficiaries 719
= Total of current private pay residents 499
x Average total monthly charge including services $3,266
= Total private pay charges $1,629,734
Other Facilities in Oregon (non-respondents)
Private Pay
Licensed capacity 6074
x Occupancy rate* 0.87
= Estimated total current residents 5284
x Estimated % of Medicaid residents** 0.59
= Estimated total Medicaid beneficiaries 3118
Estimated total current residents 5284
- Estimated total Medicaid beneficiaries 3118
= Estimated total private pay residents $ 2,166
x Average total monthly charge including services* $ 3,266
Total est. charges for private pay residents $7,074,156
Estimated Total Annual Private Pay Charges $104,446,680
Total Annual Medicaid Charges Paid (data from DHS) $66,944,729
Estimated Total Annual Industry Charges for All AFHs in Oregon $171,391,409
*Rate of respondents applied to non-respondents
**Estimated proportion of Medicaid residents applies the ratio of facilities with a Medicaid contract among
respondents with those of non-respondents and assumes the same ratio of residents who are Medicaid
beneficiaries. Fewer Medicaid contracts among non-respondents likely results in fewer Medicaid beneficiaries
among non-respondent communities.
33Appendix B: Additional Tables
Table B.1 – Staff and Resident Languages
Languages Staff Residents Languages Staff Residents
Romanian 67 4 Arabic 1 -
Spanish 40 9 ASL 1 -
Tagalog 27 1 Cambodia 1 1
Filipino 15 - Chamorro 1 -
Russian 11 4 Chinese 1 1
German 8 2 Czechoslovakian 1 -
Hungarian 8 - Hebrew 1 -
French 5 2 Native American 1 -
Amharic 4 1 Tamil 1 -
Italian 3 - Thai 1 1
Filipino 3 - Tiwa 1 -
Tigrigna 3 - Tongan 1 -
Ukrainian 3 2 Vietnamese - 4
African 2 - Greek - 2
Hindi 2 1 Bulgarian - 1
Lao 2 3 Estonian - 1
Nepali 2 - Halian - 1
Samoan 2 1 Japanese - 1
Telugu 2 - Korean - 1
Tibetan 2 - Latvian - 1
Visayan 2 - Marshallese - 1
34Table B.2. – Gender, Marital Status, Age
% (n)
Gender
Male 34% (409)
Female 66% (808)
TransgenderTable B.4 – Move-In and Move-Out Locations
Move-in Move-out
% (n) % (n)
Home 20% (50) 8% (8)
Home of relative 13% (33) 4% (4)
Independent living 8% (21) 2% (2)
AL/RC 13% (33) 5% (5)
MC 2% (5) 4% (4)
Hospital 7% (18) 3% (3)
AFH 16% (40) 10% (10)
NF 18% (44) 5% (5)
Other 2% (5) 2% (2)
Died - 49% (48)
Don't knowTable B.7 – Medications and Treatments
% (n)
No medications/injections 2% (35)
Nine or more medications 54% (659)
Antipsychotic medications 34% (419)
Self-administer medications 5% (65)
Receive assistance for oral medications 80% (970)
Receive assistance with injection medications 11% (137)
Receive injections from a licensed nurse 2% (24)
Receive nurse treatment from a licensed nurse 8% (95)
Total 1,218
37Appendix C: References
AoA (Administration on Aging). (2016). Oral Health.
http://www.aoa.gov/AoA_Programs/HPW/Oral_Health/index.aspx.
Beeber, A. S., Zimmerman, S., Reed, D., Mitchell, C. M., Sloane, P. D., Harris‐Wallace, B., & Schumacher,
J. G. (2014). Licensed nurse staffing and health service availability in residential care and assisted
living. Journal of the American Geriatrics Society, 62(5), 805-811.
Carder, P., O’Keeffee, J., & O’Keeffe, C. (2015). Compendium of residential care and assisted living
regulations and policy: 2015 edition. U.S. Department of Health and Human Services. Retrieved
from https://aspe.hhs.gov/basic-report/compendium-residential-care-and-assisted-
living-regulations-and-policy-2015-edition.
Clark, T.R. (2012). The use of antipsychotic medications in nursing home residents -- Questions and
answers. American Society of Consultant Pharmacists. Retrieved
from https://www.ascp.com/sites/default/files/ASCP-QnA-AntipsychoticsFinal.pdf.
CDC (Centers for Disease Control and Prevention). (2015a). Influenza Vaccination Information for Health
Care Workers. Retrieved from: http://www.cdc.gov/flu/healthcareworkers.htm.
CDC (centers for Disease Control and Prevention). (2015b). BRFSS Prevalence & Trends Data. Accessed
May 13, 2016. Retrieved from http://wwwdev.cdc.gov/brfss/brfssprevalence/.
CMS (Center for Medicare & Medicaid Services). (2015). Atypical antipsychotic medications: use in
adults. Retrieved from https://www.cms.gov/Medicare-Medicaid-Coordination/Fraud-
Prevention/Medicaid-Integrity-Education/Pharmacy-Education-Materials/Downloads/atyp-
antipsych-adult-factsheet11-14.pdf
CMS (Center for Medicare & Medicaid Services). (2014). CMS Manual System: Pub 100-02 Medicare
Benefit Policy. Retrieved from: https://www.cms.gov/Regulations-and-
Guidance/Guidance/Transmittals/downloads/R192BP.pdf.
38You can also read