Residential Clothes Dryer Performance Under Timed and Automatic Cycle Termination Test Procedures - ORNL/TM-2014/431
←
→
Page content transcription
If your browser does not render page correctly, please read the page content below

ORNL/TM-2014/431

Residential Clothes Dryer Performance
Under Timed and Automatic Cycle
Termination Test Procedures

                          Kyle Gluesenkamp

                          October 2014
DOCUMENT AVAILABILITY

Reports produced after January 1, 1996, are generally available free via US Department of Energy
(DOE) SciTech Connect.

        Website http://www.osti.gov/scitech/

Reports produced before January 1, 1996, may be purchased by members of the public from the
following source:

        National Technical Information Service
        5285 Port Royal Road
        Springfield, VA 22161
        Telephone 703-605-6000 (1-800-553-6847)
        TDD 703-487-4639
        Fax 703-605-6900
        E-mail info@ntis.gov
        Website http://www.ntis.gov/help/ordermethods.aspx

Reports are available to DOE employees, DOE contractors, Energy Technology Data Exchange
representatives, and International Nuclear Information System representatives from the following
source:

        Office of Scientific and Technical Information
        PO Box 62
        Oak Ridge, TN 37831
        Telephone 865-576-8401
        Fax 865-576-5728
        E-mail reports@osti.gov
        Website http://www.osti.gov/contact.html

              This report was prepared as an account of work sponsored by an
              agency of the United States Government. Neither the United States
              Government nor any agency thereof, nor any of their employees,
              makes any warranty, express or implied, or assumes any legal
              liability or responsibility for the accuracy, completeness, or
              usefulness of any information, apparatus, product, or process
              disclosed, or represents that its use would not infringe privately
              owned rights. Reference herein to any specific commercial product,
              process, or service by trade name, trademark, manufacturer, or
              otherwise, does not necessarily constitute or imply its endorsement,
              recommendation, or favoring by the United States Government or
              any agency thereof. The views and opinions of authors expressed
              herein do not necessarily state or reflect those of the United States
              Government or any agency thereof.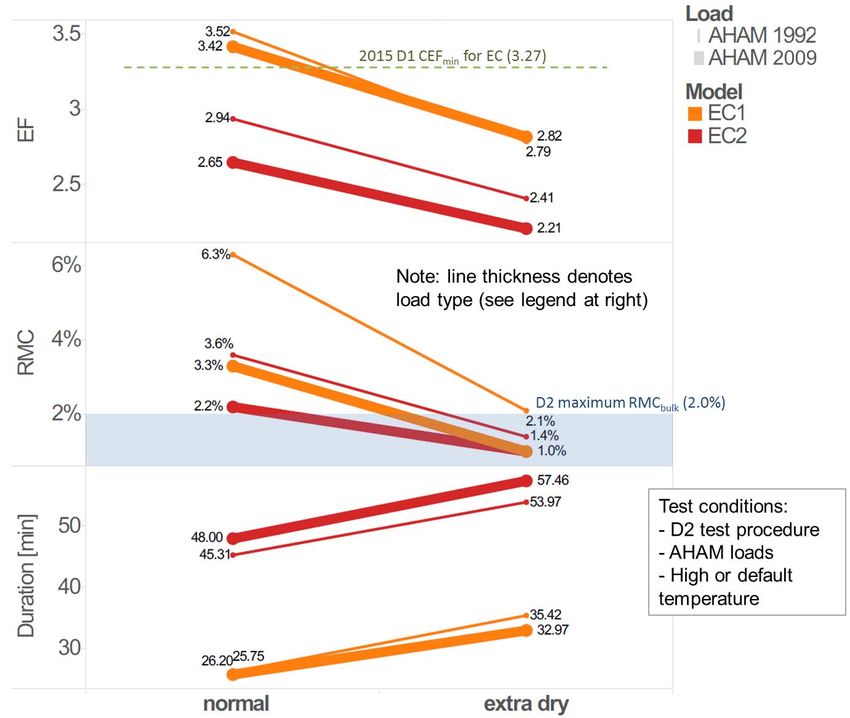
ORNL/TM-2014/431

              Energy and Transportation Science Division

RESIDENTIAL CLOTHES DRYER PERFORMANCE UNDER TIMED AND
     AUTOMATIC CYCLE TERMINATION TEST PROCEDURES

                          Kyle Gluesenkamp

                            Sponsored by
            Building Technologies Office Standards Program
                       US Department of Energy

                    Date Published: October 2014

                            Prepared by
              OAK RIDGE NATIONAL LABORATORY
                 Oak Ridge, Tennessee 37831-6283
                            Managed by
                       UT-BATTELLE, LLC
                               for the
                 US DEPARTMENT OF ENERGY
                under contract DE-AC05-00OR22725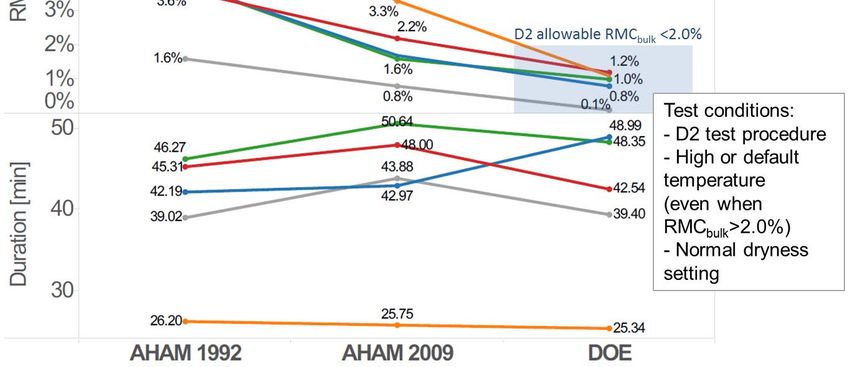
CONTENTS

                                                                                                                                                     Page

LIST OF FIGURES ...................................................................................................................................... v
LIST OF TABLES ...................................................................................................................................... vii
ACKNOWLEDGMENTS ........................................................................................................................... ix
ABBREVIATIONS ........................................................................................................................................
EXECUTIVE SUMMARY ............................................................................................................................
1. INTRODUCTION ................................................................................................................................ 1
    1.1 BACKGROUND ON DRYER TEST PROCEDURES .............................................................. 1
    1.2 BACKGROUND ON DRYER MINIMUM ENERGY EFFICIENCY
         REQUIREMENTS ...................................................................................................................... 3
    1.3 OBJECTIVES ............................................................................................................................. 4
    1.4 METHODOLOGY AND METRICS.......................................................................................... 4
         1.4.1 Approach to Test Procedures ......................................................................................... 4
         1.4.2 Measurement of BDW, RMCbulk, and RMCi ................................................................. 5
         1.4.3 Real-Time RMCbulk Measurements ................................................................................ 5
    1.5 DRYER SETTINGS ................................................................................................................... 6
2. TEST VALIDITY ................................................................................................................................. 7
3. EFFECT OF INVESTIGATED VARIABLES ON BASELINE DRYER PERFORMANCE .......... 11
    3.1 EFFECT OF TEST PROCEDURE (D2 VS. D1) ..................................................................... 13
    3.2 EFFECT OF LOAD TYPE ....................................................................................................... 14
    3.3 EFFECT OF DRYNESS SETTING ......................................................................................... 16
    3.4 EFFECT OF TEMPERATURE SETTING .............................................................................. 17
    3.5 EFFECT OF DRYER MODEL ................................................................................................ 19
4. REPEATABILITY OF RESULTS ..................................................................................................... 23
5. INDIVIDUAL RMC ........................................................................................................................... 27
    5.1 INDIVIDUAL RMC OF BASELINE TESTS .......................................................................... 27
6. DRYER CONTROLS EVALUATION .............................................................................................. 33
    6.1 DESCRIPTION OF EXISTING CONTROLS ......................................................................... 33
    6.2 PROPOSED MODIFIED CONTROLS.................................................................................... 34
    6.3 EVALUATION OF MODIFIED CONTROLS ........................................................................ 36
7. CONCLUSIONS ................................................................................................................................ 43
8. REFERENCES ................................................................................................................................... 45
APPENDIX ............................................................................................................................................... A-1
    A.1 SUPPLEMENTAL INFORMATION ABOUT TEST LOADS ................................................ A-1

                                                                            iii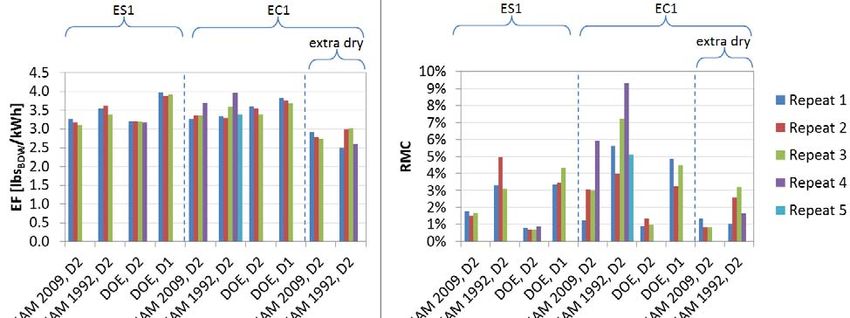
LIST OF FIGURES
Figures Page
Fig. 1. Average and standard deviation (error bars) split-phase voltages at dryer terminal blocks
during each test. ......................................................................................................................... 9
Fig. 2. Average and standard deviation (error bars) of environmental chamber temperature and
relative humidity during each test. ............................................................................................ 9
Fig. 3. Starting moisture content for each test. ........................................................................................... 10
Fig. 4. Bone dry weight for each test. ......................................................................................................... 10
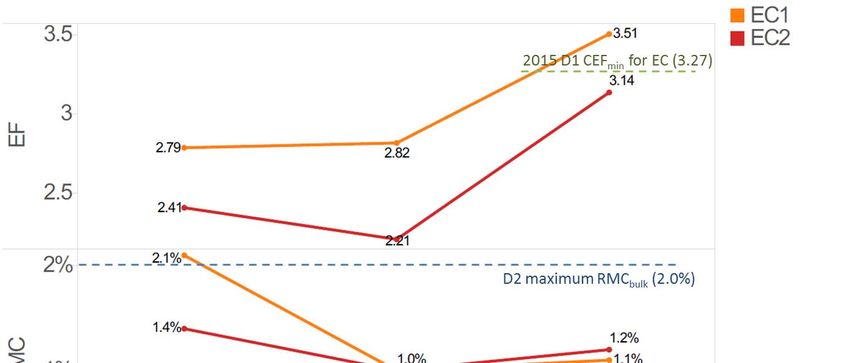
Fig. 5. Effect of test procedure (D2 vs. D1) on EF, RMC, and duration for each model (for tests
with DOE load and high temperature). Blue boxes show target RMCs for each test
procedure. Green dotted lines show the minimum CEF standards effective in 2015 with
D1 test procedure..................................................................................................................... 13
Fig. 6. Effect of test load on EF, RMC, and duration for each model (for tests with D2 test
procedure, high-temperature setting). Blue box shows allowable RMC for DOE cloth.
Green dotted lines (for reference) show minimum CEF standard effective 2015 for CEF
evaluated under D1. ................................................................................................................. 15
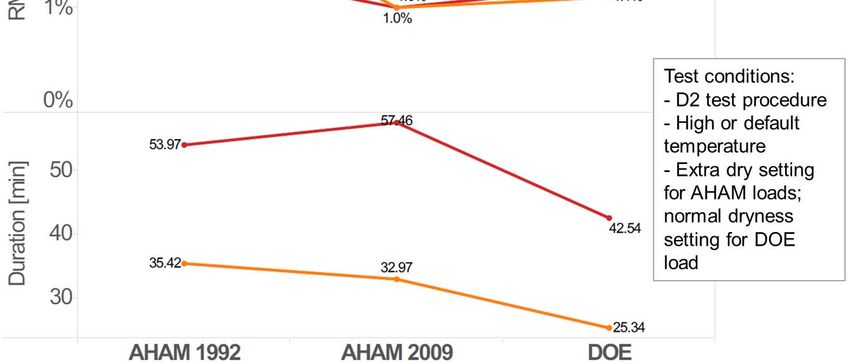
Fig. 7. Performance for EC1 and EC2 when running under the extra dry setting for AHAM 1992
and AHAM 2009 loads (normal dryness setting with DOE load). .......................................... 16
Fig. 8. Effect of dryness setting. ................................................................................................................. 17
Fig. 9. Effect of temperature setting on EF, RMC, and duration for each model and load type for
tests with D2 test procedure. ................................................................................................... 18
Fig. 10. Effect of temperature setting under the D1 test procedure for ES2. .............................................. 19
Fig. 11. Effects of dryer model on EF, RMC, and duration for each test load (for tests with D2 test
procedure and high or default temperature setting). Note that the 2015 CEF standards
are applicable to the DOE load................................................................................................ 20
Fig. 12. Performance results for repeated tests. .......................................................................................... 23
Fig. 13. Effect of test procedure on repeatability of EF for two dryer models with DOE load. ................. 24
Fig. 14. Standard deviations of EF, duration, and RMCbulk under various test procedures and loads. ....... 24
Fig. 15. Effect of dryness setting on variability: standard deviations of EF, duration and RMCbulk for
EC1 dryer with normal and extra dry settings, under D2 test procedure. ............................... 25
Fig. 16. Results of RMCbulk, RMCi, and excess RMCi score for baseline and extra-large load tests. ........ 28
Fig. 17. AHAM 2009 in ES1 dryer at high temperature and normal dryness with automatic
termination (D2 test procedure, rerun of Table 7 #1). ............................................................. 29
Fig. 18. AHAM 1992 in ES1 dryer at high heat and normal dryness with automatic termination (D2
test procedure, rerun of Table 7 #5). ....................................................................................... 29
Fig. 19. DOE cloth in ES1 dryer at high heat and normal dryness with automatic termination (D2
test procedure, rerun of Table 7 #9). ....................................................................................... 29
Fig. 20. DOE cloth in ES1 dryer at high heat with timed dry (D1 test procedure, rerun of Table 7
#13).......................................................................................................................................... 30
Fig. 21. RMCi for the AHAM 2009 half of the double-sized load. ............................................................ 31
Fig. 22. RMCi for the AHAM 1992 half of the double-sized load. ............................................................ 31
Fig. 23. RMCi for the DOE double-sized load. ........................................................................................... 32
Fig. 24. Conceptual illustration of progression of EF and RMC over cycle duration................................. 35
Fig. 25. RMCi.max vs. RMCbulk for baseline (circles), recirculated airflow (squares), and reduced
airflow (plusses) tests with AHAM 2009 load. Dotted line shows ideal limit of uniform
RMCi. Labels for each test show test name, EF value, and when in the cycle the
modification was introduced (at what value of %RMC). ........................................................ 38
v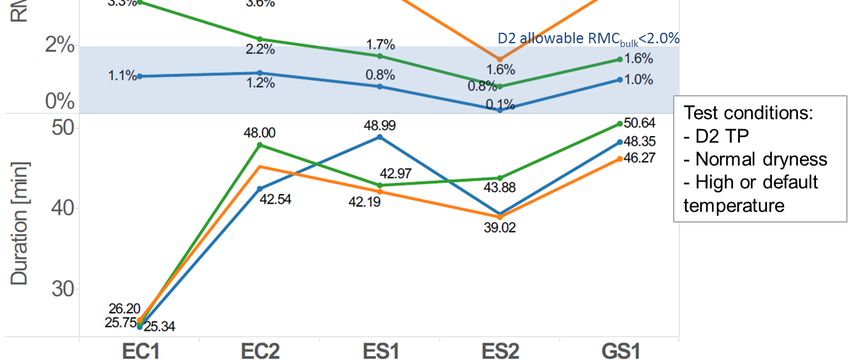
Fig. 26. RMCi,max versus EF for baseline (circles) and reduced airflow (plusses) tests with DOE
             load. Dotted line shows ideal limit of uniform RMCi. Labels for each test show test
             name, EF value, and when in the cycle the modification was introduced (at what value
             of %RMC). .............................................................................................................................. 38
Fig. 27. Individual RMC histogram for test 13R (a baseline timed-dry D1 test)........................................ 39
Fig. 28. Individual RMC histogram for test M8 (reduced airflow starting at 10% RMC).......................... 39
Fig. 29. Real-time RMCbulk vs. exhaust relative humidity for baseline tests and modified tests with
             DOE load. ................................................................................................................................ 40
Fig. 30. Real-time RMC vs. cumulative energy consumption for two baseline and two reduced
             airflow tests. ............................................................................................................................ 41

                                                                           vi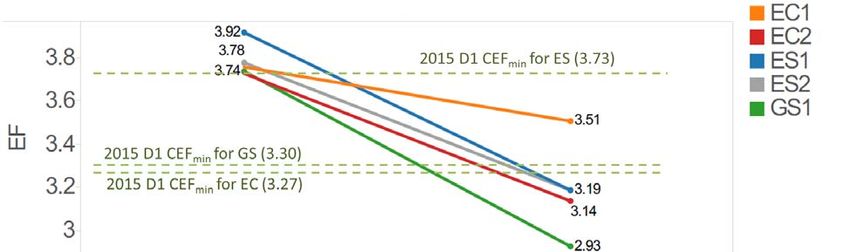
LIST OF TABLES

Tables                                                                                                                                         Page

Table 1. Summary of key test procedure differences among Appendixes D, D1, and D2 ........................... 3
Table 2. Minimum energy efficiency requirements (EF or CEF) for the residential clothes dryer
             types evaluated in this work ...................................................................................................... 3
Table 3. Generic terminology used in this report to describe dryer settings ................................................. 6
Table 4. Equipment and test conditions met or exceeded in this work as required by Appendix D2 ........... 7
Table 5. Instrumentation used in this work ................................................................................................... 8
Table 6. Test matrix for baseline testing designed to allow independent evaluation of the effects of
             four variables of interest .......................................................................................................... 11
Table 7. Key results of baseline test matrix ................................................................................................ 12
Table 8. Items found in each test load ........................................................................................................ 27
Table 9. Test matrix and key results for characterizing RMCi tests ........................................................... 28
Table 10. Summary of dryer controls ......................................................................................................... 33
Table 11. Summary of results with modified controls. The first six rows show unmodified tests for
             reference. All modified tests were conducted under high temperature setting........................ 37

                                                                        vii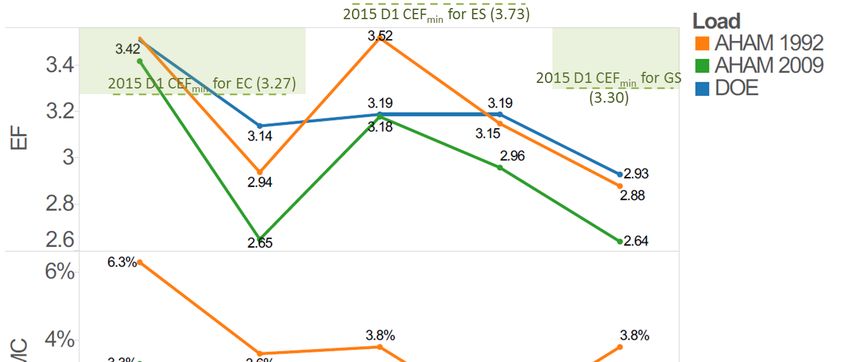
ACKNOWLEDGMENTS

This report and the work described were sponsored by the Standards Program within the Building
Technologies Office of the US Department of Energy (DOE) Office of Energy Efficiency and Renewable
Energy. The author wishes especially to acknowledge the contributions of John Cymbalsky and Ashley
Armstrong of DOE in guiding this work; the insightful review comments of Judith Reich and James
Battaglia of Navigant Consulting; and the role of Patrick Hughes of ORNL in shaping this report. In
addition, this work would not have been possible without the excellent laboratory technician support of
Neal Durfee, Geoffrey Ormston, and Randy Linkous.

                                                  ix
ABBREVIATIONS
1992 shorthand to refer to AHAM 1992 load
2009 shorthand to refer to AHAM 2009 load
A amperes of electric current
AHAM Association of Home Appliance Manufacturers
AHAM 1992 standard test cloth as specified in 1992 dryer test procedure published by AHAM in 1992
AHAM 2009 standard test cloth as specified in 2009 dryer test procedure published by AHAM in 2009
AHAM cloth refers to both AHAM 1992 and AHAM 2009 test loads
BDW bone dry weight
CEF combined energy factor
CFM cubic feet per minute
CFR US Code of Federal Regulations
CI confidence interval
cpt or cpct compact size dryer
D1 test procedure detailed by DOE in Appendix D1 of 10 CFR 430 B
D2 informational test procedure detailed by DOE in Appendix D2 of 10 CFR 430 B
DOE US Department of Energy (often used as shorthand to refer to standard test load as
specified by the DOE dryer test procedure)
DP dew point temperature
EC electric compact
EC1 electric compact dryer model 1
EC2 electric compact dryer model 2
EF energy factor [lbsBDW/kWh]
ES electric standard
ES1 electric standard dryer model 1
ES2 electric standard dryer model 2
g gram
GS gas standard
GS1 gas standard dryer model 1
L1-L2 voltage measured between two legs of split-phase power
L1-N voltage measured between first leg of split-phase power and neutral
L2-N voltage measured between second leg of split-phase power and neutral
lb pound
ORNL Oak Ridge National Laboratory
RH relative humidity
RMC remaining moisture content (unless noted, this refers to the final bulk RMC at end of test)
RMCbulk bulk RMC (i.e., average RMC for an entire load)
RMCi individual RMC of a single piece of cloth
RMCi,max maximum individual RMC among all cloths within a load
SMC starting moisture content
T temperature
TC thermocouple
TP test procedure
VAC A/C voltage
ω humidity ratio [lbwater/lbdryair]
Abbreviations used in describing test cloths:
BX boxer shorts (89 g in AHAM 1992)
HC handkerchief (14 g AHAM 1992)PC pillow case (74 g in AHAM 1992; 219 g in AHAM 2009)
SH sheet (775 g in AHAM 1992; 677 g in AHAM 2009)
ST stuffer cloth (like a handkerchief) (17 g in DOE)
SR long sleeve shirt (273 g in AHAM 1992)
TC table cloth (314 g in AHAM 1992)
TS t-shirt (138 g in AHAM 1992)
TW towel (99 g hand towel in AHAM 2009; 99 g dish towel in DOE; 280 g bath towel in
AHAM 1992)
iEXECUTIVE SUMMARY The US Department of Energy (DOE) test procedure for rating the energy performance of residential clothes dryers is defined in the US Code of Federal Regulations, 10 CFR Part 430, Subpart B. As of this writing, Appendix D is the mandatory test procedure, Appendix D1 becomes effective January 1, 2015, and Appendix D2 is provided for informational purposes and might become mandatory at a later date. The D and D1 test procedures evaluate dryers under manual termination by the test operator and include “field use” correction factors to adjust for differences between the test procedure and actual consumer use. The D2 test procedure is intended to directly measure dryer performance under automatic cycle termination. In this study, high-quality data were acquired and documented to help inform stakeholders how dryer performance would be characterized under the D1 and D2 test procedures. This information might provide a better foundation for improving the performance of residential clothes dryers in the future. The work investigated two standard size electric dryers, two compact size electric dryers, and one standard size gas dryer. All dryers use a tumble-type drum with forced air passed through the drum to dry clothes. All dryers are the vented type, where air is sourced from the conditioned, indoor space of the home and after circulating through the drum is exhausted through a duct to the outdoors. Both the D1 and D2 test procedures use bulk remaining moisture content (RMCbulk) as a performance metric. The DOE test load contains 39 individual pieces of clothing, the Association of Home Appliance Manufacturers (AHAM) 2009 test load contains 22, and the AHAM 1992 test load contains 16. In this study some effort was expended to examine the RMC of individual pieces of clothing in the load (RMCi). Only limited testing was conducted but insights from this data may suggest strategies for dryer performance improvement. This work also included preliminary investigations of automated cycle termination concepts not currently used in commercially available residential clothes dryers. Comparison of RMCbulk and RMCi data suggested that perhaps once RMCbulk reaches some threshold, what is needed is not so much additional drying but a homogenization of RMCi among the items in the load. Although the preliminary concepts evaluated here did not demonstrate clear benefits over existing approaches this might be an avenue for improving dryer efficiency in the future.
1.   INTRODUCTION

This report documents the results and conclusions from laboratory evaluations conducted at Oak Ridge
National Laboratory (ORNL) to establish the baseline performance of off-the-shelf residential clothes
dryers under two test procedures and the potential for improving dryer performance through
modifications to moisture-sensing methods and controls.

The energy efficiency of a dryer while operating is measured as the energy factor, or EF. Determining EF
under the US Department of Energy’s (DOE’s) current test procedure involves a test operator manually
stopping the dryer as it reaches a desired range of dryness. As of this writing, DOE had released for
informational purposes a test procedure based on automatic cycle termination, which measures the dryer
performance under automatic termination.

In direct relation to the prospective automatic termination test procedure, two key questions addressed in
this work are:

1. Would using automatic termination change the repeatability of test results from one identical test to
   another?

2. Can an improved strategy for sensing and/or control lead to more efficient dryer operation under
   automatic termination?

In addition, this work also addresses the following questions, which are not directly related to the
prospective automatic termination test procedure:

1. What is the performance (and repeatability of performance) of clothes dryers when using test loads
   other than those specified in the DOE test procedure?

2. What is the effect of dryer temperature setting on performance?

The remainder of Sect. 1 provides more detail on the background of clothes dryer efficiency testing, the
objectives and methodology for this work, and the terminology adopted to describe the settings typically
available on clothes dryers while allowing the dryer models to remain anonymous.

In Sect. 2, data are shown to demonstrate the validity of the tests conducted in this work, according to the
requirements of the DOE test procedures and additional requirements imposed on this work. Section 3
presents the effects of test procedure, load type, temperature setting, and model on dryer performance.
Section 4 presents data on the repeatability of performance as functions of the variables investigated in
Sect. 3. A new way of measuring the dryness of test loads is introduced with measured data in Sect. 5.
The existing dryer controls are characterized and some test results for modified controls are presented in
Sect. 6. Finally, conclusions are summarized in Sect. 7.

1.1   BACKGROUND ON DRYER TEST PROCEDURES

DOE requires residential clothes dryers to be tested for compliance with minimum energy efficiency
standards, as defined by the EF. The EF incorporates the energy used in the active drying cycle. The
current test procedure for measuring the EF of residential clothes dryers is defined in the US Code of
Federal Regulations, 10 CFR Part 430, Subpart B, Appendix D (10 CFR 430 2013).

DOE published final rules on January 6, 2011, and August 14, 2013, that provided some amendments to
the existing manual-termination test procedure in Appendix D; established a new energy efficiency

                                                     1
metric, as defined by the combined energy factor (CEF), which incorporates the energy used in the active
drying cycle (the EF) as well as standby and off mode power consumption; established a new manual-
termination test procedure in Appendix D1, with a mandatory compliance date of January 1, 2015; and
established a new automatic-termination test procedure in Appendix D2 for informational purposes (76
FR 972; 78 RF 49608).
Compared with Appendix D, Appendix D1 starts with clothes less wet, uses a larger load, and uses cooler
water (60°F instead of 100°F) to wet the clothes. Appendix D is not discussed any further in this report.
The key difference between informational Appendix D2 and soon-to-be-mandatory Appendix D1 is more
fundamental. Appendix D2 specifies that the dryer automatically terminate based on its own controls
when placed in “normal” operational settings while Appendix D1 specifies that the dryer be manually
stopped by an operator at a specific remaining moisture content (RMC).
An overview of the main steps in the new Appendix D1 (manually stopped) test procedure is as follows:
• A load of cloth is dried to a “bone dry” state, in which it should weigh 8.45 lb +/-1%. Small articles
of clothing (such as washcloths) are specified for making fine adjustments to the weight.
• The load is wetted to 57.5% moisture content by weight.
• The load is placed in the dryer, with the dryer set to “timed dry” and the maximum temperature
setting.
• The dryer is allowed to run until the test operator manually stops it and weighs the cloth.
• The cloth should be in the range of 2.5–5.0% RMC, or else the test must be redone. The dryer is not
allowed to enter into a cooldown mode.
The main steps in the Appendix D2 test procedure are very similar, with the exception that the dryer is
placed into an automatic (moisture-sensing) mode and allowed to run through its full cycle including
cooldown. The operator does not interrupt the cycle at any point and weighs the load at the end to
determine the final RMC. If this final RMC is above 2.0%, the test must be run again set to the highest
dryness setting available.
A summary of the key differences between the various DOE test procedures is given in Table 1. The work
presented in this report involved some minor deviations from the DOE test procedures so that the data
would be more useful for achieving the objectives of this study. Section 1.4.1 discusses all deviations in
detail.
2Table 1. Summary of key test procedure differences among Appendixes D, D1, and D2
Appendix D1
Appendix D2
Appendix D (mandatory
(currently informational)
January 1, 2015)
Starting moisture content 70+/-3.5% 57.5+/-3.5%a 57.5+/-0.33%
Final remaining moisture
2.5–5.0%1.3 OBJECTIVES ORNL’s objectives in this investigation were to determine the baseline performance of several dryers, determine the test-to-test performance variability, characterize the existing automatic termination controls, and investigate strategies to improve performance under automatic termination. The performance metrics included EF, RMC, and duration of the drying cycle. Baseline performance and variability in performance were evaluated for five unmodified dryer models (two standard size electric, two compact size electric, and one standard size gas) under two test procedures (D1 and D2), with three test loads (DOE, Association of Home Appliance Manufacturers [AHAM] 1992, and AHAM 2009), and with two temperature settings (high and reduced). 1.4 METHODOLOGY AND METRICS 1.4.1 Approach to Test Procedures 1.4.1.1 Appendix D2 Tests Tests conducted in this work under Appendix D2 followed the test procedure exactly as written with two deliberate exceptions: 1. The on-cycle EF was used as the measure of energy efficiency instead of the on- and off-cycle CEF. This decision was made so that the data would be more useful for distinguishing the effects of alternate strategies for improving on-cycle performance, such as automatic termination vs. timed drying and improved sensing and controls for automatic termination. Under the assumption that inactive power consumption is unrelated to active cycle performance, including inactive power consumption in all cases would only have served to obfuscate relative differences in the effects of the variables of interest. Note that if off-cycle energy consumption were factored in, the resulting CEFs would be lower compared with the EF used here by as little as
ΔRMCactual/ΔRMCideal, where ΔRMCactual is the actual difference in RMC between the beginning and the
end of the test and ΔRMCideal is defined as 53.5%. This corrects for variation in final RMC, which, in D1
tests, is test operator dependent (not dryer dependent). Except where noted and explained in Sect. 6.3,
compensation for final RMC and the field use correction factor were both incorporated into the values of
EF reported for D1 tests in this work, in accordance with Appendix D1.

Further, for the D1 tests, the D2 tolerance of +/-0.33% on starting moisture content (SMC) was used
instead of the D1 tolerance of +/-3.5%. This decision was made to aid in comparisons between D1 and D2
data sets.

1.4.1.3    Test Load Types

The CFR stipulates the use of a specific test load (herein referred to as “DOE load”). Two additional
loads were obtained and used in this work: the load specified in the 1992 AHAM test procedure HLD-1-
1992 (herein referred to as “AHAM 1992 load”) and the load specified in the 2009 AHAM test procedure
HLD-1-2009 (herein referred to as “AHAM 2009 load”). Together the AHAM 1992 and AHAM 2009
loads are sometimes referred to in this report as the “AHAM loads.”

The full specifications of the “parent” AHAM standards were used in relation to the procurement,
preparation, and maintenance of the AHAM test loads (including preconditioning, maintenance of
required age profiles, etc.). However, with regard to methods of test, the DOE test procedures
(Appendixes D1 and D2) were used exclusively (with the deviations noted in the preceding paragraphs).
That is, the DOE test procedures were used on both the DOE loads and the AHAM loads.

1.4.2     Measurement of BDW, RMCbulk, and RMCi

Measurements of the bone dry weight (BDW), SMC, RMCbulk, and RMCi were carried out using a manual
weighing process on a benchtop scale (a Mettler Toledo PM30000-K was used for most tests; a Mettler
Toledo SB32000 was used for some tests).

The method used to measure BDW was as written in the CFR procedure. The clothes were brought to a
bone dry state by drying on timed dry and the highest temperature setting until successive 10 minute
intervals of drying did not change the total load weight by greater than 1%.

The method used to measure RMCbulk was also as written in the CFR procedure. At the end of a test, the
entire load was weighed together on a scale.

The method used to measure RMCi was as follows: after measuring the bulk BDW, each cloth was
weighed individually and its BDWi recorded. BDWbulk was then measured again. Then, at the end of a
test, after the final bulk weight was recorded, each cloth was weighed individually, and the bulk weight
was taken again. Each cloth was marked with a unique identifier to enable this.

1.4.3     Real-Time RMCbulk Measurements

In addition to the manually weighed bulk and individual RMCs, the whole dryer under test was placed on
a 4 × 4 ft platform scale with high resolution and accuracy (Mettler Toledo Vertex 2158 floor scale with
IND 780 terminal). This would not be necessary for standard tests, but was done to provide additional
insights for this work. As a test load dries, the weight of the whole dryer drops (by about 4.7 lb over a full
drying cycle). This is only a few percent of the total weight of the whole dryer, and therefore the scale can
only determine real-time RMCbulk during the drying cycle with modest accuracy–especially considering

                                                      5
the nonstatic nature of the dryer while in operation and the necessity for power and instrumentation cables
to extend between the suspended dryer and other nonsuspended objects.
The as-realized accuracy for real-time RMCbulk was about +/-2% RMC for electric models. It was
significantly better (+/-0.5%) for the gas dryer, which had a much less substantial electrical power cable
attached (carrying 2-3 A at 120 VAC, compared to up to nearly 30 A at 240 VAC for the electric models).
The RMCbulk measured at the end of a test was much more accurate than the real-time value, and
exceeded the accuracy required by the test procedure.
1.5 DRYER SETTINGS
Terminology to describe cycle settings differs among manufacturers. To make meaningful comparisons,
the generic terminology described in Table 3 is used in this report.
Table 3. Generic terminology used in this report to describe dryer settings
Generic Example equivalent terms used by
terminology used manufacturers
in this report
Temperature High High, Normal, Cottons
Reduced Medium, Gentle, Easy Care, Permanent Press
Dryness Normal Normal, Optimum Dry, Cottons
Extra dry (highest dryness setting provided, according to
Appendix D2)
Termination D2 or automatic Normal cycle, Cottons cycle
type
D1 or timed dry Terminated manually by operator. The dryer
was placed in Time Dry, Timed Dry, or XX
Minutes mode, and was not allowed to enter
cooldown before being manually terminated.
N/A – not Time Dry (with cooldown), Timed Dry (with
investigated cooldown), XX Minutes (with cooldown)
62. TEST VALIDITY
Tests in this work were conducted according to the conditions specified in 10 CFR 430, Subpart B,
Appendix D2. This test procedure specifies the conditions given in Table 4. As previously explained, the
D1 tests were conducted using the SMC value of 57.5% but with the D2 tolerance of +/-0.33%. All of the
other test conditions in Table 4 are identical in Appendixes D1 and D2 and hence for the D1 and D2 data
reported here. In addition, the uncertainty specifications of instrumentation used in this work are shown in
Table 5.
The tests conducted were generally well within the requirements. For all tests declared valid, supporting
information is shown in Fig. 1 through Fig. 4.
In Fig. 1, the line-to-line voltage (240 VAC) for each test was well within the required range of +/-1%.
One dryer model (in tests 31 to 37 on EC2) tended to draw much more current from one power phase than
the other, leading to one leg’s voltage being a little high and the other being a little low. The line-to-line
voltage stayed well within the required range (and the line-to-neutral voltages deviated only slightly
beyond +/-1%). Note that tests 45–51 were on the gas dryer (GS1), which uses single-phase 120 VAC.
Table 4. Equipment and test conditions met or exceeded in this work as required by Appendix D2
Supporting
D2 Specification Specification met or exceeded with
data
Voltage at dryer 240 VAC +/- 1% Split-phase, electronically actuated, motorized Fig. 1
terminal block variac (two-ganged on single shaft) with closed-
loop control; typical response time 2 seconds
Dryer exhaust AHAM exhaust Sheet metal restrictor constructed according to N/A
restriction simulator described in AHAM specifications
Sect. 3.3.5.1 of AHAM-
HLD-1-2009
Temperature of test 75 +/- 3°F Environmental chamber (+/- 1°F achieved for most Fig. 2
room tests)
Relative humidity of 50 +/- 10% Environmental chamber (+/- 2% achieved for most Fig. 2
test room tests)
Starting moisture 57.5 +/- 0.33% Standard washing machine and supplemental spin Fig. 3
content of test load extractors; Mettler Toledo PM30000-K or Mettler
Toledo SB32000
Bone-dry weight of test 8.45 +/- 0.085 lb Mettler Toledo PM30000-K or Mettler Toledo Fig. 4
load SB32000
7Table 5. Instrumentation used in this work
Measurement Instrument Accuracy
Temperatures T-type thermocouples +/-1°F
Relative humidity of room Vaisala HMD60Y +/-2.0% RH at testing conditions
Relative humidity of dryer Vaisala HMT337 for high humidity, +/-2.7% RH or better under all
exhaust range 0-100% (warmed probe) conditions encountered
Weight of test loads and Mettler Toledo PM30000-K or +/-0.3 g linearity; 0.1 g resolution
individual cloths Mettler Toledo SB32000 +/-0.5 g linearity; 1 g resolution
Real time weight of whole dryer Mettler Toledo Vertex 2158 floor 0.01 lb (4.5 g) resolution
scale (1,000 lb capacity) with IND
780 terminal
Power consumption Ohio Semitronics GW5-004C (wired Power: 0.4% of measured value
for split-phase) with model 12974 typical under testing conditions.
current transducers Cumulative dryer cycle energy: 0.4%
typical.
Voltage transducer (240 VAC) Ohio Semitronics MVT-300A +/-0.75 VAC (0.31% measured value)
Voltage transducers (120 VAC) Ohio Semitronics MVT-150A +/-0.38 VAC (0.31% measured value)
Natural gas flow rate Elster American AC-250, temperatureFig. 1. Average and standard deviation (error bars) split-phase voltages at dryer
terminal blocks during each test.
Fig. 2. Average and standard deviation (error bars) of environmental
chamber temperature and relative humidity during each test.
9Fig. 3. Starting moisture content for each test.
Fig. 4. Bone dry weight for each test.
103. EFFECT OF INVESTIGATED VARIABLES ON BASELINE DRYER PERFORMANCE
A test matrix was devised to effectively evaluate the performance of off-the-shelf dryers under various
conditions, as shown in Table 6, and with key results shown in Table 7.
Table 6. Test matrix for baseline testing designed to allow independent evaluation of the
effects of four variables of interest
Setting - Setting - Setting -
Test number Dryer TP Load program temp dryness
1,2,3 ES1 D2 2009 AHAM normal high normal
4 ES1 D2 2009 AHAM normal reduced normal
5,6,7 ES1 D2 1992 AHAM normal high normal
8 ES1 D2 1992 AHAM normal reduced normal
9,10,11 ES1 D2 DOE normal high normal
12 ES1 D2 DOE normal reduced normal
13,14,15 ES1 D1 DOE time dry high N/A
16,17,18,16e,17e,18e EC1 D2 2009 AHAM normal high nm, ex
19 EC1 D2 2009 AHAM normal reduced normal
20,21,22,20e,21e,22e EC1 D2 1992 AHAM normal high nm, ex
23 EC1 D2 1992 AHAM normal reduced normal
24,25,26 EC1 D2 DOE normal high normal
27 EC1 D2 DOE normal reduced normal
28,29,30 EC1 D1 DOE time dry high N/A
31, 31e EC2 D2 2009 AHAM normal no options nm, ex
32, 32e EC2 D2 1992 AHAM normal no options nm, ex
33 EC2 D2 DOE normal no options normal
34 EC2 D2 2009 AHAM normal reduced normal
35 EC2 D2 1992 AHAM normal reduced normal
36 EC2 D2 DOE normal reduced normal
37 EC2 D1 DOE normal no options N/A
38 ES2 D2 2009 AHAM normal reduced normal
39 ES2 D2 1992 AHAM normal reduced normal
40 ES2 D2 DOE normal reduced normal
41 ES2 D2 2009 AHAM normal reduced normal
42 ES2 D2 1992 AHAM normal reduced normal
43 ES2 D1 DOE time dry reduced N/A
44 ES2 D1 DOE time dry high N/A
45 GS1 D2 2009 AHAM normal high normal
46 GS1 D2 1992 AHAM normal high normal
47 GS1 D2 DOE normal high normal
48 GS1 D2 2009 AHAM normal reduced normal
49 GS1 D2 1992 AHAM normal reduced normal
50 GS1 D2 DOE normal reduced normal
51 GS1 D1 DOE time dry high N/A
Note: Blue denotes where additional tests were added to the original test matrix to accommodate the
dryer’s RMC performance. Green indicates a modification to accommodate the dryer’s available
settings. Purple indicates that a test’s purpose was modified compared to the original test matrix. Gray
indicates where tests were eliminated due to lack of available settings.
11Table 7. Key results of baseline test matrix
Duration [min] RMCbulk [%] RMCi,max EF [lbsBDW/kWh]
Dryer Temp Dryness Test matrix # SD SD SD SD SD SD
model TP Load setting setting designation tests AVG (abs) (rel) AVG (abs) (rel) [%] AVG (abs) (rel)
ES1 D2 2009 High Normal 1,2,3 3 42.97 1.50 3.5% 1.7% 0.1% (NA) - 3.18 0.08 2.5%
ES1 D2 2009 High Normal 01R 1 40.17 - - 1.7% - - 3.1% 3.03 - -
ES1 D2 2009 Red. Normal 4 1 39.48 - - 2.5% - - - 3.31 - -
ES1 D2 1992 High Normal 5,6,7 3 42.19 1.25 3.0% 3.8% 1.0% (NA) - 3.52 0.12 3.4%
ES1 D2 1992 High Normal 05R 1 40.19 - - 2.9% - - 7.8% 3.12 - -
ES1 D2 1992 Red. Normal 8 1 37.22 - - 8.6% - - - 4.01 - -
ES1 D2 DOE High Normal 9,10,11 4 48.99 1.92 3.9% 0.8% 0.1% (NA) - 3.19 0.02 0.6%
ES1 D2 DOE High Normal 09R 1 44.78 - - 1.1% - - 1.9% 2.98 - -
ES1 D2 DOE Red. Normal 12 1 46.46 - - 0.9% - - - 3.28 - -
ES1 D1 DOE High (timed) 13,14,15 3 28.63 0.57 2.0% 3.7% 0.5% (NA) - 3.92 0.04 1.1%
ES1 D1 DOE High (timed) 13R 1 22.84 - - 3.5% - - 9.6% 3.7 7 - -
EC1 D2 2009 High Normal 16,17,18 4 25.75 1.26 4.9% 3.3% 1.9% (NA) - 3.42 0.19 5.6%
EC1 D2 2009 High Ex. dry 16e,17e,18e 3 32.97 1.41 4.3% 1.0% 0.3% (NA) - 2.82 0.09 3.2%
EC1 D2 2009 Red. Normal 19 1 26.00 - - 3.4% - - - 3.41 - -
EC1 D2 1992 High Normal 20,21,22 5 26.20 2.17 8.3% 6.3% 2.1% (NA) - 3.52 0.27 7.7%
EC1 D2 1992 High Ex. dry 20e,21e,22e 4 35.42 4.48 13% 2.1% 1.0% (NA) - 2.79 0.27 9.6%
EC1 D2 1992 Red. Normal 23 1 26.00 - - 7.0% - - - 3.62 - -
EC1 D2 DOE High Normal 24,25,26 3 25.34 0.57 2.3% 1.1% 0.2% (NA) - 3.51 0.11 3.2%
EC1 D2 DOE Red. Normal 27 1 25.00 - - 1.2% - - - 3.57 - -
EC1 D1 DOE High (timed) 28,29,30 3 18.62 0.53 2.9% 4.2% 0.8% (NA) - 3.76 0.08 2.0%
EC2 D2 2009 High Normal 31 1 48.00 - - 2.2% - - - 2.65 - -
EC2 D2 2009 High Ex. dry 31e 1 57.46 - - 1.0% - - - 2.21 - -
EC2 D2 1992 High Normal 32 1 45.31 - - 3.6% - - - 2.94 - -
EC2 D2 1992 High Ex. dry 32e 1 53.97 - - 1.4% - - - 2.41 - -
EC2 D2 DOE High Normal 33 1 42.54 - - 1.2% - - - 3.14 - -
EC2 D1 DOE High (timed) 37 1 26.52 - - 4.4% - - - 3.73 - -
ES2 D2 2009 Red. Normal 38 1 43.88 - - 0.8% - - - 2.96 - -
ES2 D2 1992 Red. Normal 39 1 39.02 - - 1.6% - - - 3.15 - -
ES2 D2 DOE Red. Normal 40 1 39.40 - - 0.1% - - - 3.19 - -
ES2 D1 DOE Red. (timed) 43 1 23.33 - - 4.4% - - - 3.71 - -
ES2 D1 DOE High (timed) 44 1 22.90 - - 4.4% - - - 3.78 - -
GS1 D2 2009 High Normal 45 1 50.64 - - 1.6% - - - 2.64 - -
GS1 D2 1992 High Normal 46 1 46.27 - - 3.8% - - - 2.88 - -
GS1 D2 DOE High Normal 47 1 48.35 - - 1.0% - - - 2.93 - -
GS1 D2 2009 Red. Normal 48 1 49.45 - - 2.0% - - - 2.89 - -
GS1 D2 1992 Red. Normal 49 1 46.31 - - 2.3% - - - 3.13 - -
GS1 D2 DOE Red. Normal 50 1 42.06 - - 0.8% - - - 3.14 - -
GS1 D1 DOE High (timed) 51 1 22.28 - - 3.4% - - - 3.74 - -
Note: Orange indicates an invalid RMC for D2 tests (>2.0%) with a high temperature setting, non-DOE load, and normal dryness
(underlined if set to extra dry). Blue indicates an invalid RMC for D2 tests with a reduced temperature setting. Tests designated
with a name ending in “R” were repeated to measure RMCi. Tests designated with a name ending in “e” were repeated on “extra
dry,” according to D2 for EC1 and EC2
The dryer models included two electric standard units (ES1 and ES2), two electric compact units (EC1
and EC2), and a gas standard unit (GS1). The baseline test matrix in Table 6 was designed to allow for
numerous comparisons to show the effects of (1) test load type, (2) test procedure—timed dry (D1) or
automatic termination (D2), (3) temperature setting, and (4) dryer model. Dryness setting was set at
normal (or default) for all automatic termination (D2) tests. A subset of these tests was also used to
establish the test-to-test variability in performance results. Key results are shown in Table 7. The
following sections show graphical representations and discussion of the results shown in Table 7.
123.1 EFFECT OF TEST PROCEDURE (D2 VS. D1)
To show the effect of test procedure, Fig. 5 shows EF, RMC, and duration for all tests conducted under
normal dryness and high temperature settings with DOE cloth. In other words, it compares test results
under D1 (timed dry) with test results under D2 (automatic termination), with as many other variables as
possible held constant to show the effect of the test procedure.
Fig. 5. Effect of test procedure (D2 vs. D1) on EF, RMC, and duration for each model (for tests with
DOE load and high temperature1). Blue boxes show target RMCs for each test procedure. Green dotted lines
show the minimum CEF standards effective in 2015 with D1 test procedure.
Compared with tests under D1, each dryer’s EF dropped by 7 to 22% under D2. The drop in EF under
automatic termination is only partly the result of the lower RMC requirement of Appendix D2. This
1
The ES2 and EC2 units did not allow selection of temperature under automatic termination. Thus they are at the
default temperature setting in this figure.
13observation is based on the range in EF reduction being 7 to 22%, whereas the range in additional
moisture removed was only 2.9 to 3.2%.
As the clothes get drier, the exhaust humidity decreases, the exhaust temperature rises, and apparently
more energy is required for each additional percent reduction in RMC. Knowing this, one would expect
the decrease in EF to be greater than the increase in moisture removal when slightly lowering the final
RMC. However, it is instructive to examine recorded D1 tests in which the test operator “overshot” the
target of 2.5–5.0%. For example, one D1 test on the GS1 dryer resulted in a final RMC of 0.1% (for this
reason alone it was not a valid test under D1). The “EF” calculated without applying the field use
correction factor or the final RMC compensation for this D1 test was 3.29, which is 11% higher than the
D2 test result of 2.93 (which similarly does not have final RMC compensation or field use correction
applied), even with a D1 final RMC 1.2% lower than the D2 test. From this it can be concluded that a
significant amount of the additional energy consumption under D2 is from extended operation past the
target final RMC.
3.2 EFFECT OF LOAD TYPE
To show the impact of different test cloths under the D2 test procedure, Fig. 6 shows EF, RMC, and
duration for all tests conducted under normal dryness and high temperature settings using the D2 test
procedure. Note that ES2 and EC2 did not have different temperature settings available under automatic
termination and it would therefore be more precise to say they were run in their “default” temperature
setting.
14Fig. 6. Effect of test load on EF, RMC, and duration for each model (for tests with D2 test procedure,
high-temperature setting). Blue box shows allowable RMC for DOE cloth. Green dotted lines (for reference)
show minimum CEF standard effective 2015 for CEF evaluated under D1.
Evaluating the results for the D2 tests with the three different clothing loads, the following observations
can be made:
• The RMCbulk of each dryer’s clothing load decreased from AHAM 1992 to AHAM 2009 and
decreased again from AHAM 2009 to the DOE load.
• Among the three load types, each dryer’s D2 EF was lowest with the AHAM 2009 load. Depending
on the dryer, the EF may be highest with either the AHAM 1992 (also with high RMCbulk) or the DOE
load.
• In general each dryer’s cycle duration did not vary much across the three loads.
• Comparing dryer models to each other, relative EF and RMC performance with the DOE load was a
good predictor of relative performance with the other loads.
Many of the D2 tests in Fig. 6 with non-DOE loads resulted in final RMCs higher than 2.0%. According
to the D2 test procedure (which technically does not cover non-DOE loads), these tests would need to be
15rerun at the highest available dryness setting (generically referred to as extra dry). This was done for two dryer units (EC1 and EC2) for those D2 tests with non-DOE loads in which they did not reach
Fig. 8. Effect of dryness setting.

3.4   EFFECT OF TEMPERATURE SETTING

Nomenclature for temperature settings differs among manufacturers. In this report, the term “reduced”
refers generically to a temperature setting that is one level below the highest level provided (not including
extremes that may be provided by some manufacturers such as “antibacterial”). This reduced setting may
be called “Medium,” “Easy Care,” “Permanent Press,” or “Gentle.” Also, temperature settings may be
referred to by manufacturers as “temperature” or “heat.” The highest temperature level provided is
typically the default setting, and may be called “High” or “Normal.”

The effect of the temperature setting (under D2 automatic termination) on EF, RMC, and duration is
shown for three different loads and three dryer models in Fig. 9. Results for the EC2 model were not
included because there was no available reduced temperature setting. Results for the ES2 model were not
included because the “high” setting could not be selected under automatic termination. In this figure, line
thickness indicates load type and line color indicates dryer model.

                                                      17
The reduced temperature setting tends to slightly increase EF, slightly increase the final RMCbulk, and
counterintuitively slightly decrease the cycle duration. An explanation for the duration increase seems to
be related to a lower peak temperature of the cycle under the reduced setting. The energy used in the first
~30 minutes was similar for reduced and high temperature settings. Under the high temperature setting
the exhaust subsequently reached a higher peak temperature before the onset of cooldown, leading to
longer cycle duration under high temperature setting.
Fig. 9. Effect of temperature setting on EF, RMC, and duration for each model and load type for tests
with D2 test procedure.
For one dryer, the effect of a reduced temperature setting was also evaluated under the D1 test procedure,
as shown in Fig. 10. Reduced temperature had no significant effect on EF, RMCbulk or duration for D1
tests.
18Fig. 10. Effect of temperature setting under the D1 test procedure for ES2.
3.5 EFFECT OF DRYER MODEL
The significance of the effect of the dryer model is shown in Fig. 11, which details the EF, RMC, and
duration for each test load. All results in Fig. 11 are for D2 tests with normal dryness and high-
temperature settings.
19Fig. 11. Effects of dryer model on EF, RMC, and duration for each test load (for tests with D2 test
procedure and high or default temperature setting). Note that the 2015 CEF standards are applicable to the
DOE load.
Observations from Fig. 11 include the following:
• EF
o Only one dryer (EC1) had an EF exceeding the 2015 CEF requirement (relevant to D1), under the
D2 test procedure. This dryer also had an acceptable D2 RMCbulk (1.1%) with DOE cloth but had
a significantly higher RMCbulk for AHAM 2009 (3.3%) and AHAM 1992 (6.3%).
o EC2, ES2, and GS1 performed best with the DOE load and worst with the AHAM 2009.
o The EF achieved by EC1 was relatively insensitive to test load. This was in part because it had
the widest variation in RMCbulk among the five models.
o The ES1 dryer performed best with AHAM 1992, where it also had the shortest duration (with a
relatively high RMCbulk of 3.8%).
• RMC
o All dryers met theo All dryers had their respective lowest RMCbulk with the DOE load.
o All dryers had their respective highest RMCbulk with an AHAM 1992 load, with wide variation in
this RMCbulk, from less than 1.6 to 6.3%.
o The RMCbulk with AHAM 2009 ranged from 0.8 to 3.3%.
• Duration
o The EC1 had dramatically shorter duration than the standard models, while the EC2 had slightly
longer than average duration when compared with standard models.
o The EC1 barely changed its duration across different loads, resulting in wide variations in RMC.
As shown later, it had high test-to-test variability in EF and RMC in identical tests.
214. REPEATABILITY OF RESULTS
The results in this section are presented mainly as standard deviations (population type). Note that for a
conventional uncertainty with 95% confidence interval, two standard deviations are required. Standard
deviations were calculated based on results from multiple (at least three) identical tests. These tests were
conducted on two dryer models only (ES1 and EC1).
All test results that had repeats are shown in Fig. 12. They fall into ten test categories as defined by dryer
model, load, and dryness setting. Most have three repeats per category, two categories have four repeats,
and one has five repeats. All tests conducted for repeatability used the high temperature setting.
Fig. 12. Performance results for repeated tests.
Perhaps the most important repeatability result is the effect of the test procedure on EF repeatability as
shown in Fig. 13. For ES1, the repeatability under D2 was better (0.6% vs. 1.1%). For EC1, the
repeatability under D2 was worse (3.2% vs. 2.0%). Note that the number of identical tests from which
each standard deviation was calculated was three (except ES1 under D2, where the number was four).
Overall, the data here are inconclusive about whether repeatability of EF under D2 is higher or lower
than repeatability of EF under D1.
23Fig. 13. Effect of test procedure on repeatability of EF for two dryer models with DOE load.
Fig. 14 shows the standard deviations in EF, RMC, and duration. It includes tests under the D1 test
procedure with the DOE load and under the D2 test procedure with all load types. Note that RMC needs
to be shown as absolute standard deviation (with units of %RMC) for meaningful results. Each bar
represents the standard deviation for a set of identical tests (at least three identical tests in all cases and
four or five in some).
Clearly dryer model and/or dryer size has a large influence on the degree of variability in results. The
EC1 had consistently higher variability in EF and RMC with all load types, while having higher
variability in duration for DOE and AHAM 2009 loads but lower variability with AHAM 1992 load.
Fig. 14. Standard deviations of EF, duration, and RMCbulk under various test procedures and loads.
When comparing D1 to D2, it is important to note that variability in duration and RMC are operator-
dependent in D1 testing (the operator is allowed to stop the dryer with an RMC anywhere between 2.5
and 5.0%). It is important to note that the EF is much less operator dependent than RMC or duration,
since D1 uses final RMC compensation in the calculation of EF.
Comparing the D2 tests to each other, the DOE cloth usually resulted in the lowest variability for EF,
duration, and RMC for both dryer models. The single exception was variability of duration with ES1,
which was similar among all three loads, but worst with the DOE load. For EC1, all performance metrics
had the lowest standard deviation with the DOE load.
24RMC variability under D2 test procedure with the DOE load was very low, with standard deviations of 0.1% for ES1 and 0.2% for EC1. The AHAM loads generally had considerably higher variability and may or may not be below 2.0% final RMCbulk, depending on the test run. For example with the EC1 dryer, three tests out of four with AHAM 2009 had RMC higher than 2.0%. An additional set of tests was run on “extra dry” (according to the D2 test procedure). All repeats on “extra dry” were below 2.0%. The AHAM 1992 load had the highest RMC variability, was as low as 4% and as high as >9% with normal dryness with the EC1. On “extra dry” with EC1, two repeats were
5.    INDIVIDUAL RMC

5.1   INDIVIDUAL RMC OF BASELINE TESTS

In this work, a new term, “individual RMC” (RMCi), was defined and measured. This metric is the RMC
of a single item of cloth (for example a single towel or shirt) out of a test load that might be comprised of
16–39 individual items. While not directly related to D1 or D2 test procedures, the author believes that
insights from RMCi data might provide clues for how to design more energy efficient dryers.

Another metric, the “excess RMCi score”, was also defined in order to help interpretation of results within
this report and is explained later in this section.

Acquiring the individual RMC data requires that each item (39 pieces in the case of an 8.45 lb DOE load)
be weighed at the BDW stage and again at the end of the test. In this work, bulk weights were taken two
extra times as well: the bulk BDW was taken before and after individual BDWs were taken, and the bulk
final weight was taken before and after the individual final weights were taken. This was done to verify
that the bulk weight did not undergo a significant change during the time it took to measure each item
individually. The additional technician time required to take these 78 individual weights plus two
additional bulk weights was approximately 20 minutes per test (roughly 10 minutes at the bone dry stage
and 10 minutes more after the end of the dry cycle).

In baseline testing, individual RMC was not recorded. After completion of baseline testing, four tests
were rerun (referring to test matrix designations 1, 5, 9, and 13 in Table 6) to characterize the baseline
distribution of RMCi under D1 and D2 testing (high-temperature setting) for one dryer model (ES1).

The types of cloth found in each test load are summarized (along with their shorthand aliases) in Table 8.
Also see Table A.1 in the Appendix for additional information about each test load.

                                    Table 8. Items found in each test load

                                               Test load item       Item
                                   Test load
                                               description          alias
                                   DOE         towels               TW
                                               washcloths           ST
                                   AHAM        sheets               SH
                                   1992        table cloths         TC
                                               bath towels          TW
                                               long sleeve shirts   SR
                                               T-shirts             TS
                                               pillowcases          PC
                                               boxer shorts         BX
                                               wash cloths          WC
                                               handkerchiefs        HC
                                   AHAM        sheets               SH
                                   2009        pillowcases          PC
                                               towels               TW

To characterize the RMCi distribution for baseline tests, the test matrix and key results shown in Table 9
and plotted in Fig. 16 were obtained. This included four repeats of tests from the baseline test matrix (as
was shown in Table 6), plus two tests with double-size (16.9 lb) loads. One of these (test XL1) contained

                                                     27
an 8.45 lb 1992 AHAM load plus an 8.45 lb 2009 AHAM load, and the other (test XL2) consisted of two
8.45 lb DOE loads.
Table 9. Test matrix and key results for characterizing RMCi tests
Dur- Excess
Test Temp. Dryness ation RMCi
name Dryer TP Load setting setting EF [min] RMCbulk RMCi,max score
1R ES1 D2 2009 AHAM high normal 3.03 40.2 1.7% 3.1% 0
5R ES1 D2 1992 AHAM high normal 3.52 40.2 2.9% 7.8% 7.3
9R ES1 D2 DOE high normal 2.98 44.8 1.1% 1.9% 0
13R ES1 D1 DOE high (timed) 3.77 22.8 3.5% 9.6% 16
XL1 ES1 D2 1992+2009 high normal 3.94 54.3 5.8% 23% 26
XL2 ES1 D2 DOE+DOE high normal 3.51 63.8 0.4% 1.0% 0
Fig. 16. Results of RMCbulk, RMCi, and excess RMCi
score for baseline and extra-large load tests.
Figures 17–19 show the distribution of individual RMCs measured for all three load types under D2
automatic termination. Fig. 20 shows the distribution of RMCi for the DOE load under the timed dry D1
test procedure. Note that the average weight of each item type is shown in the legend of each figure (e.g.,
TW 99 g means the towels in that load had an average BDW of 99 g). Due to slight variations in BDW,
the weight for an item type (e.g., TW or ST) may change slightly from one test to another. In addition,
note that the individual RMC procedure was independent of the RMCbulk; that is, the RMCbulk was still
determined in the conventional way by weighing the entire load together.
28You can also read