Residential Satisfaction in Ireland: Comparison of Housing and Neighbourhood Satisfaction Levels by Housing Tenure - Working Paper prepared for ...
←
→
Page content transcription
If your browser does not render page correctly, please read the page content below

Residential Satisfaction in Ireland: Comparison of
 Housing and Neighbourhood Satisfaction Levels
                by Housing Tenure
Working Paper prepared for the 2019 European
Network of Housing Researchers’ Annual
Conference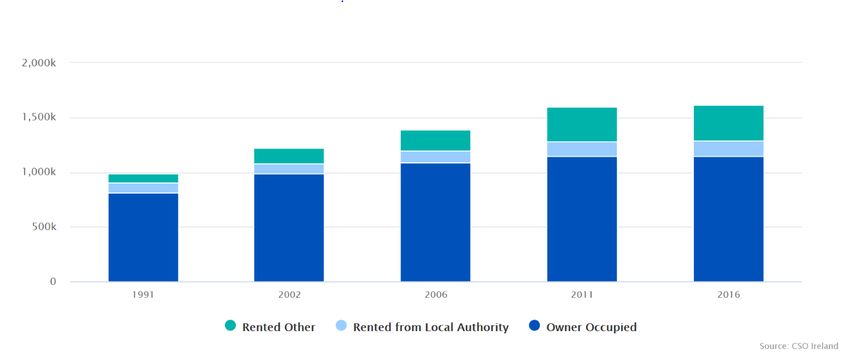
Prepared for ENHR Conference 2019 -Workshop 22

 Residential Satisfaction in Ireland: Comparison of
 Housing and Neighbourhood Satisfaction Levels by
                  Housing Tenure
                                        WORKING PAPER

                                                 Roslyn Molloy

       Housing Agency, Research, 53 Mount Street Upper, Dublin 2, DO2 KT73, Ireland

                               e-mail: roslyn.molloy@housingagency.ie

                                                 Anne Murphy

                                        e-mail: amurph33@tcd.ie

ABSTRACT:

This paper presents the results from a national study examining levels of residential satisfaction
among a sample of over 1,300 householders. Housing and neighbourhood satisfaction levels and
affordability issues are examined by tenure.

While levels of residential satisfaction for all tenure groups (measured by housing and
neighbourhood) were high, statistically significant differences emerged between tenure groups.
Tenure groups examined were owners (with and without a mortgage) and private renters (private and
social renters).

The top three housing issues causing the most problem to householders were a shortage of space,
followed by difficulties keeping the house warm and difficulties with the cost of upkeep. The only
factor that scored higher for owners than renters as a problem was the home ‘being too big for current
needs’.

In terms of neighbourhood satisfaction, high levels of satisfaction were reported. Owners were more
likely than renters to report that their area was changing for the better and more likely to say they
would like to stay in their area long-term. Both groups reported high levels of agreement with
statements that their neighbourhoods would be a good place to raise children and that they would
recommend their neighbourhood as a place to raise children.

The majority of homeowners were not experiencing difficulties making monthly repayments, whereas
the majority of renters were experiencing difficulties meeting their rental costs.

Keywords: Residential Satisfaction, Housing Satisfaction, Neighbourhood Satisfaction, Affordability,
Housing Tenure

——
2
Prepared for ENHR Conference 2019 -Workshop 22
1 Overview of Research Study
The Housing Agency was set up in May 2010 with a vision to enable everyone to live in good quality,
affordable homes in sustainable communities; one of the ways of making a difference is through the
Agency’s objective to be a knowledge centre for housing policy and practice. An understanding of Irish
people’s housing situation is crucial to help develop sustainable communities and lead to an
improvement in living conditions. In 2017, the Housing Agency commissioned a study into housing
experiences, attitudes and aspirations.
This study has two broad research questions; the first is to investigate the current levels of residential
satisfaction in Ireland; the second question relates to Irish householders’ aspirations for their future
housing needs. The study aims to provide descriptive data on housing in Ireland, which will be used to
inform current housing policy and provide information to help develop policies into the future. The
research objectives are to:
• Provide data on trends in residential satisfaction over time.
• Provide data on residential aspirations among Irish householders.
• Provide information including but not limited to housing costs, affordability, housing quality,
barriers to different tenures, location and residential features.
• Provide information which will input to national and regional housing policy.
• Track expectations/aspirations, aspirations by age groups over time and shifts in population
needs.
• Collect information to help with assessing future housing requirements.
This study is a mixed mode (qualitative and quantitative) cross-sectional design, which is carried out at
regular intervals and consists to date of:
• Two exploratory focus groups held in 2018 to explore themes of residential satisfaction and
housing aspirations.
• A nationally representative sample survey of 1,173 householders aged 18 plus, with a booster
sample of 200 householders living in the rented sector. Data for this survey was collected in
2018.
• A further qualitative element in 2018 was included with four focus groups held to discuss in
more detail two of the key themes emerging from the nationally representative survey, which
were affordability and the experiences of those who had moved home in the previous three
years.
• A nationally representative sample survey of 504 apartment dwellers aged 18 plus, data for this
survey is currently being collected (Summer 2019).
• Focus groups of apartment dwellers will be held in Autumn 2019.
——
3Prepared for ENHR Conference 2019 -Workshop 22 To date the Housing Agency has published three reports with results from this study. These reports can be found in publications on the Housing Agency website: www.housingagency.ie. This paper provides some results from the 2018 quantitative nationally representative sample survey. It looks at residential satisfaction and housing affordability by tenure. Tenure was analysed by homeowners (with and without a mortgage) and renters (private and social sectors). —— 4
Prepared for ENHR Conference 2019 -Workshop 22

2 Background
According to the latest Census carried out in Ireland in 2016, homeownership represents
67.6% of households (1,147,552), while the rest of households rent, either in the private
rented sector or in the social sector. However, while homeownership is still the majority
tenure, renting continues to grow, as can be seen in Figure 1. In 2016 almost half a million
(497,111) households rented, an increase of 4.7% since 2011. Homeownership rates have
fallen from a high of 80% of households in 1991. Within the rented sector the percentage
increase was highest in the social sector, with an 11% increase over this period, compared
to a 2% increase in the private rented sector (CSO, Census 2016).

Figure 1: Ireland’s Tenure Status 1991 to 2016

Public subsidies and regulation have played a role in the rise and fall of rates of
homeownership (Norris, 2013). While Ireland for many years viewed itself as a nation of
homeowners, this is no longer the case; Ireland has almost exactly the same
homeownership rate as the average homeownership rate of the European Union -28
countries, which stood at 69.3% in 2017, as can be seen in Table 1.
Table 1: Distribution of population by homeownership rate-EU Silc

 Homeownership 2017                               %
 European Union - 28 countries                    69.3
 Switzerland                                      41.3
 Germany (until 1990 former territory of the
 FRG)                                             51.4

——
5
Prepared for ENHR Conference 2019 -Workshop 22

 Homeownership 2017                              %
 Austria                                         55.0
 Turkey                                          59.1
 Denmark                                         62.2
 France                                          64.4
 United Kingdom                                  65.0
 Sweden                                          65.2
 Netherlands                                     69.4
 Ireland                                         69.5
 Cyprus                                          70.7
 Finland                                         71.4
 Italy                                           72.4
 Belgium                                         72.7
 Greece                                          73.3
 Luxembourg                                      74.7
 Portugal                                        74.7
 Slovenia                                        75.6
 Spain                                           77.1
 Czechia                                         78.5
 Malta                                           81.3
 Latvia                                          81.5
 Norway                                          81.5
 Estonia                                         81.8
 Serbia                                          82.0
 Bulgaria                                        82.9
 Poland                                          84.2
 Hungary                                         85.2
 North Macedonia                                 88.7
 Lithuania                                       89.7
 Slovakia                                        90.1
 Croatia                                         90.5
 Romania                                         96.8
Source : Eurostat July 2019

——
6
Prepared for ENHR Conference 2019 -Workshop 22

3 Review of the Literature

3.1Residential satisfaction

Residential satisfaction is a complex theory drawing on satisfaction with housing, the
neighbourhood and life in general. Sam et al. (2012) believe there is no concrete or unique
definition of residential satisfaction, while the OECD (2013) state that “residential satisfaction
is a broad concept and is associated with multidimensional aspects including physical,
social, and neighbourhood factors, as well as psychological and socio-demographic
characteristics of the residents”. Diaz-Serrano (2006) drawing on Galster (1987), theorised
residential satisfaction as the gap between the actual and desired housing situation of an
individual. It can be argued that a positive residential satisfaction indicates an absence of
complaints and a high degree of alignment between actual and desired housing situations
(Lu 1999).

3.1.1      MEASURING RESIDENTIAL SATISFACTION

When designing a research survey to examine residential satisfaction, it is necessary to
clearly define the parameters and unit(s) of measurement. Dwelling satisfaction and
neighbourhood satisfaction are different concepts, but closely related. For example, an
evaluation of a person’s house is likely to include the immediate surrounding and neighbours
(Lu 1999). Each concept can be measured separately, and also within an overall
measurement of residential satisfaction.

Some studies use a single-item measure of residential satisfaction, such measures include,
for example: “Is this neighbourhood, better, worse or the same as your last neighbourhood?”
or “How satisfied are you with your current residential situation?” and respondents rate these
measures on a single-item 5-point Likert-type scale. Other single-item measurements of
satisfaction with a neighbourhood can allow for an exploration of the more subtle nuanced
drivers of decision making: for example, “how you would rate this neighbourhood as a place
to raise children” (Grinstein-Weiss et al. 2011).

A measurement of residential satisfaction can also be constructed through several
questions. Adriaanse (2007) asked several questions relating to ‘internal neighbourhood

——
7
Prepared for ENHR Conference 2019 -Workshop 22

reputation’, ‘social climate’ and ‘dwelling satisfaction’, with respondents again answering on
a single-item 5-point Likert-type scale. These questions were used to construct a measure of
residential satisfaction. Amerigo and Aragones (1997) provided a systematic model which
illustrates the range of factors that feed into residential satisfaction as well as the relationship
between residential satisfaction and housing intentions/ behaviours.

3.1.2 TENURE PREDICTING RESIDENTIAL SATISFACTION

Home ownership is a key factor found to determine residential satisfaction, with home
owners more likely to be satisfied than renters. Home ownership is also theorised to result in
more positive outcomes for the neighbourhood, as owners are economically motivated to
protect the value of their home by being good neighbours. Further, length of tenure is a
factor that influences residential satisfaction: living in a neighbourhood long-term, positively
influenced residential satisfaction (Grinstein-Weiss 2011).

Research over many decades consistently finds that owners have higher residential
satisfaction than that of similarly situated tenants (Rohe and Stegman, 1994; Elsinga and
Hoekstra, 2005). Elsinga and Hoekstra (2005) assert that homeownership ensures basic
security, freedom, self-esteem and financial advantage, which in turn leads to higher overall
residential satisfaction. They found in a European survey that in seven out of eight countries
homeowners were more satisfied than tenants with their housing situation. However, they
note that in countries where government policy supports a stable affordable housing sector
and there is a well-developed cost-rental sector with security of tenure for tenants, a rental
dwelling is a satisfying alternative to home ownership, with Vienna as the most established
and developed example (Elsinga and Hoekstra, 2005). Bounds (2009) notes that what
differentiates owning from renting is the level of sovereignty the resident has over their
domain, rather than any intrinsic satisfaction in dwelling type. Elsinga and Hoekstra (2005)
assert that the low proportion of owner-occupied properties in Switzerland, Austria and
Germany is a consequence of tenancy protection laws which enable tenants to experience a
sense of tenure security on a par with home owners.

Ireland has traditionally seen itself as a ‘homeowning’ society where government policy has
been to encourage homeownership, rather than a ‘cost-rental’ society such as Austria,
Germany or Switzerland (Winston, 2004; Elsinga and Hoekstra, 2005). As in other western
countries, homeownership is nearly completely aligned with housing type, with houses being
the most frequently-owned type (Glaeser and Shapiro, 2003 in James et al., 2009; Elsinga
and Hoekstra, 2005; CSO, 2016).

——
8
Prepared for ENHR Conference 2019 -Workshop 22

In Ireland, people have clear tenure and dwelling aspirations, preferring to own their homes
in lower density suburbs rather than remain as renters in city centre apartments (Howley,
2009; Winston 2004; Corrigan, Cotter and Hussey, 2019) and viewing it as a lifetime
purchase that provides social stability in which to raise a family (Biddlecombe, 2001;
Corrigan et al. 2019). A study of the housing aspirations of tenants in Ireland found that
homeownership was the tenure goal for most respondents, the vast majority (84.5%) of
respondents indicating that they intended to buy a house, with many willing to pay a
premium over the cost of renting to be achieve this goal and an even greater majority (92%)
intending to fund the purchase with a mortgage (Corrigan et al., 2019). The same study
found that even those who anticipated renting into the long term had a preference for
ownership even if they could not envisage that they would ever be able to afford it. This is a
historically long-established attitude which holds true for westernised societies and is not
unique to Ireland.

3.1.3 RESIDENTIAL SATISFACTION RESULTS FROM THE 2018 HOUSING
AGENCY FOCUS GROUPS

In 2018, as part of this Research Study, the Housing Agency commissioned two exploratory
focus groups to understand Irish attitudes and aspirations towards housing. One of the key
findings emerging from these focus group was that homeownership was found to strongly
influence satisfaction levels and a sense of well-being, and the view that where one lived
was a ‘home’. The group of homeowners in the focus group spoke about the sense of
security they felt owning their own home, they viewed the home as a sanctuary –
somewhere they could relax and ‘close the door to the outside world’ if they wanted to.
Owners spoke about the feelings of personal achievement and security that came with
owning their home. In contrast, renters for the most part viewed where they lived as a
‘house’ and not a ‘home’ and seemed to be far less connected to the community or
neighbourhood (Housing Agency, 2019).

Neighbourhoods and communities were seen as being created by people often sharing
similar interests, with the presence of children in a household often providing social
interaction between neighbours. For some, a neighbourhood means a community with
friends. Another participant said he felt a sense of belonging when he was asked by
neighbours to join them in the local pub and watch a sports match. However, renters and
homeowners saw a decline in the community element of neighbourhoods in Irish society.
Homeowners felt that one reason for this was the increasing number of rental properties in
an area reduced the ‘neighbourhood’ feel in those areas. This was further evidenced by the
renters who said they had little connection to the community they lived in.

——
9
Prepared for ENHR Conference 2019 -Workshop 22

There was a division between owners and renters in the discussion on neighbourhoods.
Homeowners were more likely to consider where they lived as a neighbourhood in the
context of it being a community of people and relationships. With homeowners the bond with
where they lived increased over time. While renters felt they were ‘passing through’ the area
they lived in currently. This meant they often were less inclined to create relationships with
their neighbours or engage in the community. An interesting insight given by one participant
was the idea that if one was going to buy a house one would knock on neighbours’ doors
before buying to introduce oneself and get a view of what the neighbours were like, whereas
if renting one would never do this.

3.2Housing affordability

Housing affordability is a key factor when examining the gap between people’s current
housing circumstances and their preferred circumstances, that is, their housing aspirations.
It is also a key contributor to residential satisfaction and significantly affects people’s
residential mobility. Those who cannot afford a house of their preference are more likely to
perceive a gap between circumstance and aspiration resulting in lower residential
satisfaction. This is especially relevant to lower socio-economic groups.

Housing affordability is fundamentally related to housing satisfaction (Rahman et al., 2014;
Sajan, 2015). In Ireland, the percentage spent on housing costs rose from 25% to 40% from
2009-2014 (Lyons, 2015). A survey of aspirant homeowners found that one-third were willing
to spend 50% of their future income on mortgage repayments (Corrigan et al., 2019).

The OECD (2013) state that housing affordability is a tenure-neutral term that denotes the
relationship between household income and household expenditure relating to housing. The
OECD goes on further to explain several measures of housing affordability. The primary
measure being an income-to-expenditure ratio which is a measure used by many OECD
countries that no more than 30% of household income is spent on housing.

In an Irish context, the EBS/ DKM consultants Housing Affordability Index (2017) uses a first-
time buyer’s ability to fund a mortgage. Influencing factors on affordability are mortgage
rates, disposable incomes, property prices and loan-to-value rates. The Housing Agency
(2016) uses a ‘Median Multiple’ model – the ratio of the median house price to median gross
annual household income.

——
10
Prepared for ENHR Conference 2019 -Workshop 22

3.3Conclusion

Overall, residential satisfaction is a mixture of satisfaction with the housing unit, the
neighbourhood and neighbours. Tenure has been seen to be a key predictor of residential
satisfaction, with home ownership positively associated with residential satisfaction. Housing
affordability has also been found to be related to housing satisfaction.

——
11
Prepared for ENHR Conference 2019 -Workshop 22

4 Research Methodology

4.1 Sampling methodology

The survey collected data, via face-to-face interviews, from 1,369 adults, including a booster
sample of 200 renters. A weighting was developed to ensure a nationally representative
dataset when combining the main and the booster samples. This study uses the combined
weighted dataset of 1200 respondents. A nationally representative sample was achieved by
placing quotas on gender, location and social class. A sample of 1,200 is statistically robust
with a plus or minus margin of error of 2.83 at a 95% confidence interval. The sampling
frame was the Geodirectory1 and the sampling methodology was a 2-stage probability
design, including quotas-1) the selection of 120 sample clusters from across the 2,700
electoral districts and 2) the selection of houses within the clusters. Interviewers visited
every fifth house and the ‘next birthday’ rule was used to select the house and the adult
interviewed within the house.

The questionnaire used to collect data was created by the Housing Agency using, where
relevant, validated questions from other nationally representative surveys. The questionnaire
was scripted for computer -assisted personal interviewing (CAPI).

4.2 Sample profile

The weighted sample included 382 renters (230 in the private rental sector and 152 in the
social rental sector) and 782 homeowners (474 owned their home outright and 308 owned
their home with a mortgage).
Table 2: Sample Demographic, Tenure and Housing Profile

                                                                                    %
    Age group                         18-24                                         4%

1
 The Geodirectory provides precise geographic location and postal addresses for
every home in Ireland.

——
12
Prepared for ENHR Conference 2019 -Workshop 22
25-34 15%
35-44 24%
45-54 17%
55-64 17%
65+ 23%
Gender Male 49%
Female 51%
Province Dublin 29%
Leinster (excluding Dublin) 26%
Munster 27%
Connaught or Ulster 18%
Region Dublin 29%
Regional Cities (Cork, Galway, Waterford, 9%
Limerick)
Urban Towns (population > 1500) 25%
Rural 36%
Employment status Full-time employed 42%
Part-time employed 11%
Self-employed or working family business 5%
Unemployed in receipt of social or community 5%
welfare benefit
Third level education (incl. vocational training or 3%
retraining)
Unable to work - sickness or disability 3%
Retired 21%
Looking after family home 11%
Social class AB 13%
C1 29%
C2 21%
DE 31%
F 6%
Marital Status Married or Civil partnership 56%
Cohabiting 6%
Single - never married 21%
Divorced 3%
Widowed 8%
Separated 5%
Refused 1%
Area of Birth Ireland (including Northern Ireland) 86%
Outside Ireland 14%
Tenure type I own this home with a mortgage or loan 26%
——
13Prepared for ENHR Conference 2019 -Workshop 22
I own this home outright 39%
I rent here privately 18%
I rent here from Local Authority 12%
I live here rent free (can also include living in the 3%
family home and paying no rent)2
I rent a room under the rent a room scheme
I rent as part of a house share with friends or 1%
house mates
I live in a family home and pay rent 1%
I rent here from an Approved Housing Body or *
Voluntary or Cooperative Housing Body
Type of Dwelling Bungalow 13%
House (two or more floors) 83%
Apartment (within an apartment complex) 3%
A flat (converted floor within a house) 1%
Housing Support3 Rent Supplement 16%
Rental Accommodation Scheme (RAS) 2%
Housing Assistance Payment (HAP) 4%
Don't know 7%
None of these 72%
Dwelling Type Your main residence 99%
A holiday home owned by yourself or family 1%
A residence used in connection with work but 1%
not main residence
Household Composition One person 20%
Couple without children 23%
Couple with children 36%
Couple without children but with other persons 2%
Couple with children and other persons 2%
One parent with children 9%
One parent with children and other persons 1%
Two or more family units 2%
Non-family household 6%
Living with others (sharing) 7%
Living in the family home (with parents) 3%
Other Please specify 0
Refused 1%
——
14Prepared for ENHR Conference 2019 -Workshop 22 5 Results 5.1 Housing Satisfaction The literature review pointed to single-item and multiple-item measures to measure housing satisfaction, that is, satisfaction with the housing unit. For the purposes of this paper, three questions asked in the survey have been analysed, one utilising a single-item measure and the other two multiple-item measurement scales. The first question asked participants to rate their level of satisfaction with their current home on a five-point Likert-type scale with ‘1’ being ‘very dissatisfied’ and ‘5’ being ‘very satisfied’. The second question was a scale instrument which asked respondents to rate their level of agreement on a series of five-point Likert-type scales where ‘1’ was ‘strongly disagree and ‘5 was’ ‘strongly agree’. The scale comprised four statements, which were: ‘I do not find it difficult to live in this home’; ‘my home is suited to my needs’; ‘I have chosen to live in this home’ and, ‘I enjoy living in this home’. The third question is intended to determine levels of satisfaction with the housing unit, which asked respondents to rate their home on twelve factors on a scale from ‘1’ to ‘3’ from ‘not at all a problem’, to ‘somewhat a problem‘ or ‘a big problem’. The twelve factors were: shortage of space; home being too big for current needs; rot in windows, doors/floors; damp or leaks in walls or roof; noise from neighbouring homes; lack of a bath/shower; lack of downstairs toilet/bathroom facilities; lack of place to sit outside; difficulties with carrying out maintenance/ upkeep yourself; difficulties with cost of upkeep; difficulties keeping home warm and, home not feeling safe/secure. Housing satisfaction levels for Irish dwellers were found to be very high, with 92% of respondents being either satisfied or very satisfied with their current home. Owners (57%) were almost twice as likely as renters (30%) to say they were ‘very satisfied’ with their housing. While levels of dissatisfaction were very low in both tenures, with just 4% of renters and 2% of owners ‘dissatisfied’ or ‘very dissatisfied’ with their housing. —— 15
Prepared for ENHR Conference 2019 -Workshop 22

Table 3: Housing Satisfaction by Tenure

 Housing                     All Tenure          Owners                  Renters
 Satisfaction

 Very Satisfied              49%                 57%                     30%

 Satisfied                   43%                 38%                     55%

 Neutral                     6%                  3%                      11%

 Dissatisfied                2%                  1%                      3%

 Very Dissatisfied           1%                  1%                      1%

The average housing satisfaction score for the overall sample was 4.37 (SD =.735) out of a
maximum of 5 (‘very satisfied’). An independent samples t-test was used to examine
statistically significant differences between owners and renters in terms of housing
satisfaction. The average housing satisfaction of owners was 4.49 (SD=.681), compared to
4.14 (SD=0.778) for renters. Statistically significant differences were found, suggesting
owners and renters differed in terms of housing satisfaction [t(1197)=8.095, p>.001], with
owners more likely to have higher residential satisfaction than renters. The effect was found
to be small to moderate with an eta squared of .052.

Four statements were used to understand how satisfied people were with the home they
were living in. The scale, as before, was from ‘1’ for ‘strongly disagree’ to ’5’ for ‘strongly
agree’. When respondents were asked whether they agreed with different statements about
their house, high levels of satisfaction were again in evidence, as can be seen in Table 4.
This shows the percentage of respondents ‘strongly agreeing’ with each of the statements.
As with the results for housing satisfaction, owners were far more likely than renters to
‘strongly agree’ with each of these statements about their housing.

Table 4 : Housing Satisfaction Statements – Strongly Agree

                                    Strongly     Strongly          Strongly
                                    Agree        Agree             Agree

                                    All Tenure   Owners            Renters

 I find it easy to live in this     71%          76%               59%
 home

——
16
Prepared for ENHR Conference 2019 -Workshop 22 My home is suited to my 69% 76% 57% needs I have chosen to live in 72% 76% 60% this home I enjoy living in this home 71% 76% 60% For the statement ‘I find it easy to live in this home’ the overall average was 4.54 (SD=.891) out of a maximum of 5 for strongly agreeing. For owners the average score was 4.65 (SD=.782) and for renters it was 4.35 (SD=1.038). An independent sample t-test found statistically significantly differences between owners and renters [t(673.476)=5.255,p
Prepared for ENHR Conference 2019 -Workshop 22

The final question in this analysis asked respondents to rate their housing against twelve
factors from ‘not a problem’, ‘somewhat of a problem’ or ‘a big problem’. A high proportion of
all households did not have any issues with a range of dwelling-related problems. A shortage
of space was found to be the most common problem, with one-fifth of people reporting this
as an issue. The graph in Figure 2 shows where respondents have answered that the factor
is ‘somewhat of a’ or ‘a big problem’ to them. The only area where owners tended to be less
satisfied than renters was with their house being too big for their current needs. While a third
of renters compared to 15% of owners said that a shortage of space was a problem. Renters
felt less secure, found it harder to keep their homes warm and suffered more from noise
from neighbouring homes. Renters are also more likely to lack a space to sit outside and
experience dampness or rot in their windows, doors or floors.

Figure 2: Housing Issues – ‘Somewhat of’ or ‘A big Problem’

                          Shortage of space
           Difficulties keeping home warm
            Difficulties with cost of upkeep
Difficulties with carrying out maintenance
        Lack of downstairs toilet/bathroom
           Noise from neighbouring homes                                             Homeowners
             Damp or leaks in walls or roof
             Home too big for current needs
            Rot in windows, doors or floors                                          Renters
            Home not feeling safe or secure
                Lack of place to sit outside
                   Lack of a bath or shower
                                                 0%   5%   10%   15%    20%    25%     30%     35%

Significant tests were run. Table 5 contains the results of the independent sample t-tests,
with statistically significant results found with p
Prepared for ENHR Conference 2019 -Workshop 22
Table 5: Housing Issues, Independent t-test results owners and renters
Housing Issues Owners Renters
M SD M SD t-test*
Shortage of space 1.19 .468 1.40 .676 pPrepared for ENHR Conference 2019 -Workshop 22 long-term; ‘I would recommend this neighbourhood to friends looking for a place to live; and, ‘My neighbourhood is a good place to raise children’. The third question used a single-item measure to determine levels of satisfaction with the neighbourhood asked participants to say overall if they though their area was: ‘changing for the worse’, ‘not changing’ or ‘changing for the better’. Neighbourhood satisfaction levels for Irish dwellers, like housing satisfaction levels, were found to be very high, with 91% of respondents being either satisfied or very satisfied with their current neighbourhood. Owners (56%) were more likely than renters (32%) to say they were ‘very satisfied’ with their neighbourhood. While levels of dissatisfaction were very low in both tenures, with just 5% of renters and 2% of owners ‘dissatisfied’ or ‘very dissatisfied’ with their neighbourhood. Table 6: Neighbourhood Satisfaction Housing All Tenure Owners Renters Satisfaction Very Satisfied 48% 56% 32% Satisfied 43% 38% 53% Neutral 7% 5% 11% Dissatisfied 2% 1% 4% Very Dissatisfied 1% 1% 1% The average neighbourhood satisfaction score for the overall sample was 4.37 (SD =.734) out of a maximum of 5, which was ‘very satisfied’. An independent samples t-test was used to examine statistically significant differences between owners and renters in terms of neighbourhood satisfaction. The average neighbourhood satisfaction of owners was 4.48 (SD=.683) compared to 4.16 (SD=0.778) for renters. An independent samples t-test found statistically significant differences between owners and renters [t(1197=7.395), p
Prepared for ENHR Conference 2019 -Workshop 22

statements. Owners were far more likely than renters to ‘strongly agree’ with each of these
statements about their neighbourhood, though levels in all tenure were high.

Table 7: Neighbourhood Satisfaction Statements – Strongly Agree

 Neighbourhood                      Strongly     Strongly         Strongly
 Satisfaction                       Agree        Agree            Agree

                                    All Tenure   Owners           Renters

 I would like to stay here          66.9%        74.8%            52.2%
 long-term

 I would recommend this             65.8%        73.8%            51.0%
 neighbourhood to friends
 looking for a place to live

 My neighbourhood is a              67.1%        73.2%            55.6%
 good place to raise
 children

The statement ‘I would like to stay here long-term’ scored an average for the sample of 4.46
(SD=.938) out of a maximum of 5 for strongly agreeing. For owners the mean score was
4.61 (SD=.806) and for renters it was 4.17 (SD=1.089). An independent sample t-test found
statistically significantly differences between owners and renters [t(664.740=7.319, p
Prepared for ENHR Conference 2019 -Workshop 22 than renters to agree that their neighbour was a good place to raise children. The effect however, was small with and eta squared of.042. The final question in this analysis asked respondents to rate their area on whether they thought it was changing for the worse, staying the same or improving. Almost four times as many people thought their neighbourhood was changing for the better compared to those who thought it was changing for the worse. There were differences between renters and owners; almost half of all owners (47.2%) thought their neighbourhood was changing for the better, while just over a third of renters thought this. Similar numbers of renters and owners perceived their neighbourhood as changing for the worse. Table 8 contains the responses to this question. Table 8: Perceptions of neighbourhood changing by tenure Would you say overall All Tenure Owners Renters your area is….? Changing for the worse 11.9% 12.3% 11.3% Not changing 45.0% 40.5% 53.2% Changing for the better 43.1% 47.2% 35.5% 5.3 Affordability Two questions have been analysed to assess the level of difficulty homeowners with a mortgage and renters experience meeting their rental or mortgage costs each month. Renters were asked to rate on a scale of one to five from a lot of difficulty to no difficulty they had meeting their monthly rental costs. Those answering two, three and four were combined to create ‘some difficulty’. Owners with a mortgage were asked if they had any difficulties meeting their monthly mortgage repayments and could answer from ‘1’ being ‘lots of difficulty’ to ’3’ being ‘no difficulty’, with results shown in Table 9. A high proportion of homeowners with a mortgage are largely untroubled by affordability issues. Two thirds of people with a mortgage said that they had no difficulty repaying their mortgage each month, while a third had some difficulty, and just one in fifty people experienced lots of difficulty repaying their mortgage each month. This is reversed for renters. Just one third of renters said they had no difficulty paying their rent each month —— 22
Prepared for ENHR Conference 2019 -Workshop 22

compared to two thirds who experienced some difficulty and one in thirteen who experienced
lots of difficulty.

Table 9: Affordability of monthly rental costs or mortgage repayments

 Difficulty paying           Owners              Renters
 rent/mortgage

 Lots of difficulty          2.2%                5.8%

 Some difficulty             32.6%               62.3%

 No difficulty               60.3%               31.9%

5.4 Residential Satisfaction

The literature review pointed to residential satisfaction as a composite theory drawing on
satisfaction with the housing unit, the neighbourhood and life in general. This study used
both single-item and multiple-item measures to ascertain satisfaction levels. Two single-item
measures asked respondents to rate on a 5-point Likert-type scale their satisfaction, firstly
with their housing unit and secondly, with their neighbourhood. For this analysis, a
composite measure combining responses for both of these questions was created and the
answers analysed. For the overall sample, the score for residential satisfaction was 8.74
(SD=1.314) out of a maximum score of 10. Owners residential satisfaction scores were an
average of 8.97 (SD=1.191), while renters scored an average of 8.30 (SD=1.420). An
independent samples t-test found statistically significant differences in levels of residential
satisfaction between renters and owners [t(732.278=8.258), p
Prepared for ENHR Conference 2019 -Workshop 22

6 Discussion and Conclusion

The literature review pointed to the substantial levels of research that shows that
homeownership is a key factor in determining levels of satisfaction. This research
substantiates these findings for Irish householders.

This study used a single-item measurement to measure levels of housing satisfaction,
comparing satisfaction levels for owners and renters. While, the majority of all households
were found to be satisfied or very satisfied with their housing, there were significant
differences found between the two tenure groups.

Significant differences were found in a range of housing issues between renters and
homeowners. In particular; shortage of space; difficulties keeping the home warm, and the
cost of upkeep were found between the two tenure groups.

The results in this study support the findings of Elsinga and Hoekstra (2005) who found that
the higher quality of housing in owner occupied homes than rented homes partly explained
the higher levels of housing satisfaction However, this was only partly, as when tenure-
related housing quality differences were controlled for, homeownership still remained
statistically significant, except for in Austria.

The overwhelming aspiration of Irish people is still to own their own home, though many will
never be able to do so. Ireland has moved from a nation with over 80% of tenure in
homeownership in the early 1990s to more recently an ownership rate in line with the
European average, with 67.6% of households in homeownership (CSO 2016). Policies have
started to reflect this changing reality. Recent legislation has aimed to ensure greater
security for tenants and strengthened rights. The strengthened role of the Residential
Tenancies Board also aims to improve standards in the rental sector.

The Housing Agency’s exploratory focus group research found that renters were likely to be
less connected to their neighbourhoods and communities than homeowners. This study
found extremely high levels of satisfaction with the neighbourhoods people are living in –
with overall 91% either satisfied or very satisfied with the neighbourhood. Significant
differences were found between renters’ and homeowners’ levels of satisfaction, with more

——
24
Prepared for ENHR Conference 2019 -Workshop 22

than half (56%) of homeowners very satisfied with their neighbourhoods, compared to just
under a third (32%) of renters.

The results from the statements which tried to ascertain levels of attachment to the
neighbourhood would substantiate the findings from the Housing Agency focus groups.
While three-quarters of homeowners strongly agree that they would like to stay living in their
neighbourhoods long-term, this dropped to just over half of all renters. Again, almost three-
quarters of homeowners thought their neighbourhood was a good place to raise children
while just over a half of renters did. Ensuring renters feel a strong attachment to their
neighbourhoods and communities is an important policy consideration as the number of
householders in this tenure continues to increase.

Affordability is a key issue in Ireland, driven by a lack of supply, increasing rents, increasing
house prices and stricter regulations on credit lending. Housing affordability has also been
shown to be a key determinant in housing satisfaction. This study revealed that there were
differences between renters and owners in terms of difficulties paying their rent or repaying
their mortgage. What was found in this study was that a surprising number of homeowners
with a mortgage appear to be largely untroubled by affordability issues. Two thirds of people
with a mortgage said that they had no difficulty repaying their mortgage. However, further
analysis would be interesting to see when these mortgages were taken out.

In terms of renters it was a very different story. Two thirds of renters experienced difficulties
nationally paying their rent each month. Recent research has shown that for young people
buying their first property has become more difficult than it was a generation ago (Turnbull.
2017). In the Housing Agency’s Statement of Housing Supply and Demand (2018) the issue
of affordability was discussed and highlighted. Renters tend to have less disposable income
and are more likely to experience affordability problems. A range of policies have been
introduced by the government to attempt to address affordability issues. Rent pressure
zones were introduced to help counteract high rent increases in certain areas. Where they
have been introduced, rent increases have been capped at 4% per annum over a three-year
period.

In conclusion, this study has shown that Irish homeowners tend to be a lot more content with
their housing and their neighbourhoods than those who rent.

——
25
Prepared for ENHR Conference 2019 -Workshop 22

Bibliography
Adriaanse, C.C.M. (2007), “Measuring residential satisfactions: a residential environment
       satisfaction scale (RESS)”, Journal of Housing and Built Environment. 22(3). pp: 287-
       304

Amerigo, M. and Aragones, J.I. (1997) “A Theoretical and Methodological Approach to the
      Study of Residential Satisfaction”, Journal of Environmental Psychology, Vol.17 (1),
      pp 47-57.

Biddlecombe, Bob, (2001) “Planning suburbia: density dilemmas”. Papers from practice:
       planning suburbia.

Bogardrus Drew, Rachel (2014) “Believing in Home Ownership: Behavioural Drivers of
      Housing Tenure Decisions”, Joint Center For Housing Studies, Harvard University.

Bounds, M., (2010) “Governance and residential satisfaction in multi-owned developments in
      Sydney”, in Blandy, S., Dupuis, A. & Dixon, J. (eds), Multi-owned housing : law,
      power and practice. Farnham: Ashgate, 145-158.

Corrigan, Eoin, Cotter, Paul & Hussey, George, (2019) The housing aspirations and
       preferences of renters. IGEES Research Paper, retrieved from
       https://igees.gov.ie/wp-content/uploads/2019/03/The-Housing-Aspirations-and-
       Preferences-of-Renters.pdf.

Crull, Sue. R, Eicher Bode, Marilyn and Morris, Earl. W, (1991) “Two Tests of the Housing
        Adjustment Model of Residential Mobility”, Housing and Society, Vol. 18, No.3.

Central Statistics Office, “Census of Population 2016-Profile 1 Housing in Ireland”, Dublin.

Davis, E, and Fine-Davis, M. (1981) “Predictors of Satisfaction with Housing and
       Neighbourhood: A Nationwide Study in the Republic of Ireland”, Social Indicators
       Research, Vol.9, No.4, pp 477-494.

Diaz-Serrano, L. (2006) “Housing Satisfaction, Homeownership and Housing Mobility: A
      Panel Data Analysis for Twelve EU Countries”, IZA Discussion Paper, No. 2318.

Diaz-Serrano, L. (2008) “Disentangling the housing satisfaction puzzle: Does
      homeownership really matter?”, Journal of Economic Psychology, Vol. 30, pp745-
      755.

Elsinga, M. & Hoekstra, J. (2005) “Homeownership and housing satisfaction”. Journal of
       Housing and the Built Environment, 20(4), 401.

Eurostat, Housing Statistics Tenure Status (ilc_lvho02) retrieved from:
       https://ec.europa.e/eurostat/statistics

EBS/ DKM Economic Consultants (2017), Irish Housing Affordability Index, July 2017.

——
26
Prepared for ENHR Conference 2019 -Workshop 22
Glaeser, E. L. & Shapiro, J. M. (2003) Urban Growth in the 1990s: Is City Living Back?
Journal of Regional Science, 43(1), 139-165.
Grinsten-Weiss, Michal, Yeo, Yeong, Anacker, Katrin, Can Zandt, Shannon, B. Freeze,
Elizabeth and G. Quercia, Roberto (2011), Homeownership and Neighbourhood
Satisfaction Among Low and Moderate-Income Households. Journal of Urban Affairs,
Vol.33, No.3, pp247-265
Herfert, Gunter, Silvia Neugebauer, Carola and Smigiel, Christian, (2012) “Living in
Residential Satisfaction? Insights for large-scale housing estates in Central and
Eastern Europe. Leibniz-Institute for Regional Geography, Vol.104, No.1, pp 57-74.
Housing Agency, (2017) National Statement of Housing Supply and Demand 2016 and
Outlook for 2017 – 2018. Housing Agency, Dublin.
Housing Agency, (2018) Drivers of Residential Satisfaction and Aspirations in Ireland.
National study of Irish housing experiences, attitudes and aspirations in Ireland,
Report 1. Housing Agency, Dublin.
Housing Agency, (2018) Irish Residential Satisfaction. National study of Irish housing
experiences, attitudes and aspirations in Ireland, Report 2. Housing Agency, Dublin
Housing Agency, (2019) Housing experiences of renters and owners in Ireland. National
study of Irish housing experiences, attitudes and aspirations in Ireland, Reports 3 and
4. Housing Agency, Dublin.
Howley, P. (2009) Attitudes towards compact city living: Towards a greater understanding of
residential behaviour. Land Use Policy, 26(3), 792-798.
Howley, P. (2010) 'Sustainability versus Liveability': An Exploration of Central City Housing
Satisfaction. The International Journal of Housing Policy, 10(2), 173-189.
Howley, P., Scott, M. & Redmond, D. (2009a) An examination of residential preferences for
less sustainable housing: Exploring future mobility among Dublin central city
residents. Cities, 26(1), 1-8.
Howley, P., Scott, M. & Redmond, D. (2009b) Sustainability versus Liveability: An
Investigation of Neighbourhood Satisfaction. The Journal of Environmental Planning
and Management, 52(6), 847-864.
Jansen, Slyvia J.T., Coolen, Henny C.C.H, and Goetgeluk, Roland W. (2011) “The
Measurement and Analysis of Housing Preference and Choice”. Springer.
Lu, M (1999), “Determinants of Residential Satisfaction: Ordered Logit vs. Regression
Models. Growth and Change”, Vol. 30, pp 264-287
——
27Prepared for ENHR Conference 2019 -Workshop 22
Marsh, Alex and Gibb, Kenneth, Gibb, (2011) “Uncertainty, Expectations and behavioural
Aspects of Housing Market Choices”, Housing, Theory and Society, Vol.21, No.3, pp
215-235.
Montgomery, M and Curtis, C (2006) “Housing Mobility and Location Choice: A Review of
the Literature. Impacts of Transit LED Development” Working Paper No. 2. Curtin
University.
Murphy, Enda and Scott, Mark, (2014) “After the Crash’: Life Satisfaction, everyday financial
practices and rural households in post Celtic Tiger Ireland”, Journal of Rural Studies,
Vol.34, pp 37-49.
Norris, Michelle (2013) “Varieties of home ownership:Ireland’s transition from a socialised to
a marketized policy regime”. UCD Geary Institute Discussion Paper Series
OECD, (2013) “Home Sweet Home: The Determinants of Residential Satisfaction and its
Relation with Well-Being” Working Paper No.54
Permentier, Matthieu, Bolt, Gideon and van Ham, Maarten. (2009), “Determinants of
Neighbourhood Satisfaction and Perception of Neighbourhood Reputation”, Urban
Studies Journal, Vol.48, No.5 (April 2011), pp 977-996.
Rohe, W. M. & Stegman, M. A., (1994) “The effects of homeownership on the self-esteem,
perceived control and life satisfaction of low-income people.” American Planning
Association. Journal of the American Planning Association, 60(2), 173.
Sam, Mehdi, Zain, Muhammad and Saadatian, Omidreza (2012) “Residential satisfaction
and construction”, Scientific Research and Essays, Vol.7, No.15, pp 1556-1563.
Skifter-Anderson, Hans, (2011) “Motives for Tenure Choice during the Life Cycle: The
Importance of Non-Economic Factors and Other Housing Preferences”, Housing,
Theory and Society Vol.28, No.2, pp 183-207.
The Housing Agency (2017) “National Statement of Housing Supply and Demand 2016 and
Outlook for 2017-18”.
Thomas, Elli, Serwicka, Ilona, Serwicka and Swinnery, Paul (2015) “Urban Demographics,
Why people live where they do”, Centre for Cities, November 2015.
Turnbull, Dara (2017) “A long-term assessment of Irish house price affordability”, Neri
Working Papers 2017/No 44
Ubani, Princewill, Alaci, Davidson and Udoo, Vesta (2017) “Determinants of Residential
Neighbourhood Choice in a Nigerian Metropolis”, Journal of Humanities and Social
Sciences, Vol.22, issue 7, Version 11 (July 2017), pp 01-11.
Vera-Toscano, Esperanze and Ateca-Amestoy, Victoria, (2008), The Relevance of social
interactions on housing satisfaction. Social Indicators Research, Vol.86, pp 257-274.
——
28Prepared for ENHR Conference 2019 -Workshop 22
Whittle, Richard, Davies, Thomas, Gobey, Matthew and Simister, John, (2014), “Behavioural
Economics and House Prices: A Literature Review”, Business and Management
Horizons, Vol.2. No.2.
Winston, N., (2014) “Dwelling type and quality of life in urban areas: evidence from the
European Social Survey”, Working Paper 2014-11. Research Repository UCD.
University College Dublin.
——
29You can also read