Residential Vacancies in the City of San Diego - We're About People September 2021
←
→
Page content transcription
If your browser does not render page correctly, please read the page content below

We’re About People

Residential Vacancies
       in the
 City of San Diego
     September 2021
Table of Contents

Introduction....................................................................................................................................................................................... 3

Glossary................................................................................................................................................................................................. 3

Findings................................................................................................................................................................................................. 4

Methodology.................................................................................................................................................................................10
    SDG&E Data Methodology............................................................................................................................................................10

    PUD Data Methodology.................................................................................................................................................................12

Literature Review........................................................................................................................................................................13
    Vancouver, British Columbia........................................................................................................................................................13

    Toronto, Ontario...............................................................................................................................................................................14

    Washington, D.C...............................................................................................................................................................................14

    Oakland, California..........................................................................................................................................................................15

    Los Angeles, California – Study 1................................................................................................................................................16

    Los Angeles, California – Study 2................................................................................................................................................17

    San Francisco, California................................................................................................................................................................17

    Richmond, California.......................................................................................................................................................................18

    Melbourne, Australia.......................................................................................................................................................................19

Appendix...........................................................................................................................................................................................20
    Electricity and Water Consumption Analysis Results...........................................................................................................21

    Preliminary Methodology Research for GIS Literature Review.........................................................................................30

    Preliminary Research on Cities with a Vacancy Tax...............................................................................................................31

Residential Vacancies in the City of San Diego                                                                                                                                                           2
INTRODUCTION

         Homes held vacant in the City of San Diego, whether for investment or vacation use, are cited frequently as
         potential contributors to the ongoing housing affordability crisis in the City of San Diego, in which many San
         Diegans are unable to find market-rate rental housing or homeownership opportunities they can afford.

         To help determine the extent to which homes are vacant, the San Diego Housing Commission (SDHC) Board
         of Commissioners directed SDHC staff to commence a study to identify housing units vacant for six months or
         longer.

         SDHC staff worked with San Diego Gas & Electric (SDG&E) to obtain a dataset of 468,352 SDG&E premises IDs
         with utility usage for five calendar years, which resulted in 86 million anonymized records of residential utility
         usage in the City of San Diego between January 1, 2015, and December 31, 2019, predating the COVID-19
         pandemic, during which Governor Gavin Newsom’s executive orders required California residents to stay
         home to help prevent the spread of COVID-19.

         In addition to the five years of utility data SDG&E provided, the City of San Diego Public Utilities Department
         (PUD) provided five years of data for this study, covering the same timeframe from 2015 to 2019. Residential
         electricity usage data and water consumption data are two of the most common datasets used to identify
         vacant units based on vacancy studies conducted in other jurisdictions. This is due to a number of factors, but
         primarily because a) nearly all occupied residential units use these utilities, b) they are billed on a regular basis,
         and c) they are provided citywide.

         SDHC contracted with Circulate San Diego and Evari GIS Consulting to work with SDHC to analyze these
         datasets. The project team developed two methodologies to analyze each of the datasets, respectively, and
         identify vacant units. For this study, vacancy is defined as a residential unit that had either 1) statistically low
         electricity usage for a period of six consecutive months or more and/or 2) no associated PUD water accounts
         for at least six consecutive months at any time during the five years for which the data were analyzed.

              GLOSSARY

                   •    SDG&E – San Diego Gas and Electric
                   •    PUD – City of San Diego Public Utilities Department
                   •    Hexbin - A standardized geographical unit that allows for easy pattern- and hot-spot
                        recognition in large datasets
                   •    kWh – kilowatt hour, a measure of energy usage
                   •    Unoccupied – Period of notably low energy usage based on an individual residential unit’s
                        average energy usage
                   •    Vacant – A period of at least six consecutive months of being unoccupied

Residential Vacancies in the City of San Diego                                                                                  3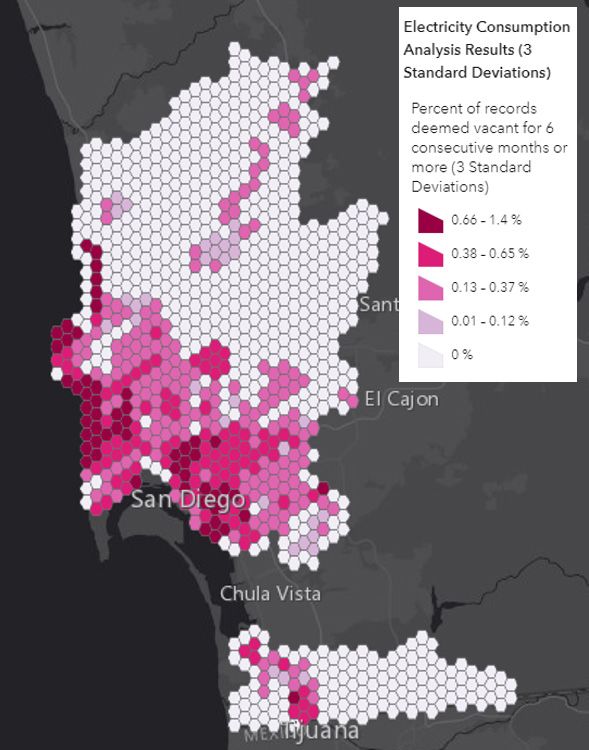
FINDINGS

         Less than 1 percent of residential housing units in the City of San Diego were determined to have been vacant
         for six consecutive months at any one time in the five years for which data were obtained (2015 to 2019),
         based on analysis using methodologies detailed later in this report.

         The analysis performed on five years of SDG&E data identified between 1,512 and 3,708 potentially vacant
         residential units in the City of San Diego, depending on the number of standard deviations used in the
         analysis. Using the 468,352 individual premises IDs provided by SDG&E for this study, the percentages equate
         to between 0.32 percent and 0.79 percent of all residential properties as being potentially vacant for six
         months or more.

         A second analysis using PUD data identified 2,138 potentially vacant units out of 252,324 records, or
         approximately 0.85 percent of all residential contract accounts. The discrepancy between datasets is a result
         of the way the respective agencies track energy usage. SDG&E bills are generally associated with an individual
         dwelling unit, while PUD bills may often cover several dwelling units, particularly in multifamily structures,
         where one water meter may be associated with the overall usage for all the dwelling units on the property.

         The methodologies used to analyze the two datasets for this study are detailed in the Methodology section of
         this report.

         The project team mapped the results of the analyses using several geographies—City Council district,
         Community Plan Area, and conceptual “hexbins,” which are a common way of displaying aggregate data using
         hexagonal geographic units of identical size.

         Figure 1a, Figure 1b and Figure 2 show the generalized location of vacant units using the hexbin method.
         Table 1 and Table 2 present the findings by City Council district and Community Plan Area boundaries.

         The sum of vacant units by Community Plan Area and Council District do not correlate to the total number of
         vacant units provided by SDG&E, as their geographies do not match the geography of the census tracts, the
         original geographic unit of the SDG&E data. In addition, the PUD results may have undercounted potentially
         vacant, individual dwelling units found on multifamily parcels with a single water meter; however, this
         assumption was not definitively proved as part of this project’s scope.

Residential Vacancies in the City of San Diego                                                                          4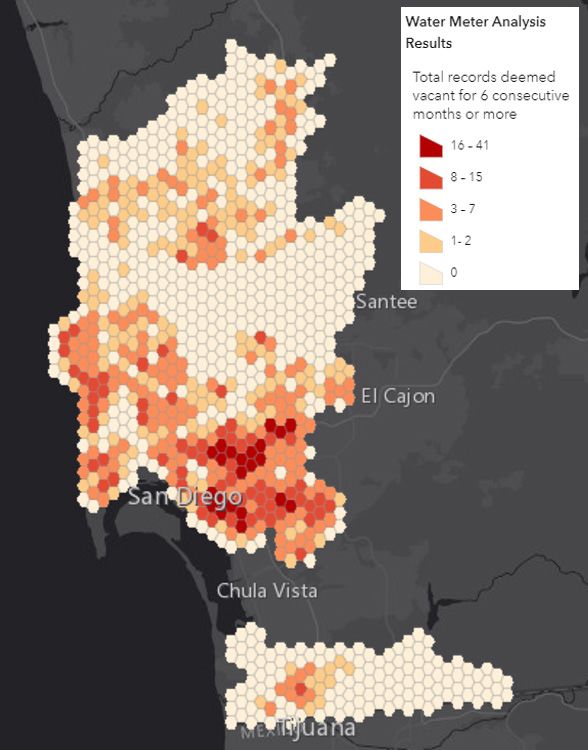
Figure 1a – Geographic Distribution of City of San Diego Vacant Units, SDG&E Data; Three Standard
         Deviations

Residential Vacancies in the City of San Diego                                                               5
                                                            3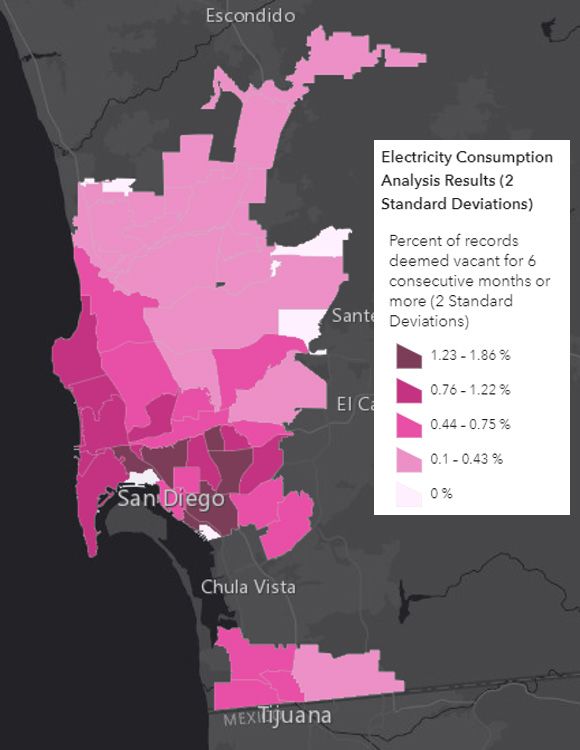
Figure 1b – Geographic Distribution of City of San Diego Vacant Units, SDG&E Data; Two Standard
         Deviations

Residential Vacancies in the City of San Diego                                                             6
                                                            4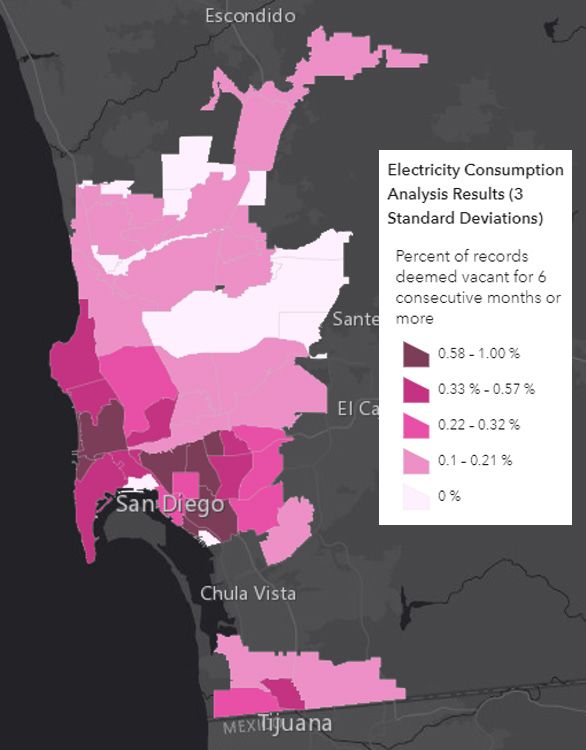
Figure 2 – City of San Diego Vacant Units, PUD Data

         Note: SDG&E data may reflect higher vacancy rates in coastal areas than PUD data because of a higher
         number of multifamily dwelling units in those areas that are on a single water meter. For example, a six-
         plex at the coast would have six SDG&E bills but only one water meter/bill. SDG&E data would reflect
         vacancies for each unit in the complex because each unit has its own record. However, PUD data would
         only display the property as vacant if all six dwelling units were vacant at the same time and the water to
         the entire complex was turned off.

         Table 1 – Count of City of San Diego Potentially Vacant Units by Community Planning Area

Residential Vacancies in the City of San Diego                                                                         7
                                                               5
Table 1 – Count of City of San Diego Potentially Vacant Units by Community Planning Area
          Community Plan Area                                       SDG&E Data                    PUD Data
                                                          Two Standard       Three Standard
                                                           Deviations          Deviations
          Balboa Park                                          522                  9                 0
          Barrio Logan                                          30                 14                12
          Black Mountain Ranch                                   3                  0                13
          Carmel Mountain Ranch                                  5                  0                14
          Carmel Valley                                         29                  8                24
          Clairemont Mesa                                     202                  78               116
          College Area                                          54                 22               108
          Del Mar Mesa                                           5                  2                5
          Downtown                                            150                  65                19
          East Elliott                                           0                  0                 0
          Encanto Neighborhoods                                 72                 26               173
          Fairbanks Ranch Country Club                           0                  0                 0
          Greater Golden Hill                                   95                 59                42
          Kearny Mesa                                           19                  9                 2
          La Jolla                                            125                  46               106
          Linda Vista                                         100                  41                51
          Los Penasquitos Canyon                                3                   0                 0
          Mid-City:City Heights                               283                 115               157
          Mid-City:Eastern Area                                 96                 29                70
          Mid-City:Kensington-Talmadge                         68                  22                28
          Mid-City:Normal Heights                             131                  41                36
          Midway-Pacific Highway                               31                  11                 0
          Military Facilities                                    1                  0                 0
          Mira Mesa                                            99                  20                90
          Miramar Ranch North                                    7                  4                 8
          Mission Bay Park                                      50                 33                1
          Mission Beach                                          2                  1                33
          Mission Valley                                        62                 23                 4
          Navajo                                                71                 20                78
          NCFUA Subarea II                                       2                  1                 1
          North Park                                          284                 135               116
          Ocean Beach                                           61                 45                21
          Old Town San Diego                                     5                  2                 3
          Otay Mesa                                             11                  2                 9
          Otay Mesa-Nestor                                      80                 22               21
          Pacific Beach                                       204                  91                85
          Pacific Highlands Ranch                                4                  1                14

Residential Vacancies in the City of San Diego                                                               8
                                                           6
Community Plan Area                                   SDG&E Data                  PUD Data
                                                       Two Standard     Three Standard
                                                        Deviations        Deviations
           Peninsula                                       148                56                69
           Rancho Bernardo                                  23                11                38
           Rancho Encantada                                  0                 0                 5
           Rancho Penasquitos                               42                13                28
           Sabre Springs                                     3                 1                 4
           San Pasqual                                       1                 1                 0
           San Ysidro                                       37                21                29
           Scripps Miramar Ranch                            10                 1               10
           Serra Mesa                                       48                13                24
           Skyline-Paradise Hills                           87                18               115
           Southeastern San Diego                          253               107               181
           Tierrasanta                                      34                 4                25
           Tijuana River Valley                             11                 5                 5
           Torrey Highlands                                  4                 0                 8
           Torrey Hills                                      2                 0                 1
           Torrey Pines                                     13                 1                16
           University                                      121                43                32
           Uptown                                          305               176                84
           Via De La Valle                                   0                 0                 2
           TOTAL                                          3,702             1,468             2,136

         Table 2 – Count of City of San Diego Vacant Units by Council District
           Council                                    SDG&E Data                            PUD Data
          District               Two Standard Deviations        Three Standard Deviations
          1                                 304                              121              201
          2                                 614                              301              273
          3                                 984                              488              300
          4                                 217                               64              345
          5                                  97                               30              120
          6                                 213                               75              165
          7                                 301                               88              169
          8                                 375                              197              387
          9                                 507                              148              178
          TOTAL                            3,612                            1,512            2,138

Residential Vacancies in the City of San Diego                                                          9
                                                            7
METHODOLOGY

         The project team developed two methodologies to analyze the SDG&E data and PUD data, respectively. These
         methodologies were based on approaches used by other jurisdictions reviewed as part of the literature review
         for this study, along with a review of the available San Diego datasets.

         The methodology developed to analyze the SDG&E data was informed by the Vancouver, British Columbia
         study, while the methodology developed to analyze the PUD data was informed by the Melbourne, Australia
         study. This section provides details on how each methodology was developed, tested, and used for this study
         to identify potentially vacant residential units in the City of San Diego.

         SDG&E Data Methodology

         SDG&E provided anonymized monthly residential electricity data, allowing the project team to evaluate five
         calendar years (60 months) of electricity data for each residential unit within the City of San Diego. These data
         were mapped by census tract, using each record’s unique premises ID. Each of the 468,352 residential unit
         records under study for the City of San Diego yielded 60 monthly billing cycles of information available for
         analysis.

         The average monthly kWh usage was calculated for each premises ID, using a unit-specific average based
         on the unit’s historical billing data. Using this “per unit” average, an outlier analysis was performed. Outlier
         analysis is the process of identifying abnormal observations in a dataset. Focusing on the variability of electric
         consumption within a specific residential unit provided greater insight into whether a unit could be deemed
         vacant rather than comparing individual units against each other.

         The project team determined that unoccupied units were potentially vacant only if the utility data showed
         them to be unoccupied for at least six consecutive months based on that unit’s average monthly electricity
         usage. Six consecutive months was selected as the threshold in accordance with the SDHC Board of
         Commissioners’ request and because it is half of the calendar year and thus representative of a significant
         period of time for a unit to be unoccupied. Given the mild climate of San Diego, not much seasonal change in
         vacancy rates occurs, so this analysis did not consider seasonal changes in vacancy rates. Seasonal changes
         have been evident in other studies, including Vancouver, British Columbia. Jurisdictions with significant
         seasonal variances used three or four consecutive months to identify periods of vacancy.

         Identifying consecutive months of a unit being unoccupied is important because a unit could have several
         unoccupied months over the course of the 60 months under study, yet never be considered potentially vacant
         due to high residential turnover, extended vacations, or other conditions likely to result in periods of low-
         energy usage data.

         In rare instances, certain units were vacant for more than one six-month period within the 60 months under
         study. These scenarios were counted only once to maintain a consistent count of residential units across the
         five years of data analyzed. There were no readily apparent or significant differences in potential vacancy rates
         from year-to-year in the five years under study.

Residential Vacancies in the City of San Diego                                                                           10
A unit
A unit was
was determined
determined to to be
be “unoccupied”
“unoccupied” ifif the
the usage
usage for
foraaparticular
particular month
month fell
fell below
belowthree
threestandard
deviationsdeviations
standard of the unit’s respective
of the 60-month60-month
unit’s respective average. The Empirical
average. Rule statesRule
The Empirical thatstates
99.7 percent
that 99.7of data
observed following a normal distribution lies within three standard deviations of the
percent of data observed following a normal distribution lies within three standard deviations mean. Anyofmonth
the with
mean. Any month with usage that fell below this threshold was considered an outlier and classifiedparticular
usage that fell below this threshold was considered an outlier and classified as unoccupied for that as
month.
unoccupied for that particular month.
Using this
Using this analysis,
analysis, the
the project
project team
team identified
identified the
the number
number of of monthly
monthly utility bills, out
utility bills, out of
of 60,
60, that
that fell
fell more
than three
more standard
than three deviations
standard outside
deviations of theof
outside average for that
the average forspecific unit. For
that specific three
unit. For standard deviations, the
three standard
amount of potentially vacant properties was estimated at 1,512 out of 468,352
deviations, the amount of potentially vacant properties was estimated at 1,512 out of 468,352 (0.32 (0.32 percent).
percent).
As a comparison, the project team also conducted the data analysis using a cutoff of two standard deviations,
in which
As 95 percent
a comparison, theofproject
the data fallalso
team within two standard
conducted deviations
the data analysisofusing
the mean.
a cutoff This
of analysis yielded 3,708
two standard
deviations, in which 95 percent of the data fall within two standard deviations of the mean. This units could
potentially vacant units (0.79 percent). Based on monthly utility usage, between 1,500 and 3,700
reasonably
analysis be considered
yielded potentially
3,708 potentially vacant
vacant unitsfor six months
(0.79 percent).orBased
more on in the City ofutility
monthly San Diego
usage,inbetween
the period
between
1,500 and2015
3,700and 2019.
units could reasonably be considered potentially vacant for six months or more in the
City of San Diego in the period between 2015 and 2019.
The project team evaluated reporting the dwelling unit energy usage data using an approach based on both
two project
The standard deviations
team evaluatedandreporting
three standard deviations
the dwelling unit from
energytheusage
unit’sdata
mean energy
using usage amount.
an approach basedReporting
two standard deviations would indicate more potential vacancies, with less
on both two standard deviations and three standard deviations from the unit's mean energy usage statistical confidence in the results,
while three standard deviations would yield greater confidence in the results,
amount. Reporting two standard deviations would indicate more potential vacancies, with less but would yield fewer records.
Followingconfidence
statistical this discussion, three
in the standard
results, while deviations
three standardweredeviations
consideredwould to beyield
the more conservative
greater confidencechoice
in
andresults,
the were usedbut in this report.
would At the
yield fewer same time,
records. the results
Following for two standard
this discussion, deviations
three standard are presented
deviations were here
for comparison,
considered to beallowing
the morethe reader to understand
conservative choice andthe range
were usedofinpotential
this report.vacancies identified
At the same time,inthe
the SDG&E
monthly energy usage data.
results for two standard deviations are presented here for comparison, allowing the reader to
understand the range of potential vacancies identified in the SDG&E monthly energy usage data.
Speculating, or otherwise determining, the reason for lower monthly totals was beyond the scope of this
study. Residents
Speculating, may take determining,
or otherwise vacations, travel
the for work,fororlower
reason transactions
monthlymay result
totals wasinbeyond
a change theinscope
ownership
of or
leasing
this of units
study. over the
Residents maycourse of weeks, travel
take vacations, or occasionally
for work, ormonths, all of which
transactions couldinresult
may result in an in
a change individual unit
falling below its own average use, thereby yielding an outlier designation.
ownership or leasing of units over the course of weeks, or occasionally months, all of which could
result in an individual unit falling below its own average use, thereby yielding an outlier designation.
Diagram of SDG&E data methodology
Residential Vacancies in the City of San Diego 11
9PUD Data Methodology
PUDCity
The Dataof Methodology
San Diego Public Utilities Department (PUD) also provided data to the project team for
analysis. PUD provided a list of 33,848 residential contract accounts that had active water meters, but
Theassociated
no City of Sancontract
Diego Public Utilities
accounts Department
at some (PUD)the
point during also provided
period under data to the
study project
between team for
CY2015 andanalysis.
CY2019 (the same window of time evaluated using SDG&E data). The data PUD provided were a associated
PUD provided a list of 33,848 residential contract accounts that had active water meters, but no
contract
subset ofaccounts
all contractat some point
accounts during
from the period
CY2015 through under study
CY2019, between CY2015
approximately and individual
252,324 CY2019 (the same
window of time evaluated
metered residential accounts. using SDG&E data). The data PUD provided were a subset of all contract accounts
from CY2015 through CY2019, approximately 252,324 individual metered residential accounts.
Each water meter record included a date range for when the property started and ended this
Each waterranging
condition, meter record
from aincluded
period ofa adate
fewrange
days to,forinwhen the property
rare cases, startedofand
every month theended this condition,
study period. Using
ranging from a period of a few days to, in rare cases, every month of the study
the “six months consecutive” definition of potential vacancy consistent with the SDG&E data period. Using the “six months
consecutive” definition
methodology, the projectof potential vacancyaconsistent
team considered record to be with the SDG&E
potentially data methodology,
vacant the project team
if it had no active
considered
metering fora six
record to be potentially
consecutive months or vacant
more.if it had no active metering for six consecutive months or more.
Despite the similar definitions for potential vacancy, the analysis of PUD water usage data differs slightly
from thefrom
slightly SDG&Ethe electricity data methodology
SDG&E electricity in that PUD
data methodology didPUD
in that not did
provide water consumption
not provide data, and thus
water consumption
data, and thus the project team was not able to perform an outlier analysis on monthly usage PUD data
the project team was not able to perform an outlier analysis on monthly usage amounts. Rather,
provided aRather,
amounts. recordPUDof a data
binary on/off condition
provided ofathe
a record of property’s
binary on/off water meter.
condition of the property’s water
meter.
A cursory field review using Google Streetview of approximately 25 percent of the roughly 60 extreme-
duration
A cursoryrecords (those
field review withGoogle
using 50 or more monthsofofapproximately
Streetview no active water 25meters)
percentyielded a number
of the roughly 60 of vacant
properties, but appeared
extreme-duration recordsto also include
(those with 50 vacant
or morelots whereofnononew
months development
active hasyielded
water meters) yet occurred. Conducting
a number
a field
of review
vacant of all 33,848
properties, records PUD
but appeared provided
to also includewas beyond
vacant lots the scope
where of this
no new study.
development has yet
occurred. Conducting a field review of all 33,848 records PUD provided was beyond the scope of this
study.
Diagram of PUD data methodology
10
Residential Vacancies in the City of San Diego 12LITERATURE REVIEW
The project team reviewed nine residential vacancy studies performed in the following eight jurisdictions to
help inform the analysis performed in this study:
1. Vancouver, British Columbia
2. Toronto, Ontario
3. Washington, D.C.
4. Oakland, California
5. Los Angeles, California – Study 1
6. Los Angeles, California – Study 2
7. San Francisco, California
8. Richmond, California
9. Melbourne, Australia
A summary for each study is provided below and formatted as a table in the Appendix. Each summary
includes the study author, year, definition of vacant, dataset(s) used, brief methodology overview, and the
source. Note: Washington, D.C., and Richmond, California, have an existing vacancy tax, or are proposing a
vacancy tax, but did not perform a formal vacancy study.
Vancouver, British Columbia
Author:
Ecotagious
Year:
2016
Definition of vacant:
A unit that was unoccupied for 25 or more days within the non-heating months of August and September,
then the following June and July.
Dataset(s) used:
BC Hydro electricity consumption data from CY 2002-2014
Methodology overview:
Occupancy was analyzed separately in periods of 2 months, 4 months, and 12 months. Twelve months was
ultimately used for the analysis. The first year of electricity data was removed for each home in the City of
Vancouver data to account for distortion of newly built homes.
The data were displayed using Vancouver’s five geographic sectors and split into the following three major
housing types:
1. Apartments
2. Rowhouses
3. Single-Family Dwellings and Duplexes
Findings:
The City of Vancouver had a vacancy rate of 4.8 percent in 2014 across all housing units.
Residential Vacancies in the City of San Diego 13Source:
https://council.vancouver.ca/20160308/documents/rr1EcotagiousReport.pdf
Toronto, Ontario
Author:
Deputy City Manager & Chief Financial Officer
Year:
2017
Definition of vacant:
Vacancy was not defined in the initial 2017 report. The initial report drafted by the Deputy City Manager and
Chief Financial Officer in 2017 compared hydro (electricity) and water consumption data and building permit
data, but did not define how vacancy was determined from the data. The definition of how a home is deemed
vacant will be part of the tax development process. City staff are expected to report back to Council in late
2021.
Dataset(s) used:
Hydro and water consumption data
Building permit data
Methodology overview:
n/a
Findings:
n/a
Source:
https://www.toronto.ca/legdocs/mmis/2017/ex/bgrd/backgroundfile-104734.pdf
Additional resources:
https://www.toronto.ca/news/city-council-approves-an-implementation-plan-for-a-tax-on-vacant-homes-in-
toronto/
https://www.toronto.ca/wp-content/uploads/2017/10/969d-PRESENTATION-Implementing-a-Vacant-Home-
Tax-In-Toronto-Aug22.pdf
https://www.toronto.ca/legdocs/mmis/2018/ex/bgrd/backgroundfile-113808.pdf
Washington, D.C.
Author:
n/a
Year:
n/a
Residential Vacancies in the City of San Diego 14Definition of vacant:
When a building becomes vacant and the owner is not actively seeking to rent or sell the building, or the
building is not underdoing active construction or subject to probate or litigation, or pending application for
development.
Dataset(s) used:
The current Washington, D.C., vacant tax program is a self-regulating system that requires owners to register
a vacant building with the Mayor within 30 days of the unit becoming vacant. Vacant properties are taxed at
varying rates. Class 3 properties, vacant commercial and resident properties, are taxed at $5.00 per $100 of
assessed value. Class 4, blighted properties, are taxed at $10.00 per $100 of assessed value. “
Methodology overview:
n/a
Findings:
n/a
Source:
http://dccode.elaws.us/code?no=42-3131.06
https://dcra.dc.gov/node/514292
https://otr.cfo.dc.gov/page/otr-vacant-real-property
Additional resources:
https://www.bizjournals.com/washington/stories/2003/01/13/newscolumn2.html
https://d3n8a8pro7vhmx.cloudfront.net/silverman/pages/57/attachments/original/1454440578/Vacant_
Property_Enforcement_Amendment_Act_of_2016.pdf?1454440578
Oakland-Hayward-Berkeley, California
Author:
U.S. Department of Housing and Urban Development (HUD)
Year:
2017
Definition of vacant:
A housing unit is vacant if no one is living in it at the time of the Census interview, unless its occupants are
only temporarily absent. A unit is considered occupied if it is the occupant’s primary residence.
Dataset(s) used:
U.S. Census Bureau
Methodology overview:
The Census Bureau collects data by surveying respondents directly and from additional federal, state and
local government data. The census defines vacancy in two housing markets, the sales housing market and
the rental housing market. The analysis performed for the Oakland-Hayward-Berkeley Housing Market Area
compared vacancy of sales market and rental market, as well as expected demand and homes currently under
construction.
Residential Vacancies in the City of San Diego 15Findings:
The sales housing market had an estimated sales vacancy rate of 0.6 percent. The overall apartment vacancy
rate was 2.7 percent.
Source:
https://www.huduser.gov/portal/publications/pdf/OaklandCA-comp-17.pdf
Additional sources:
https://www.oaklandca.gov/news/2019/measure-w-outreach-and-civic-engagement-forums#:~:text=On%20
November%206%2C%202018%2C%20Oakland,a%20margin%20of%2070.04%20percent
Los Angeles, California – Study 1
Author: Strategic Actions for a Just Economy, Anti Eviction Mapping Project, and UCLA Community Economic
Development Law Clinic
Year: 2020
Definition of vacant:
A housing unit is vacant if no one is living in it at the time of the American Community Survey (ACS) Census
interview.
Dataset(s) used:
2017 ACS 5-year estimates
2017 Individual Public Use Microdata Statistics (IPUMS)
Los Angeles County Assessor Data
Methodology overview:
Researchers performed a geographic information system (GIS) analysis of ACS vacancy data by census tract
then analyzed the LA County Assessors data to identify the percentage of units and vacant lots owned by
corporate entities/non-individual owners and private owners. Researchers performed a correlation analysis of
the number of ACS vacant buildings survey and the monthly cost of rent. The same correlation analysis was
performed for structures built before 1980 and structures built in 1980 or later. These analyses were performed
to understand correlation of vacancy and the increasing high-end housing production occurring in Los
Angeles. In addition, Ellis Act filling data was compared to census tract vacancy rate.
Findings:
Researchers found the higher the unit rent, the more likely the unit is vacant. These findings indicate a relative
oversupply of high-rent housing and an undersupply of low-rent housing. The report determined 93,500
housing units were vacant in 2017. The report did not include the total number of housing units studied to
calculate the percent vacant.
Source:
https://www.saje.net/wp-content/uploads/2020/09/The_Vacancy_Report_Final.pdf
Residential Vacancies in the City of San Diego 16Los Angeles, California – Study 2
Author:
Los Angeles Housing + Community Investment Department
Year:
2020
Definition of vacant:
Vacancy is defined differently across each dataset used.
• American Community Survey (ACS) a housing unit as vacant if no one is living in the unit at the time of
the ACS census interview;
• United States Postal Service (USPS) defines a unit as vacant if the mail has not been collected by the
address in 90 days;
• Los Angeles Department of Water and Power (LADWP) defines vacant as a house that is not receiving
electricity service;
• CoStar (a market research company) defines a unit as vacant when the rental unit is not occupied by a
tenant regardless of any lease obligation.
Dataset(s) used:
• ACS
• USPS
• LADWP
• CoStar
Methodology overview:
The following study included a spatial analysis and quantitative analysis. The spatial component compared
total vacant units, according to LADWP and ACS data, using the census tract geographies within the City
of Los Angeles’ 15 Council Districts. Then CoStar data was used to perform an analysis of vacancy rates by
CoStar’s 5-star rating scale. The scale is determined by properties’ amenities, quality, and design.
Findings:
The study estimates a citywide vacancy rate between 6 percent and 7 percent (85,000 - 100,000 units).
Source:
http://clkrep.lacity.org/onlinedocs/2019/19-0623_rpt_HCI_06-12-2020.pdf
San Francisco, California
Author:
Paige Dow
Year:
2018
Residential Vacancies in the City of San Diego 17Definition of vacant:
Gross vacancy rate is calculated based on the number of vacant units divided by the total number of housing
units. It captures all vacant units, including those owned or rented but not occupied for a variety of reasons. A
unit is determined vacant by site visit. For a unit to be classified as vacant by the ACS staff, it must meet certain
conditions. The unit must be considered habitable. If the unit is newly constructed but not yet occupied, there
must be floors and windows for it to be considered a vacant unit. The unit must be intended for residential
use; a vacant commercial unit would not be counted as a vacant housing unit. If a housing unit meets these
conditions, and its occupancy is determined to be vacant, then ACS staff conduct a “vacant interview” with an
informed respondent such as a neighbor, property manager, real estate agent, or other informants to gather
information about the unit and why it might not be occupied. Through this method, the unit is placed into one
of the six vacancy categories: For Rent; For Sale; Rented or Sold, Not Yet Occupied; For Seasonal, Recreational,
or Occasional Use; For Migratory Workers; and Other Vacant.
Dataset(s) used:
Primary data: Census, ACS, and Public Use Microdata (PUMs)
Secondary data: For-profit Single-Room Occupancies (SROs), Airbnb listing data, and Department of Building
Inspections permit data
Methodology overview:
ACS and Census data were used to conduct initial analysis on geographic concentration on vacancy,
characteristics of vacant units, and trends in vacancy over time. For-profit SRO address data was geocoded
and mapped in relation to vacant units. The SRO data also included the number of vacant residential units in
all of the for-profit SROs in 2015. Airbnb data provided by the Office of Short-Term Rentals provided insight
into how many units were full-time, entire-unit Airbnb rentals, and where those units were concentrated in the
City. Permit data from the Department of Building Inspections provided a method to look at increases in major
renovations to the housing stock that may be causing entire units to be vacant in the City by using permit cost
as a proxy for whether or not a renovation is a “major” renovation.
Findings:
Approximately 8.6 percent or 33,000 units were vacant at the time of the ACS estimate in 2015.
Source:
https://ternercenter.berkeley.edu/wp-content/uploads/pdfs/CR_Final_2.3.19.pdf
Richmond, California
Author:
Mayor Tom Butt
Year:
2018
Definition of vacant:
A property is classified as vacant if it is in use fewer than 50 days during a calendar year. This includes
undeveloped private property, vacant commercial and industrial buildings, and vacant residential units.
Residential Vacancies in the City of San Diego 18Dataset(s) used:
Mayoral Staff provided estimates, but did not provided information on the vacancy data.
Methodology overview:
n/a
Source:
http://www.tombutt.com/forum/2018/18-8-3.html#_ftnref1
Findings:
Mayoral staff estimate between 980 and 1,180 vacant parcels are in Richmond and 250 vacant structures, most
of which are abandoned residences. This memo did not include total number of units studied.
Melbourne, Australia
Author:
Prosper Australia
Year:
2013
Definition of vacant:
A unit was considered vacant if it used fewer than 50 liters of water per day averaged over a 12-month period.
Dataset(s) used:
Water consumption data from CY2012.
Methodology overview:
Water consumption data for residential and commercial units were sourced from Melbourne’s six water
retailers. Average water consumption of households was calculated from quarterly meter readings in a one-
year period. The residential daily per capita water consumption in Melbourne in 2012-13 was 161 liters per day
(LpD). As such, a unit was considered vacant if it used fewer than 50 liters of water per day on average over a
12-month period.
Findings:
Approximately 4.4 percent of residential properties were potentially unused in 2013.
Source:
http://www.prosper.org.au/wp-content/uploads/2013/11/Prosper%20SVMR_2013_final.pdf
Residential Vacancies in the City of San Diego 19Appendix Residential Vacancies in the City of San Diego 20
Community Electricity Consumption Analysis Results (2 Standard Deviations)

Residential Vacancies in the City of San Diego                                        21
Community Electricity Consumption Analysis Results (3 Standard Deviations)

Residential Vacancies in the City of San Diego                                        22
Community Water Meter Analysis Results

Residential Vacancies in the City of San Diego    23
Council Electricity Consumption Analysis Results (2 Standard Deviations)

Residential Vacancies in the City of San Diego                                      24
Council Electricity Consumption Analysis Results (3 Standard Deviations)

Residential Vacancies in the City of San Diego                                      25
Council Water Meter Analysis Results

Residential Vacancies in the City of San Diego   26
Hexbin Electricity Consumption Analysis Results (2 Standard Deviations)

Residential Vacancies in the City of San Diego                                     27
Hexbin Electricity Consumption Analysis Results (3 Standard Deviations)

Residential Vacancies in the City of San Diego                                     28
Hexbin Water Meter Analysis Results

Residential Vacancies in the City of San Diego   29
SD H C V ac an c y St u d y: P rel i m i n ary Met h o d o l o g y R esearc h fo r G I S Li t erat u re R evi ew
V an c o u ver, CAN To ro n t o , CAN W ash i n g t o n D .C. Oak l an d -H ayw ard -B erk el ey, CA Lo s An g el es, CA - St u d y 1 Lo s An g el es, CA - St u d y 2 San Fran c i sc o , CA R i c h m o n d , CA Mel b o u rn e, AU S
Y ear o f St u d y 2016 2017 n/a 2017 2020 2020 2018 2018 2013
Ecotagious Deputy City Manager & Chief Financial n/a U.S. Department of Housing and Urban Strategic Actions for a Just Economy, Anti Los Angeles Housing + Community Paige Dow Mayor Butt Prosper Australia
Officer Development (HUD) Eviction Mapping Project, and UCLA Investment Department
Au t h o r(s)
Community Economic Development Law
Clinic
When a unit was unoccupied for 25 or n/a; Vacancy was not defined in the When a building becomes vacant and A housing unit is vacant if no one is A housing unit is vacant if no one is Vacancy is defined differently across Gross vacancy rate is calculated A property is classified as vacant if it is in A unit was considered vacant if it used
more days within the non-heating initial 2017 report and will defined the owner is not actively seeking rent or living in it at the time of Census living in it at the time of the interview each dataset used. based on the number of vacant units use less than 50 days during a calendar less than 50 liters of water per day
months of August and September, then during the tax development process. selling the building, or the building is interview, unless its occupants are only and if the occupant has plans to stay in divided by the total number of year. This includes undeveloped private averaged over a 12-month period.
the following June and July. City staff are expected to report back to not underdoing active construction or temporarily absent. A unit is considered the unity for two or more months. (ACS housing units. A unit is determined property, vacant commercial and
Council in late 2021 with an proposed subject to probate or litigation, or occupied if it is the occupant's primary definition). vacant by site visit. For a unit to be industrial buildings, and vacant
Residential Vacancies in the City of San Diego
D efi n i t i o n o f vacancy tax update. The initial report pending application for development. residence. classified as vacant by the ACS staff, it residential units.
V ac an t drafted by the Deputy City Manager & must meet certain conditions.
Chief Financial Officer in 2017 compared
hydro (electricity) and water
consumption data and building permit
data, but did define how vacancy was
determined from the data.
BC Hydro electricity consumption data Hydro and water consumption data + n/a; but vacant tax program is a self- U.S. Census Bureau 2017 ACS 5-year estimates; 2017 ACS, USPS, LADWP, and CoStar Mayoral Staff provided estimates, but Water consumption data from 2012
from 2002-2014 Building permit data regulating system that requires owners Individual Public Use Microdata Statistics did not provided information on the
D at aset (s) U sed Determined?
to submit application within 30 days of (IPUMS); Los Angeles County Assessor vacancy data.
the unit becoming vacant. Data
Occupancy was analyzed separately in n/a n/a The Census Bureau collects data from Researchers performed a GIS analysis of The following study included a spatial ACS and Census data were used to n/a Water consumption data for resident
periods of 2 months, 4 months, and 12 surveying respondents directly and ACS vacancy data by census tract then analysis and quantitative analysis. The conduct initial analysis on geographic and commercial units was sourced from
months. Twelve months was ultimately from additional federal, state, and local analyzed the LA County Assessors data spatial component compared total concentration on vacancy, characteristics Melbourne’s six water retailers. Average
used for the analysis. The data was governments data. The census defines to identify the percent of units and vacant units, according to LADWP and of vacant units, and trends in vacancy water consumption of households was
displayed using Vancouver’s five vacancy into two housing markets, the vacant lots owned by corporate ACS data, using the census tracts over time. For-profit SRO address data calculated from quarterly meter readings
geographic sectors and split into the sales housing market and the rental entities/non-individual owners and geographies within the City of Los was geocoded and mapped in relation in a year period. The residential daily per
following three major housing types: housing market. The analysis performed private owners. Researchers performed a Angeles’ 15 Council Districts. Then to vacant units. The SRO data also capita water consumption in Melbourne
(1)Apartments, (2) Rowhouses, and (3) for the Oakland-Hayward-Berkeley correlation analysis of the number of CoStar data was used to perform an included the number of vacant in 2012-13 was 161LpD. As such, a unit
Single Family Dwellings and Duplexes. Housing Market Area compared vacancy ACS vacant buildings survey and the analysis of vacancy rates by CoStar’s 5- residential units in all of the for-profit was considered vacant if it used fewer
of sales market and rental market, as well monthly cost of rent. The same star rating scale. The scale is determined SROs in 2015. Airbnb data provided by than 50 liters of water per day on
Met h o d o l o g y as expected demand and homes correlation analysis was performed for by properties amenities, quality, and the Office of Short-Term Rentals provide average over a 12-month period.
Overvi ew currently under construction. structures built in 1980 or later and design. insight into how many units are full-
structures built before 1980. These time, entire-unit Airbnb rentals, and
analyses were performed to understand where those units are concentrated in
correlation of vacancy and the the City. Permit data from the
increasing high-end housing Department of Building Inspections
production occurring in Los Angeles. In provided a method to look at increases
addition, Ellis Act filling data was in major renovations to the housing
compared to census tract vacancy rate. stock that may be causing entire units to
be vacant in the City by using permit
cost as a proxy for whether or not a
renovation is a “major” renovation.
The City of Vancouver had a vacancy n/a n/a The sales housing market had an Researchers found the higher the unit The study estimates a citywide vacancy Approximately 8.6 percent or 33,000 Mayoral Staff estimate between 980 and Approximately 4.4% of residential
rate of 4.8% in 2014 across all housing estimated sales vacancy rate of 0.6 rent, the more likely the unit is vacant. rate between 6% to 7% (85,000 - 100,000 units were vacant at the time of the ACS 1,180 vacant parcels in Richmond and properties were potentially unused.
units. percent. The overall apartment vacancy 93,500 housing units were vacant in units). estimate in 2015. 250 vacant structures, most of which are
Fi n d i n g s
rate was 2.7 percent. 2017. Report did not include total abandoned residences. This memo did
number of housing units studied to not include total number of units
calculate percent vacant. studied.
So u rc e Link Link Link to DC Official Code § 42-3131.06 Link Link Link Link Link to Memo from Mayor Tom Butt Link
The first year of electricity data was Initial report was drafted in 2017, though Department of Consumer and Report lead to Measure W (2018) a tax
removed for each home in the CoV data determining how a home is deemed Regulatory Affairs Vacancy authorization to impose vacant property
to account for distortion of newly built vacant will be part of the tax Determination tax beginning July 1, 2020
N o t es
homes. development process. City staff
expected to report back to Council in late
2021.
30SDHC Vacancy Study: Preliminary Research on Cities with a Vacancy Tax
Richmond (Contra Costa,
Vancouver, CAN Toronto, CAN Washington, D.C. Oakland, CA Los Angeles, CA San Francisco, CA Melbourne, AUS
CA)
The Vancouver Empty
2021 vacant residential
Homes Tax has been used A Vacancy Tax should be Was on the 2018 ballot
Washington, D.C. has land tax has been waived
as a model for most of the on the ballot i n 2022, thi s but did not receive
Tax was passed by Toronto di fferent tax "classes" so San Franci sco's vacancy as part of the Vi ctori an
other cities adopting, or was ori gi nally set to be on enough votes- looking to
Ci ty Counci l Dec 2020, Tax what we consi der a Oakland's Vacancy Tax was tax only appli es to retai l Government's coronavirus
considering, a vacancy the 2020 ballot but the LA potentially try again in
Summary development wi ll take vacancy class i s the tax on approved by voters in properties and has been reli ef measures, thi s was
tax. Their definitions and city council didn't think 2022 although a recent
place in 2021 and should class 3 and 4. They do not 2018, delayed to 2022 due to passed in 2018 and the
tax structure are echoed the program was detailed presentation to their city
take effect in 2022. have a separate account the pandemic. major di fference i n thei r
throughout most enough and pushed it to council said it may not
for these funds. model i s they use a "self
programs we were able to 2022. pass agai n.
identification method"
find in North America.
A condominium, duplex,
Properti es are consi dered or townhouse residential
vacant i f they have not unit under separate
4 di fferent classes of been li ved i n for at least 6 ownership that is in active
Proposed: A minimum 6-
Unoccupied for more than properti es. Class 3 & 4 It i s i n use less than fi fty months (collectively) of use less than 50 days
month occupancy period Empty for more than six
Vacancy Definition: six months during the tax (defi ned below) are (50) days during a calendar TBD the preceding calendar during a calendar year. A
within a 12-month months
year (Jan 1 – Dec 31). included in the vacancy year year. The occupation does developed/ undeveloped
calendar reference year
tax. not need to be by the same parcel of land that i s i n
occupant or for a si ngle acti ve use less than 50
continuous period. days during a calendar
year.
Vacant Developed/
Vacant/ Blighted property Vacant Property
Vacant Resi denti al Vacant Resi denti al Vacant Resi denti al Rental Undeveloped Parcels
Tax applies to: (both residential and (both residential and Retail Property Residential only
Property Property Property (both residential and
commercial) commercial)
commercial)
The tax imposed by this
chapter shall be at the rate of
$3k annually
per v acant dev eloped parcel;
$6k annually
per v acant undev eloped
$3,000 to $6,000 on parcel; $3k annually
Tax on retai l properti es
The rate of the Empty Class 3, vacant property, i s vacant property per v acant residential unit for
starti ng at $250 per li near
Homes Tax was i ni ti ally 1% TBD, although a 1% of taxed at $5.00 per $100 of (Residential- $6,000, condominiums, duplexes, or
foot of store frontage in
of assessed property value property assessed taxable assessed value and Class 4, Condominium, duplex, or 1% of assessed property townhouse units under
Tax structure: TBD the fi rst year, then
1.25% of assessed value was used as an blighted property, is taxed townhome unit under value separate ownership
doubling to $500 in year
property value as of 2020, example at $10.00 per $100 of separate ownership-
two and peaking at $1,000
now i ncreased to 3% assessed value. $3,000, Undeveloped- The Richmond ordinance
for each year after.
$6,000) states: “Developed parcel”
means all parcels, regardless
of zoning or other land use
designation, upon which
permanent improv ements
hav e been constructed or
placed
Recurrence of Tax: Annually Proposed: Annually Annually Annually Annually Annually Annually Annually
Length of Tax: 20 years TBD No end date stated 20 years TBD Not Stated Not stated 20 years
Vacancy reference
Calendar Year, Calendar Year, Calendar Year, Calendar Year Calendar Year Calendar Year,
period (taxable TBD TBD
Jan- Dec Jan- Dec Jan- Dec Jan-Dec Jan- Dec Jan- Dec
reference period)
Was on the 2018 ballot
but did not receive
Approved by voters in
enough votes- looking to
Nov. 2018
TBD - LA to vote on thi s on delayed until 2022 due to potentially try again in
Year Tax Began: 2017 to begi n i n 2022 2011 (Measure W) January 1, 2018
2022 ballot pandemic 2022 although a recent
presentation to their city
Tax took effect 2019
council said it may not
pass agai n.
The Empty Homes Tax i s Proposition D
Name of Tax (for Fiscal Year 2011 Budget Oakland Vacant Property Vacant Residential Land Speci al Parcel Tax on
also known as the Vacancy TBD TBD San Franci sco Vacant
reference) Support Act of 2010 Tax (“VPT”) Tax Vacant Property
Tax Property Tax
Department of Consumer
and Regulatory Affai rs Only residential property
recei ves complai nts, owners with vacant
Proposed: Universal identifies and processes properti es are requi red to
declarati on – where all the registration of vacant make a declarati on (“self-
The City Council shall
Collector of Taxes must residential property properties by owners, and The City Administrator identification”)
establish, by ordinance, a
revi ew the property status owners are requi red to administers certain fines if may develop methods to Proposed self reporting by
method for determining
declaration and must make property owners do not identify, based on homeowners and Random checks
Enforcement TBD and identifying the use
determine a declarati on – choi ces of regi ster. DCRA also objecti ve, avai lable data, additional monitoring by —Tips and notifications
and vacancy status of each
whether or not the parcel occupied, vacant, vacant inspects properties, properties that are most city. from
parcel of real property i n
is taxable property with exemption; and if no completes an annual li kely to be vacant general public
the City.
declaration is made, the survey of vacant —Audits selected based on
property is deemed vacant properti es, and certi fi es a ri sk assessment and data
li st of vacant i mproved from other state/federal
properti es to Offi ce of tax agenci es
& revenue
Proposed:
City Council budgeted $7
Homelessness services and
million generated from the tax
programs., Other Preserv ation
to be used in the 2020-21
of existing affordable housing
fiscal year to pay for a A separate account the
and production of new
homeless commission, a pilot Vacant Property Tax Fund,
affordable housing. Maintain
Net revenues from the program to create self- for the funding of
Proposed: funds will be and clean-up blighted Introduced this tax to help
Empty Homes Tax wi ll be Thi s i s not a separate governed homeless programs and services for
Funding Information: applied to the creation of properties. To create a TBD address the lack of housing
reinvested into affordable affordable housing fund. encampments, grants for homeless people, to
affordable housing Commission on Homelessness supply in Victoria.
housing initiatives. housing accessibility reduce homelessness, and
that make funding decisions,
improv ements, a mobile to support the provision
as established by the v oter
homeless outreach team, of affordable housing
approv ed measure.
surv eillance cameras to catch
Administrativ e costs
illegal dumping and crews to
associated with tax.
pick up dumped trash.
Prior to implementation it was
forecasted to generate
approximately A$80 million
(C$72 million) ov er the first
four years —Media outlets
The Vancouver program have reported revenues as
Not yet implemented, this Si nce thi s i s a part of thei r In 2019, Oakland
seems to be the model for low as A$5.4 million ($C4.9
was approved by the city ti ered property tax system approved a long li st of
most of the other million) in the first year Thi s i s i n di scussi ons to be
counci l i n Dec 2020, they there wasn't much exemptions for property Los Angeles i s set to vote Vote delayed until 2022
Program Progress: programs, I have linked a 2021 v acant residential land on the ballot again in
are formulating the tax information or owners, which some say on this in 2022. due to pandemic
report from Vancouver on tax has been waiv ed as part of 2022
structure this year and it controversy about this eased the tax too much to
the progress of thei r the Victorian Gov ernment's
should take effect i n 2022 program. be effecti ve.
program. coronav irus relief measures
but you must still notify us if
your eligible Melbourne
residential property was
v acant for more than six
months in 2020.
Link Link Link Link Link Link Link Link
Their report does mention
COVID19 i f we wanted to Measure W was passed by
Notes: see how they addressed voters in 2018
Report
that.
Residential Vacancies in the City of San Diego 31You can also read