Response of downstream lakes to Aru glacier collapses on the western Tibetan Plateau
←
→
Page content transcription
If your browser does not render page correctly, please read the page content below
The Cryosphere, 15, 199–214, 2021
https://doi.org/10.5194/tc-15-199-2021
© Author(s) 2021. This work is distributed under
the Creative Commons Attribution 4.0 License.

Response of downstream lakes to Aru glacier collapses
on the western Tibetan Plateau
Yanbin Lei1,2 , Tandong Yao1,2 , Lide Tian2,3 , Yongwei Sheng4 , Lazhu5 , Jingjuan Liao6 , Huabiao Zhao1,2,10 ,
Wei Yang1,2 , Kun Yang2,7 , Etienne Berthier8 , Fanny Brun9 , Yang Gao1,2 , Meilin Zhu1 , and Guangjian Wu1,2
1 Key  Laboratory of Tibetan Environment Changes and Land Surface Processes, Institute of Tibetan Plateau Research,
Chinese Academy of Sciences, Beijing 100101, China
2 CAS Center for Excellence in Tibetan Plateau Earth System Sciences, Beijing, 100101, China
3 Institute of International Rivers and Eco-security, Yunnan University, Kunming, China
4 Department of Geography, University of California, Los Angeles (UCLA), Los Angeles, CA 90095–1524, USA
5 National Tibetan Plateau Data Center, Institute of Tibetan Plateau Research,

Chinese Academy of Sciences, Beijing 100101, China
6 Key Laboratory of Digital Earth Science, Institute of Remote Sensing and Digital Earth,

Chinese Academy of Sciences, Beijing 100094, China
7 Department of Earth System Science, Tsinghua University, Beijing 10084, China
8 LEGOS, CNES, CNRS, IRD, UPS, Université de Toulouse, Toulouse, France
9 Université Grenoble Alpes, CNRS, IRD, Grenoble INP, IGE, 38000 Grenoble, France
10 Ngari Station for Desert Environment Observation and Research, Institute of Tibetan Plateau Research,

Chinese Academy of Sciences, Beijing 100101, China

Correspondence: Yanbin Lei (leiyb@itpcas.ac.cn)

Received: 26 April 2020 – Discussion started: 16 June 2020
Revised: 10 November 2020 – Accepted: 12 November 2020 – Published: 14 January 2021

Abstract. The lower parts of two glaciers in the Aru range       first 2 weeks after the first glacier collapse. Due to the large
on the western Tibetan Plateau (TP) collapsed on 17 July         amount of meltwater input, Memar Co exhibited more rapid
and 21 September 2016, respectively, causing fatal damage        expansion after the glacier collapses (2016–2019) than be-
to local people and their livestock. The giant ice avalanches,   fore (2003–2014), in particular during the warm season. The
with a total volume of 150 × 106 m3 , had almost melted by       melting of ice avalanches was found to contribute to about
September 2019 (about 30 % of the second ice avalanche           23 % of the increase in lake storage between 2016 and 2019.
remained). The impact of these extreme disasters on down-        Our results indicate that the Aru glacier collapses had both
stream lakes has not been investigated yet. Based on in situ     short-term and long-term impacts on the downstream lakes
observation, bathymetry survey and satellite data, we explore    and provide a baseline in understanding the future lake re-
the impact of the ice avalanches on the two downstream           sponse to glacier melting on the TP under a warming climate.
lakes (i.e., Aru Co and Memar Co) in terms of lake mor-
phology, water level and water temperature in the subsequent
4 years (2016–2019). After the first glacier collapse, the ice
avalanche slid into Aru Co along with a large amount of de-      1   Introduction
bris, which generated great impact waves in Aru Co and sig-
nificantly modified the lake’s shoreline and underwater to-      Potential risk of natural hazards in the Third Pole region has
pography. An ice volume of at least 7.1 × 10⁶ m3 was dis-        increased in the last few decades (Cui et al., 2015; Wang et
charged into Aru Co, spread over the lake surface and con-       al., 2018; Cook et al., 2018; Liu et al., 2019). Glaciers in
siderably lowered its surface temperature by 2–4 ◦ C in the      this region have changed heterogeneously due to rapid cli-
                                                                 mate warming and different patterns of precipitation changes

Published by Copernicus Publications on behalf of the European Geosciences Union.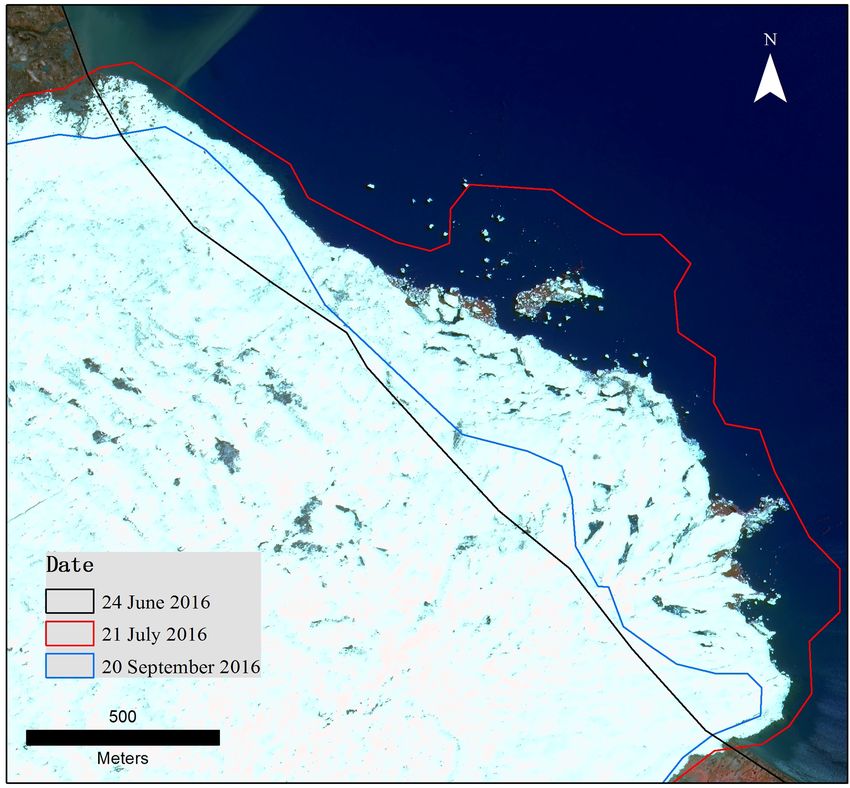
200                                                      Y. Lei et al.: Response of downstream lakes to Aru glacier collapses

(T. Yao et al., 2012). Most glaciers have experienced signif-      of Aru Co, then evaluate the impact of the meltwater on lake
icant negative mass balance, except for the slight mass gain       level changes at Memar Co on seasonal to inter-annual scales
in the Karakoram and western Kunlun Mountains (Kääb et             and finally analyze the impact of the meltwater on lake sur-
al., 2015; Brun et al., 2017; Shean et al., 2020). Due to the      face temperature (LST) at both lakes.
rapid glacier retreat, most glacial lakes expanded rapidly and
many new glacial lakes appeared (Li and Sheng, 2012; Nie
et al., 2017; Shugar et al., 2020), which increased the risk       2   Study area
of glacial lake outburst floods (Cook et al., 2018; Wang et
                                                                   Aru Co and Memar Co, located in an endorheic basin on the
al., 2018). Meanwhile, as a new form of glacier instabil-
                                                                   western TP (Fig. 1), are the two lakes downstream of the
ity, ice avalanches appeared on the western Tibetan Plateau
                                                                   glacier collapses. According to the second Chinese glacier
(TP). The lower parts of two glaciers in the Aru range on
                                                                   inventory (Guo et al., 2015), 105 pieces of glaciers are
the western TP collapsed on 17 July and 21 September 2016
                                                                   located in the basin covering a total area of ∼ 184 km2 .
(i.e., Aru-1 and Aru-2 glacier collapses), leading to fatal
                                                                   Glaciers in this region had been rather stable in the past
damage to local people and livestock (Tian et al., 2017). To-
                                                                   4 decades before the two ice avalanches (Tian et al., 2017;
gether with soft-bed properties of the glaciers, unusually high
                                                                   Zhang et al., 2018). Two adjacent glaciers (Aru-1 and Aru-
water input from melting and precipitation was identified as
                                                                   2) to the west of Aru Co collapsed suddenly on 17 July
one of the main causes of the two glacier collapses (Kääb et
                                                                   and 21 September 2016, respectively, killing nine people
al., 2018; Gilbert et al., 2018).
                                                                   and hundreds of livestock. The Aru-1 ice avalanche reached
   Although the two giant ice avalanches have caused se-
                                                                   Aru Co at high speed after running out 6–7 km beyond the
rious ecological and environmental problems, their impact
                                                                   glacier terminus, generating huge impact waves at Aru Co
on the downstream lakes (i.e., the outflow lake Aru Co and
                                                                   (Kääb et al., 2018). On the Aru-1 glacier collapse fan, the
the terminal lake Memar Co) in the subsequent years has
                                                                   thickness of the fragmented ice mass varied from 3 m at the
not been investigated yet. The two ice avalanches may in-
                                                                   glacier snout to 13 m at the far end of the deposit (Tian et
fluence the downstream lakes in several ways. First of all, a
                                                                   al., 2017). The two ice avalanches covered an area of 9.4 and
large amount of ice slid into Aru Co at high speed and gen-
                                                                   6.7 km2 , and the detached volumes were estimated to be 68
erated huge impact waves (Kääb et al., 2018), which could
                                                                   and 83 × 106 m3 , respectively (Tian et al., 2017; Kääb et al.,
affect shoreline and underwater topography. Secondly, the
                                                                   2018).
melting of the fragmented ice mass, with a total volume of
                                                                      Aru Co and Memar Co are lagoons and share a catchment
∼ 150 × 106 m3 , could supply additional water to the down-
                                                                   area of 2310 km2 . Aru Co is an outflow lake with salinity
stream lakes and affect lake level changes in Memar Co in
                                                                   of 0.56 g L−1 , and Memar Co is the terminal lake of Aru
the subsequent years. Thirdly, the ice avalanches could affect
                                                                   Co with salinity of 6.22 g L−1 . The surface elevation of Aru
lake surface temperature through the spread of ice floes and
                                                                   Co (4937 m a.s.l.) was about 14 m higher than Memar Co
cold-water input. In fact, there are many studies about the im-
                                                                   (4923 m a.s.l.) in 2003, according to ICESat satellite altime-
pact of glacier melting on rapid lake growth on the interior
                                                                   try data (Li et al., 2014). There are dozens of visible paleo-
TP (e.g., Lei et al., 2012; Zhou et al., 2019; Treichler et al.,
                                                                   shorelines around Memar Co. The highest shoreline around
2019). However, the process of glacier meltwater regulating
                                                                   Memar Co is ∼ 40 m above the modern lake level, indicat-
lake water balance is largely unknown due to a lack of in situ
                                                                   ing Aru Co and Memar Co used to be one large lake on a
observation. Therefore, the observation of lake level changes
                                                                   geological timescale.
in the downstream lakes of the Aru glacier collapses not only
                                                                      The climate in this area is cold and dry most of the year.
provides us unique evidence of the impact of a large amount
                                                                   Automatic weather station (AWS) data collected between
of glacier melting on the downstream lakes but also is essen-
                                                                   October 2016 and September 2019 near the glacier collapse
tial to understand the relationship between glacier mass loss
                                                                   (∼ 5000 m a.s.l.) show that mean annual air temperature was
and lake behavior on the TP under a warming climate.
                                                                   −3.6 ◦ C, with the lowest value in January (−14.0 ◦ C) and the
   In September 2016, 2 months after the Aru-1 glacier col-
                                                                   highest value in August (7.2 ◦ C). T-200B rain gauge data in-
lapse and 1 week after the Aru-2 glacier collapse, we con-
                                                                   dicate that mean annual precipitation near the collapse fan
ducted a field campaign and installed instruments to monitor
                                                                   was 333 mm between October 2016 and September 2019,
lake level changes at the two downstream lakes, Aru Co and
                                                                   which is much higher than that at Nagri meteorological sta-
Memar Co (Fig. 1). In July 2017 and October 2018, we fur-
                                                                   tion (Tian et al., 2017). More than 80 % of annual precipita-
ther conducted bathymetry survey at both lakes. Comprehen-
                                                                   tion in this region is concentrated in the warm season from
sive hydro-meteorology monitoring was established in the
                                                                   June to September. Snowfall in the cold season between Oc-
two downstream lakes in October 2018. This study explores
                                                                   tober and May only accounts for 10 %–15 % of the annual
the impact of the two glacier collapses on the downstream
                                                                   precipitation.
lakes in terms of lake morphology, lake level changes and
lake surface temperature. We first investigate the instanta-
neous impact of the Aru-1 ice avalanche on the morphology

The Cryosphere, 15, 199–214, 2021                                                      https://doi.org/10.5194/tc-15-199-2021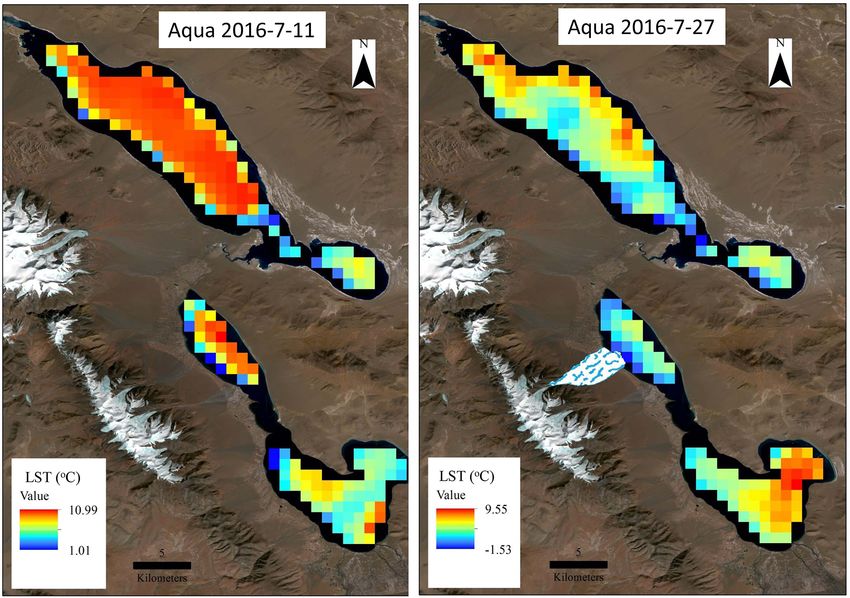
Y. Lei et al.: Response of downstream lakes to Aru glacier collapses 201
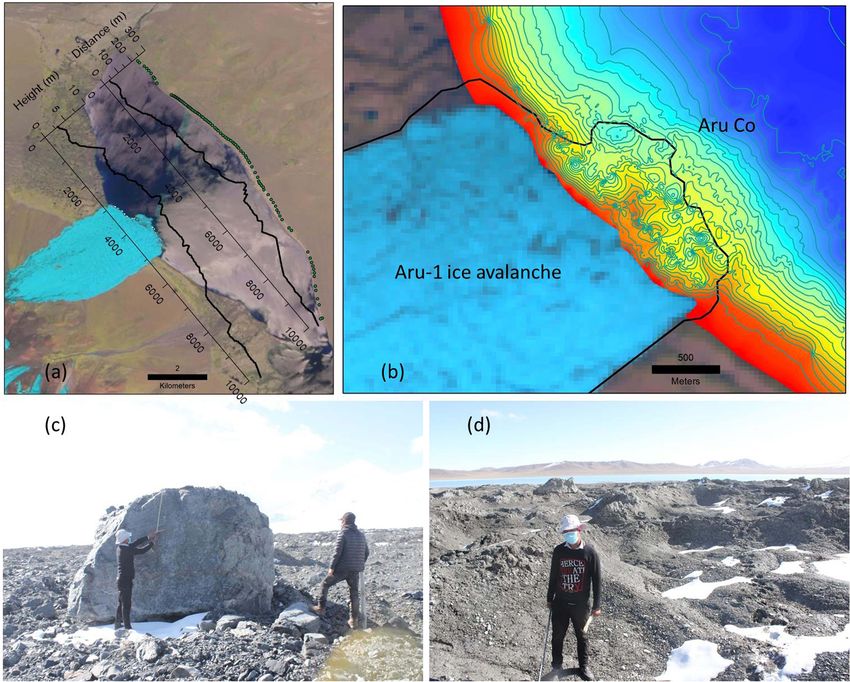
Figure 1. General description of the study area and two glacier collapses. (a) Location and general description of the study area. (b–c) Landsat
satellite images of the two glacier collapses on 20 October 2016 and 23 October 2019. The red dots (a) denote the locations of lake level
monitoring at Aru Co and Memar Co.
3 Methods lake volume is estimated to be ±6 % by comparing the re-
constructed lake level and satellite altimetry between 2004
3.1 Lake bathymetry and 2018.
3.2 Lake water level monitoring
Bathymetric surveys at Aru Co and Memar Co were con-
ducted in July 2017 and October 2018, respectively. Water The lake level at Aru Co and Memar Co has been moni-
depth was determined using a 500 W dual-frequency depth tored since September 2016 using HOBO (U20-001-01) or
sounder interfaced with a Garmin GPSMAP 421s chart plot- Solinst water level loggers, which were installed in the lit-
ter. Latitude, longitude and water depth were recorded at 3 s toral zone of the lake. Because water levels were recorded as
intervals during each bathymetric survey. At Aru Co, a to- changes in pressure (less than 0.5 cm water level equivalent),
tal of 16 100 water depth points were acquired. A detailed air pressure data were subtracted from the level loggers to
bathymetry survey near the first glacier collapse fan was con- obtain pressure changes related to water column variations.
ducted at an interval of 100–200 m at Aru Co. At Memar Co, Daily lake level changes between October 2016 and Septem-
a total of 18 000 water depth points were acquired. The hor- ber 2019 were used in this study at Aru Co. At Memar Co,
izontal position of each point was recorded with an accuracy the lake level is only available from October 2017 to Septem-
of 3 m or better. The lake boundary in July 2017 and Oc- ber 2019 due to the loss of the logger in the first year. Water
tober 2018 was used to calculate lake water storage at Aru depth of the loggers was measured during fieldwork to cali-
Co and Memar Co, respectively. The water depth was inter- brate the logger data.
polated to the whole lake to acquire the lake isobaths, and
then lake volume was calculated in ArcGIS 10.1. The lake 3.3 Satellite observation
water depth of the 1994 shoreline was reconstructed accord-
ing to bathymetry survey and used to calculate the lake iso- Multiple sources of satellite data, including Landsat images,
baths because the lake level in middle to late 1990s was much ICESat and CryoSat-2 satellite altimetry, were explored to
lower than today (Fig. S1 in the Supplement) and Memar Co detect long-term changes in lake extent and water level.
was composed of two lakes at that time. Uncertainty in the Landsat images downloaded from the USGS website (http:
https://doi.org/10.5194/tc-15-199-2021 The Cryosphere, 15, 199–214, 2021
202                                                      Y. Lei et al.: Response of downstream lakes to Aru glacier collapses

//glovis.usgs.gov, last access: July 2019) were used to inves-     3.4   Long-term lake level reconstruction
tigate changes in lake area since the 1970s. A total of 30
satellite images between September and November, 1972 to           The outflow lake Aru Co has been very stable since the
2018, were selected. Before 1990, only two images (1972            1970s, while the terminal lake Memar Co has expanded sig-
and 1976) were available. After 1990, almost annual changes        nificantly since the 2000s. Before 2003, lake level variations
in lake area (no data in 1991, 1995 and 1998) were extracted.      at Memar Co were determined based on the current lake
Lake boundaries were extracted in false-color image by man-        bathymetry and the position of past shorelines, which were
ual delineation using ArcGIS 10.1 software. The accuracy of        derived from Landsat satellite images. Bathymetric survey
manual digitization is controlled within an error of 1 pixel       was used to determine the current water depth over shore-
(30 m).                                                            lines that were previously exposed (Lei et al., 2012). To
   ICESat and CryoSat-2 satellite altimetry data were used to      minimize errors, more than 10 bathymetry transects across
detect lake level changes between 2003 and 2017. ICESat al-        Memar Co were acquired and used to reconstruct past lake
timetry data were processed after Li et al. (2014) and were        level changes. Lake level changes in 1972, 1994, 1999, 2004
used to examine water level variations between 2003 and            and 2014 relative to October 2018 were reconstructed. Here
2009. CryoSat-2 data were processed after Xue et al. (2018)        we assume that lake level changes were constant across the
and were used to investigate water level variations between        lake and that the uncertainty in lake level changes was de-
2010 and 2018. Both lakes were observed by the ICESat              termined as the standard deviation of all the reconstructed
satellite two or three times a year (Phan et al., 2012) and by     lake levels. In this study, the uncertainty in changes in lake
the CryoSat-2 satellite every 2 or 3 months (Kleinherenbrink       level was estimated to be ±0.6 m in the 1970s and ±0.3 m
et al., 2015; Jiang et al., 2017). Notably, the two datasets are   since the 1990s. The relationship between lake area and the
referenced to different ellipsoids and geoid heights. The ICE-     reconstructed lake levels was developed using a second-order
Sat data contain corrected surface ellipsoidal heights refer-      polynomial-regression model. Continual lake level changes
enced to the TOPEX/Poseidon ellipsoid and a geoid height           at Memar Co since 1972 were reconstructed using this rela-
referenced to the Earth Gravitational Model (EGM) 2008,            tionship and the corresponding lake area.
while the CryoSat-2 data are referenced to WGS84 and
EGM96 (Song et al., 2015). At Aru Co, the lowest lake level        3.5   Lake surface temperature derived from MODIS
in May is very stable from year to year as it is controlled by           satellite data
the elevation of the outlet. The ICESat-derived and CryoSat-
2-derived lake surface elevations of Aru Co were averaged to       MODIS 8 d land surface temperature products
be 4936.67 m a.s.l. in April (n = 2) during the period 2003–       (i.e., Terra MOD11A2 and Aqua MYD11A2) were
2009 and 4937.04 m a.s.l. in May (n = 5) during the period         used to investigate changes in lake surface temperature at
2011–2016, respectively. The elevation difference of 0.37 m        Aru Co and Memar Co. On both platforms (Terra and Aqua),
was determined as the bias of the two datasets and used to         two instantaneous observations were collected every day
correct satellite altimetry data.                                  (Terra – approximately 10:30 and 22:30 local time, Aqua
   Dynamics of the two ice avalanche deposits were inves-          – approximately 13:30 and 01:30 local time). The MODIS
tigated through different kinds of satellite images (Sentinel-     8 d data are the averaged lake surface temperature of the
2, Gaofen-2, Landsat 8 OLI, SPOT-7, Pléiades and ASTER             daily MODIS product over 8 d. We used the latest version
DEMs). A Sentinel-2 satellite image on 21 July 2016 (4 d           of MODIS products (V006) in this study. Only nighttime
after the Aru-1 glacier collapse) was acquired to detect the       data were used because there was less cloud cover at night
extent of the intruding ice into Aru Co. A high-resolution         (Zhang et al., 2014; Wan et al., 2018). MOD11A2 and
(∼ 1 m) Gaofen-2 satellite image on 25 July 2016 was ac-           MYD11A2 products are available at a spatial resolution of
quired to detect the ice floes over the surface of Aru Co.         about 1 km with an accuracy of 1 K under clear-sky condi-
The extent of the two ice avalanches was extracted based           tions (Wan, 2013). MODIS lake surface temperature data
on Landsat images between 2016 and 2019 and used to                are pre-processed to account for atmospheric and surface
calculate meltwater every year. Meltwater originating from         emissivity effects. The cloud mask (MOD35) used for inland
the avalanche deposits is constrained using examination of         water provides a surface temperature measurement when
satellite images and differencing of digital elevation mod-        there is a 66 % or greater confidence of clear-sky conditions
els (DEMs). SPOT-7, Pléiades and ASTER DEMs are cal-               (Wan, 2013); otherwise no temperature is produced. To
culated using the Ames Stereo Pipeline (Shean et al., 2016)        reduce the contamination from land pixels, only lake pixels
using processing parameters from recent studies (Berthier          beyond 1 km of the shoreline were extracted (Ke and Song,
and Brun, 2019; Dussaillant et al., 2019; Miles et al.,            2014). At Aru Co, lake surface temperature in the southern
2018). DEMs are coregistered using the method described            and northern (closer to the ice avalanches) halves of the lake
in Berthier et al. (2007).                                         was extracted to investigate its spatial difference (Fig. 2). At
                                                                   Memar Co, lake surface temperature in the northern half of
                                                                   the lake was extracted. Anomalous lake surface temperature

The Cryosphere, 15, 199–214, 2021                                                       https://doi.org/10.5194/tc-15-199-2021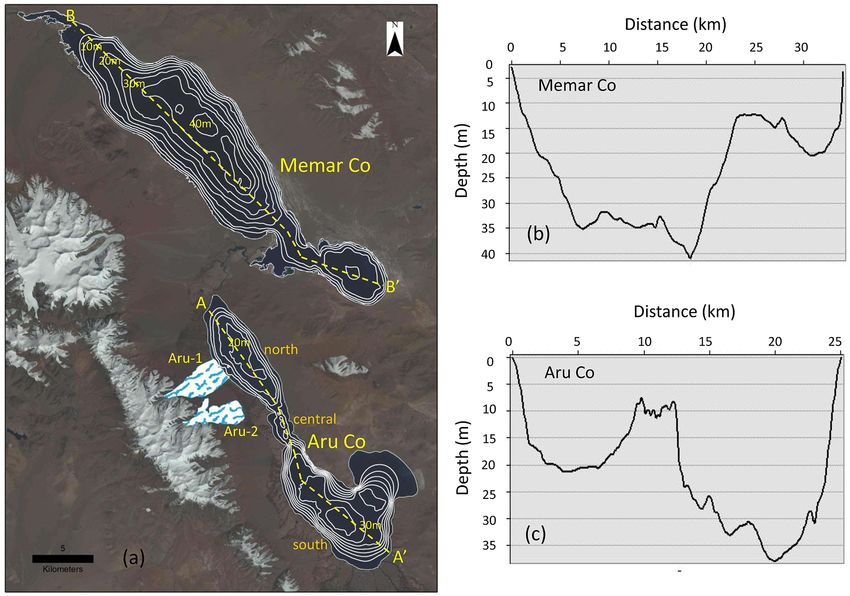
Y. Lei et al.: Response of downstream lakes to Aru glacier collapses                                                        203

was examined and removed if there was a big difference              The bathymetry survey in July 2017 showed that water
between MOD11A2 and MYD11A2 datasets. To confirm                 depth at the east margin of the intruding ice was about 8 m.
the reliability of MODIS products, nighttime lake surface        Because the intruding ice was obviously higher than the lake
temperature was compared with in situ observation at the         surface, 8 m is a lower bound for the ice thickness. There-
shoreline.                                                       fore, the volume of ice mass entering Aru Co is estimated to
                                                                 be at least 7.1 × 10⁶ m3 , accounting for ∼ 10 % of the total
                                                                 ice volume of the Aru-1 glacier collapse. Due to the influ-
4     Results                                                    ence of lake water, the intruding ice melted quickly in less
                                                                 than 2 months as observed by Landsat satellite image on
4.1    Bathymetry survey at Aru Co and Memar Co
                                                                 20 September 2016 (Fig. 4).
Aru Co has a surface area of ∼ 105 km2 with a length of             Detailed bathymetry survey at Aru Co showed that the
27 km and a width of 1.4 to 9 km. Observation from satellite     underwater topography near the Aru-1 ice avalanche was
images shows that Aru Co is composed of two sub-basins.          largely modified due to a large amount of debris input along
The northern basin accounts for less than 30 % of the total      with the fragmented ice mass. Figure 3b shows that the
lake area with a maximum water depth of 20 m. The south-         bathymetry near the ice avalanche became uneven, in con-
ern basin is the main body of Aru Co, with a maximum water       trast to the adjacent areas. The uneven underwater topogra-
depth of 35 m (Fig. 2). The central part of Aru Co is narrow     phy indicated that a large amount of debris was transported
and shallow, with a width of ∼ 1.5 km and a maximum wa-          into Aru Co or the lake bed was significantly eroded. The ex-
ter depth of ∼ 11 m. The entire Aru Co has an average water      tent of the uneven lake bathymetry was slightly larger than
depth of 17.6 ± 1.0 m and total water storage of 1.8 ± 0.1 Gt.   that of the intruding ice on 21 July 2016 (Fig. 3b), indicating
   Memar Co had a surface area of 177 km2 in 2018 with a         that part of the intruding ice had spread over the surface of
length of 36 km and a width of 2 to 7 km. Similar to Aru Co,     Aru Co or melted in 4 d after the glacier collapse. The lake
Memar Co is also composed of two sub-basins. The north-          bottom stayed unchanged (i.e., smooth) in areas deeper than
ern part is the main water body of the lake with a maxi-         15 m or far from the glacier collapse fan.
mum depth of 42.6 m. The southern part accounts for less            An investigation of the Aru-1 ice avalanche fan in Octo-
than 20 % of total lake area, with a maximum water depth of      ber 2019 gave further evidence of debris input into Aru Co.
20.5 m (Fig. 2). The south-central part of Memar Co is nar-      A clear deposit with a thickness of 0.2–1.0 m was left after
row and shallow, with a width of 2–3 km and a maximum            the fragmented ice mass had completely melted. The orig-
depth of ∼ 12.5 m. Satellite images show that the southern       inal road was no longer accessible because of a thick de-
and northern parts were separated in the 1990s when the lake     bris cover. Boulders with a diameter of 1–2 m were found
level was lower than today (Fig. S1). The two parts have been    even near the shoreline (Fig. 3c). The uneven land surface
connected again since 2000 due to the rapid lake expansion.      may explain how the lake bottom became uneven. Fieldwork
According to lake bathymetry in October 2018, Memar Co           also showed that Aru Co’s shoreline near the northern and
has an average water depth of 20.0 ± 1.2 m and has a total       southern sides of the ice avalanche moved offshore by about
water storage of 3.5 ± 0.2 Gt, about twice as large as that of   100–120 m, which was probably due to the deposit of debris
Aru Co.                                                          transported by glacier collapse and afterwards by meltwater.

4.2    Instantaneous impact of the Aru-1 glacier collapse        4.3   Estimation of meltwater from the two ice
       on the Aru Co morphology                                        avalanches

The Aru-1 glacier collapse ran into Aru Co at high speed         According to the areas and volumes reported by Kääb et
after running out 6–7 km beyond the glacier terminus (Tian       al. (2018), the average thicknesses of Aru-1 and Aru-2 ice
et al., 2017; Kääb et al., 2018). A Sentinel-2 satellite im-     avalanche deposits in October 2016 were 7.6 and 15.2 m,
age acquired on 21 July 2016 (4 d after the collapse) showed     respectively. The contrasting thicknesses of the fragmented
that the ice avalanche ran into Aru Co as far as ∼ 800 m and     ice masses led to different durations of their melting. The
the intruding ice had an area of ∼ 0.89 km2 with a width of      Aru-1 glacier collapse had almost melted in two summers
∼ 2250 m and an average length of 400 m. The intruding ice       as indicated by satellite images in October 2017 (only some
generated great waves in northern Aru Co due to its high         scattered ice mass remained). The elevation difference de-
speed and large volume, which inundated the opposite shore       rived from a pre-collapse SPOT-7 DEM (25 November 2015)
of Aru Co (Kääb et al., 2018). Fieldwork in October 2016         and a Pléiades DEM (28 August 2018) indicates an elevation
showed that there was a clear footprint of wave erosion at       change of almost zero (−0.10 ± 0.50 m) over the area of the
the opposite shore of northern Aru Co, which extended up         Aru-1 avalanche deposit, so the entire ice mass melted away
to 240 m inland and 9 m above the lake level along a 10 km       by August 2018 (Fig. S2). The melting of the Aru-2 glacier
section of the shoreline (Fig. 3a).                              collapse lasted longer due to its larger thickness. In Octo-
                                                                 ber 2019, the fragmented ice had an area of about 1.9 km2 ,

https://doi.org/10.5194/tc-15-199-2021                                                   The Cryosphere, 15, 199–214, 2021
204                                                       Y. Lei et al.: Response of downstream lakes to Aru glacier collapses

Figure 2. The 5 m interval isobaths (a) and the water depth profiles (b, c) in a NW–SE direction (the dashed yellow lines) at Aru Co and
Memar Co. Landsat satellite image (a) is used to indicate the location of the lakes and glacier collapses.

accounting for about 29 % of the initial area. The remaining          in 2017, which is also the remaining part of the Aru-1 ice
ice mass mainly occurred in the upper part of the Aru-2 ice           avalanche. Meltwater of the Aru-2 ice avalanche was esti-
avalanche, where the fragmented ice was thicker (Kääb et al.,         mated to be 31.2 × 10⁶ m3 . Thus, the cumulative meltwater
2018). The elevation difference derived from ASTER DEMs               during the period 2016–2017 reached 60.0 × 10⁶ m3 . In Oc-
between November 2011–2012 and January 2020 indicates                 tober 2018 and 2019, the Aru-2 ice avalanche deposit only
that about 31.8 ± 3.8 × 10⁶ m3 of ice and debris remained             had an area of 3.0 and 1.9 km2 , respectively. We assumed
over the area of the Aru-2 ice avalanche deposit (Fig. S3),           that the melt rates of the ice deposit in 2018 and 2019 were
corresponding to about 30 % of its initial volume.                    the same as in 2017, and the total volume of meltwater was
   Here we roughly estimate the annual meltwater of the frag-         estimated to be 19.2 × 10⁶ and 12.0 × 10⁶ m3 in 2018 and
mented ice mass according to the area and in situ measure-            2019, respectively (Table 1). Thus, about 17.2 × 10⁶ m3 of
ments of ice mass balance. We do not consider sublimation             the ice remained of the Aru-2 ice avalanche by October 2019
or evaporation or other kinds of water loss in this study be-         according to the above calculation, which is generally con-
cause they are relatively small and negligible (S. Li et al.,         sistent with the remaining volume estimated by differencing
2019) compared with the rapid melting of the ice avalanches.          ASTER DEMs.
In situ measurements at nine sites showed that the Aru-1 ice
avalanche thinned about 2.84 m on average between 13 Au-              4.4   Impact of the meltwater on the seasonal lake level
gust 2016 and 24 October 2016, which corresponded to an                     changes in Memar Co
ice mass volume of 25.4 × 10⁶ m3 (Table 1). Considering the
intruding ice into Aru Co (7.1 × 10⁶ m3 ), the total meltwater
                                                                      The meltwater had more impact on Memar Co’s lake level
of the first ice avalanche was estimated to be 29.2 × 10⁶ m3 in
                                                                      changes than Aru Co’s because Aru Co is an outflow lake. We
2016 (assuming the ice density of 900 kg m−3 ). The meltwa-
                                                                      first investigated the seasonal lake level changes at both lakes
ter of the Aru-2 ice avalanche was not considered in 2016 be-
                                                                      and their hydraulic connections based on in situ observations
cause air temperature was already close to 0 ◦ C in early Octo-
                                                                      and satellite altimetry data between 2016 and 2019. Aru Co
ber. The largest melting of the fragmented ice mass occurred
                                                                      exhibited distinct seasonal fluctuations with the lowest lake
in summer 2017. In situ measurements show Aru-1 and Aru-
                                                                      level in late May and the highest in late August (Fig. 5). Its
2 ice avalanches melted down by 6.5 and 5.5 m on average,
                                                                      lake level usually increased by 30–50 cm between June and
respectively, between September 2016 and September 2017.
                                                                      August in response to the relatively high summer rainfall and
Almost all the Aru-1 ice avalanche had melted by October
                                                                      glacier runoff. After the end of monsoon rainfall, the lake
2017, and the meltwater was estimated to be 35.5 × 10⁶ m3
                                                                      level decreased considerably by 20–30 cm due to river dis-

The Cryosphere, 15, 199–214, 2021                                                           https://doi.org/10.5194/tc-15-199-2021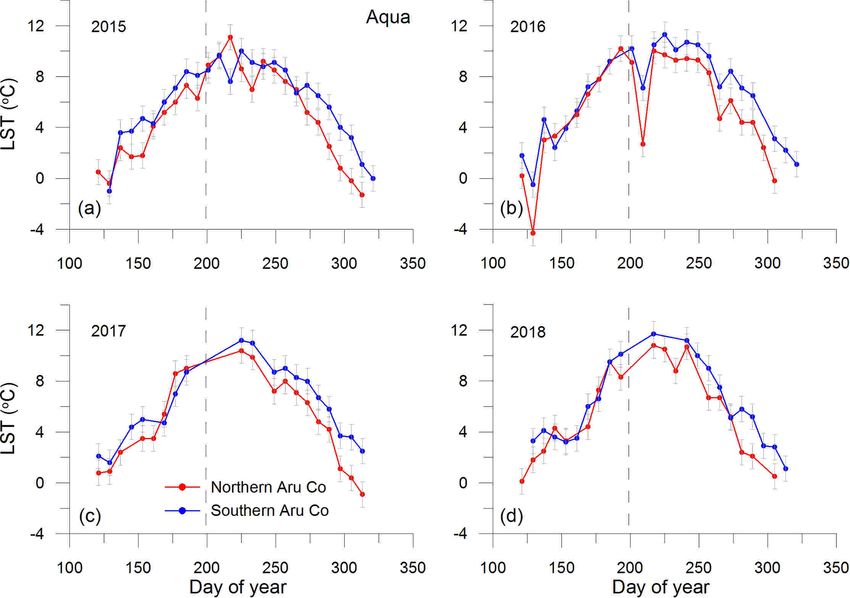
Y. Lei et al.: Response of downstream lakes to Aru glacier collapses                                                                                                                   205

Figure 3. The impact of the Aru-1 glacier collapse on the morphology of Aru Co. (a) The extent of the Aru-1 ice avalanche (Sentinel-2
image on 21 July 2016) and the impact wave at the opposite shore of Aru Co (green dots). The two curves describe the footprint of the impact
wave along the eastern shoreline of Aru Co, including the distance to shoreline and the relative height to Aru Co’s surface. (b) The uneven
lake bathymetry at Aru Co near the Aru-1 ice avalanche. The black line indicates the extent of the intruding ice into Aru Co on 21 July 2016.
(c, d) A large amount of debris left after the fragmented ice mass melting (photos taken on 3 October 2019 by Yanbin Lei).

Table 1. Ice avalanche melting and its contribution to lake level increase at Memar Co between 2016 and 2019.

   Year/month                                      Aru-1                                                Aru-2                            Total meltwaterc          Contribution to
                                                                                                                                                (106 m3 )           lake level (%)
                                  Areaa       Thinning        Volume lossb             Areaa        Thinning        Volume lossb
                                  (km2 )           (m)            (106 m3 )            (km2 )            (m)            (106 m3 )
   2016/07–2016/10            9.3→8.6         2.8 ± 0.1           32.5 ± 1.9                                                                     29.2 ± 1.8              40.0 ± 1.0
   2016/10–2017/10              8.6→0         6.6 ± 0.2           35.5 ± 2.1        6.5→4.8         5.5 ± 0.2           31.2 ± 1.9               60.0 ± 3.6              32.2 ± 2.1
   2017/10–2018/10                                                                  4.8→3.0         5.5 ± 0.2           21.3 ± 1.3               19.2 ± 1.2              13.6 ± 0.7
   2018/10–2019/10                                                                  3.0→1.9         5.5 ± 0.2           13.3 ± 0.8               12.0 ± 0.7               9.9 ± 0.4
  a For each period, the arrow separates the areas of ice deposits at the start (S ) and end (S ) of the period. b The ice volume loss is calculated as a circular truncated cone:
                                                                                  1            2
  V = 31 × (S1 + S2 + S1 × S2 ) × dh, where dh is the reduction in ice thickness. d Total meltwater is derived from the volume loss of the ice deposit by assuming an ice density of
                       p
           −3
  900 kg m .

charge and lake evaporation between September and Octo-                                             Compared to Aru Co, the lake level at Memar Co did not
ber. When the lake surface was frozen between November                                           exhibit distinct seasonality during the study period. There
and the following April, the lake level exhibited a slight drop                                  was an overall lake level increase throughout the year. Lake
by 10–15 cm. After the lake ice broke up in early May, the                                       level increase occurred not only in the warm season but also
lake level of Aru Co continued to decrease slightly due to                                       in the cold season (Lei et al., 2017). During the cold season,
very limited runoff and low evaporation.                                                         the lake level increased by ∼ 30 cm (i.e., 1.4–2.0 mm d−1 )

https://doi.org/10.5194/tc-15-199-2021                                                                                              The Cryosphere, 15, 199–214, 2021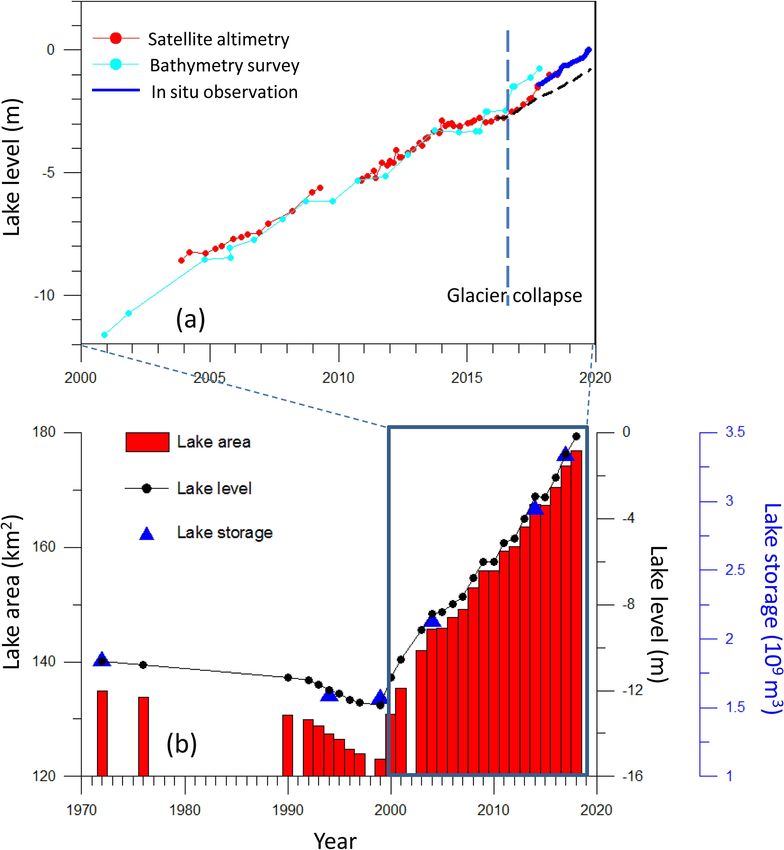
206                                                           Y. Lei et al.: Response of downstream lakes to Aru glacier collapses

                                                                         lake volume increase at Memar Co. This indicates that Aru
                                                                         Co, as an outflow lake, plays a significant role in regulating
                                                                         the water balance of Memar Co.
                                                                            The impact of the two glacier collapses on lake level
                                                                         changes can be found from the seasonal lake level changes
                                                                         derived from CryoSat-2 satellite data and in situ observa-
                                                                         tions between 2011 and 2019. The lake level increase in the
                                                                         cold season (October to May) did not vary much from year
                                                                         to year, with an average value of 0.35 m before (i.e., 2011–
                                                                         2015) and 0.36 m after (i.e., 2016–2019) the glacier collapses
                                                                         (Fig. 6a). However, lake level increase in the warm season
                                                                         (May to September, referred to as “summer” in the follow-
                                                                         ing) increased drastically after the glacier collapses (Fig. 6b).
                                                                         Before the glacier collapses, lake level increase in the warm
                                                                         season varied in a range of −0.2 to 0.36 m, with an average
                                                                         of 0.12 m. After the glacier collapses, the lake level increase
                                                                         in the warm season varied in a range of 0.24 to 0.54 m, with
                                                                         an average of 0.39 m. Since the fragmented ice mass mainly
                                                                         melted in summer, the contribution of meltwater to the lake
                                                                         level increase in summer was estimated to be 44.9 % on av-
Figure 4. The extent of the intruding ice into Aru Co. Gaofen-2          erage between 2016 and 2019 by comparing the meltwater
satellite image (1 m resolution) is used to indicate the extent of the
                                                                         and lake storage increase at Memar Co. We can see that the
intruding ice into Aru Co and the floating ice over the lake surface
on 25 July 2016.
                                                                         melting of the fragmented ice mass played an important role
                                                                         in the lake level increase in summer at Memar Co.

                                                                         4.5   Impact of the meltwater on the inter-annual lake
between November and May, which was comparable or even                         level changes in Memar Co
larger than that in the warm season between June and August
(Fig. 5). The rate of lake level increase in the cold season             Lake level changes at Memar Co between 1972 and 2018
was very stable, indicating a steady water supply as well.               were investigated based on satellite altimetry data and
Lake level increase in the warm season was mainly associ-                bathymetry survey. Lake level changes between 2003 and
ated with high summer rainfall and glacier melting, while                2018 were observed by ICESat and CryoSat-2 satellite al-
the lake level increase in the cold season was probably re-              timetry. Earlier lake level changes before 2003 were re-
lated to groundwater discharge because there is almost no                constructed according to the bathymetry survey and past
surface runoff during this period. Notably, the lake volume              shorelines (Lei et al., 2012). Bathymetry survey showed
decrease at Aru Co only accounted for 20 %–30 % of the lake              that the lake level of Memar Co was 10.4 ± 0.6, 12.3 ± 0.3,
volume increase at Memar Co during the ice-covered season                12.5 ± 0.3, 8.3 ± 0.3 and 3.1 ± 0.3 m lower in 1972, 1994,
(November to May), indicating that the significant lake water            1999, 2004 and 2014 relative to October 2018. According
surplus at Memar Co was not mainly contributed by the dis-               to the lake area and the corresponding water level in the
charge from Aru Co. The in situ observation of seasonal lake             5 years, the relationship between lake area and water level
level changes at Memar Co confirms the significant lake level            was developed by using a second-order polynomial regres-
increase in the cold season on the western Tibetan Plateau               sion (R 2 = 0.99):
(Lei et al., 2017).                                                      y = −0.1077 × x 2 + 2.8468 × x + 176.81.                     (1)
   The hydraulic connection between Aru Co and Memar Co
is investigated by comparing the seasonal lake level changes             Here, y is the lake area (km2 ) and x is the lake water level
at the two lakes. The lake level at Aru Co started to increase           (m). Thereby, we reconstructed lake level changes since 1972
rapidly in early July, which was about half a month earlier              by using the corresponding lake area (Fig. 7). To validate the
than that at Memar Co. Meanwhile, the end of the rapid lake              results, we compare the reconstructed lake level changes with
level increase at Aru Co was also about half a month earlier             satellite altimetry data during the overlap period of 2003–
than that at Memar Co (Fig. 5b, c). The time lag of seasonal             2018. Figure 7a shows that there is a good correspondence
lake level changes at the two lakes indicates the buffering              between the two datasets, indicating our reconstructed lake
effect of Aru Co as an outflow lake. A large amount of wa-               level changes are reliable.
ter was stored in Aru Co in summer and released to Memar                    Based on lake area and water level changes, lake dynam-
Co in autumn. In early September, the lake level at Aru Co               ics of Memar Co between 1972 and 2018 can be divided into
decreased by about 10 cm, accounting for about 90 % of the               two distinct periods (Fig. 7). Between 1972 and 1999, Memar

The Cryosphere, 15, 199–214, 2021                                                             https://doi.org/10.5194/tc-15-199-2021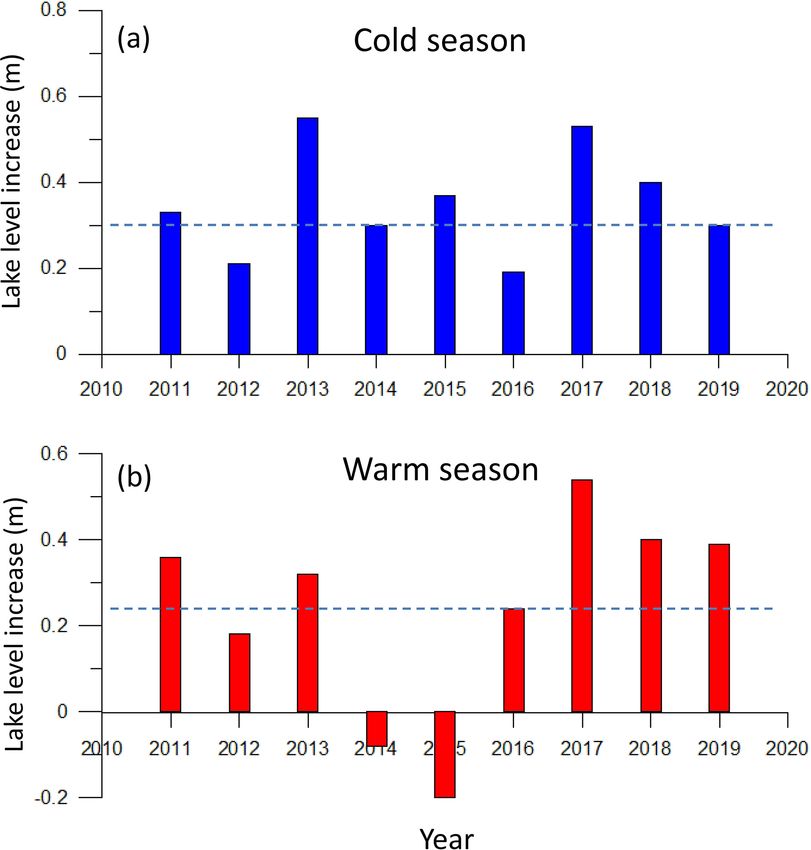
Y. Lei et al.: Response of downstream lakes to Aru glacier collapses                                                                     207

Figure 5. In situ lake level observations at Aru Co (blue line) and Memar Co (red line) between 2016 and 2019. (a) Lake level changes at
Aru Co (blue line) and Memar Co (red line) between 2016 and 2019. The dashed red line indicates lake level changes at Memar Co without
the fragmented ice melting. The black dots represents the lake level derived from CryoSat-2 altimetry data. (b–c) Comparisons of lake level
changes at the two lakes in 2017/18 and 2018/19. The colored strips in (b) and (c) indicate different periods of lake level changes in a year,
namely post-monsoon season, ice-covered season and monsoon season.

                                                                         2000 and 2018. The gradual shrinkage before 1999 and rapid
                                                                         expansion since 2000 at Memar Co were similar to most en-
                                                                         dorheic lakes on the TP (e.g., Lei et al., 2014). Many studies
                                                                         have shown that precipitation has increased significantly on
                                                                         the interior TP since the late 1990s (Yang et al., 2014; Treich-
                                                                         ler et al., 2019), which has led to the significant lake expan-
                                                                         sion (Lei et al., 2014). Between 1972 and 2018, the lake level
                                                                         and water storage of Memar Co increased by 10.4 ± 0.6 m
                                                                         and 1.62 ± 0.11 Gt (from 1.86 to 3.49 Gt), respectively.
                                                                            After the Aru glacier collapses in 2016, Memar Co ex-
                                                                         panded more rapidly than before. Between 2003 and 2014,
                                                                         the lake level of Memar Co increased steadily at a rate of
                                                                         0.59 m yr−1 . The lake expansion paused in 2015, which was
                                                                         probably in response to the widespread drought over the TP
                                                                         during the strong 2015/16 El Niño event (Lei et al., 2019).
                                                                         Between 2016 and 2019, the lake level of Memar Co in-
                                                                         creased at an average rate of 0.80 m yr−1 , about 30 % higher
                                                                         than that between 2003 and 2014. During this period, the lake
                                                                         level and the water storage of Memar Co increased by 3.0 m
                                                                         and 0.52 Gt, respectively. Assuming all the meltwater was
                                                                         transferred into Memar Co (after transiting through Aru Co),
                                                                         the total melting of ice avalanches contributed to 23.3 % of
Figure 6. Seasonal lake level changes at Memar Co derived from
                                                                         the increase in lake storage between 2016 and 2019. Without
CryoSat-2 satellite altimetry data between 2011 and 2019. (a) Cold
                                                                         the additional meltwater of ice avalanches, the rate of lake
season (November to June). (b) Warm season (June to October).
                                                                         level increase in Memar Co after the glacier collapses could
                                                                         have been similar to that between 2003 and 2014 (Fig. 7a).
                                                                            The contribution of the melting of ice avalanches on inter-
Co exhibited gradual shrinkage with a lake level decrease of             annual lake level changes in Memar Co was also quantita-
2.1 ± 0.3 m. Since 2000, Memar Co experienced rapid ex-                  tively evaluated. In 2016, when ice melting mainly occurred
pansion with a lake level increase of 12.5 ± 0.3 m between

https://doi.org/10.5194/tc-15-199-2021                                                              The Cryosphere, 15, 199–214, 2021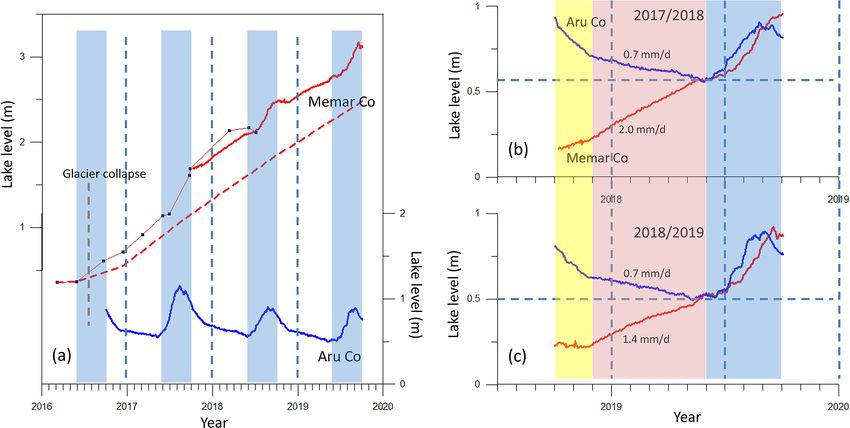
208                                                           Y. Lei et al.: Response of downstream lakes to Aru glacier collapses

                                                                        November and breaks up in early June. A comparison of
                                                                        MODIS-derived lake surface temperature with in situ obser-
                                                                        vations shows that although there are similar seasonal cycles,
                                                                        in situ lake surface temperature at the shoreline is consider-
                                                                        ably higher than MODIS-derived lake surface temperature in
                                                                        spring and summer (Fig. S5). This is because MODIS sen-
                                                                        sors measured the lake skin temperature at the lake center,
                                                                        while a HOBO logger measured lake water temperature at
                                                                        the depth of 30–70 cm at the shoreline.
                                                                           The Aru-1 ice avalanche significantly affected the lake sur-
                                                                        face temperature of Aru Co and Memar Co in summer 2016.
                                                                        Both Terra and Aqua datasets showed that nighttime lake sur-
                                                                        face temperature at Aru Co decreased abruptly by 2–4 ◦ C in
                                                                        the first 2 weeks after the Aru-1 glacier collapse (Fig. 8),
                                                                        which was quite different from normal years and may have
                                                                        considerably affected the lake ecosystem. A similar decrease
                                                                        in lake surface temperature also occurred at Memar Co but
                                                                        with less magnitude and a shorter duration than at Aru Co
                                                                        (Fig. 8). We attribute the significant decrease in lake surface
                                                                        temperature to the ice floes over the surface of Aru Co. As
                                                                        shown in Sect. 4.2, a large amount of ice mass slid into Aru
                                                                        Co after the Aru-1 glacier collapse and generated great waves
                                                                        at Aru Co. The Gaofen-2 satellite image (1 m resolution) on
Figure 7. Lake dynamics of Memar Co between 1976 and 2018.              25 July 2016 showed a large volume of ice floes spread over
(a) A comparison of reconstructed lake level changes in this study      the surface of Aru Co (Fig. 4). The gradual ice melting may
(blue circles) with satellite altimetry data (red circles). (b) Long-   cool the lake surface. About 2 weeks later, lake surface tem-
term changes in lake area, water level and water storage of Memar
                                                                        perature returned to its normal status.
Co between 1972 and 2018. The dashed line in (a) indicates lake
level changes without the fragmented ice melting.
                                                                           The spatial patterns of lake surface temperature right be-
                                                                        fore (11 July) and after (19 and 27 July) the first glacier
                                                                        collapse (17 July 2016) are investigated by using nighttime
in the first glacier collapse, Memar Co expanded slightly with          Aqua data (Fig. 10). Lake surface temperature in northern
a lake level increase of 0.43 m. In 2017, when the ice melting          Aru Co was considerably lower than that in southern Aru Co
reached the maximum, Memar Co exhibited the most rapid                  on 19 and 27 July, and the lake surface temperature increased
expansion, with a lake level increase of 1.07 m. In 2018 and            gradually from north to south, which further confirms the
2019, with the decrease in the meltwater from ice avalanches,           influence of the ice floes on lake surface temperature. This
the expansion of Memar Co also slowed down, with a lake                 spatial pattern was in contrast to that before the glacier col-
level increase of 0.8 and 0.69 m, respectively. Assuming all            lapse (Fig. 10). A similar pattern also occurred in Memar
the meltwater was transferred into Memar Co, its contribu-              Co, where lake surface temperature increased from south to
tion to the lake level increase in Memar Co was estimated               north after the glacier collapse. This spatial pattern may in-
to be 40.0 %, 32.2 %, 13.6 % and 9.9 % in the 4 years of our            dicate that the ice floes may flow into Memar Co through the
study period (2016–2019).                                               5 km long river (10–20 m wide) linking the two lakes.
                                                                           Lake surface temperatures in southern and northern Aru
4.6   Impact of Aru glacier collapses on lake surface                   Co were compared to examine their spatial heterogeneity
      temperature                                                       since northern Aru Co was closer to the two glacier collapses
                                                                        (Fig. 9). Before the glacier collapses (e.g., 2015), water tem-
Seasonal variations in lake surface temperature at Aru Co               perature between southern and northern Aru Co did not show
and Memar Co are shown in Fig. 8. Aru Co usually freezes                considerable differences in July and August. After the glacier
up in early November and breaks up in early May, with                   collapse, the lake surface temperature in August 2016 was
lake ice phenology for about 6 months. After lake ice breaks            about 1–2 ◦ C lower in northern Aru Co than that in southern
up in May, the nighttime lake surface temperature increases             Aru Co (Fig. 9). As shown in Sect. 4.2, most of the intruding
rapidly from 2 to 10 ◦ C between May and August. Then the               ice into Aru Co, with a volume of 7.1 × 10⁶ m3 , melted in
lake water cools gradually from September to October. Sea-              the following 2 months. Since the meltwater of the intruding
sonal lake surface temperature at Memar Co shows a sim-                 ice was considerably cooler than the lake water, it may de-
ilar seasonal cycle to that at Aru Co but delayed lake ice              crease the lake water temperature in northern Aru Co more
phenology (Fig. 8). Memar Co usually freezes up in late                 significantly. This spatial difference in lake surface tempera-

The Cryosphere, 15, 199–214, 2021                                                           https://doi.org/10.5194/tc-15-199-2021
Y. Lei et al.: Response of downstream lakes to Aru glacier collapses 209
Figure 8. Seasonal changes in nighttime lake surface temperature (LST) derived from Terra MOD11A2 and Aqua MYD11A2 in northern
Aru Co (a–b), southern Aru Co (c–d) and Memar Co (e–f) between 2015 and 2018. The dashed lines indicate the time of the Aru-1 glacier
collapse. The error bar is denoted in grey lines.
ture may indicate the impact of the meltwater on lake surface 5 Discussion
temperature in summer 2016. Similar conditions can also be
found in summer 2017 and 2018. Notably, the detailed pro- 5.1 Response of the rapid lake expansion on the
cess of changes in lake surface temperature after the glacier western TP to climate change
collapses is still unclear because some data are unavailable in
summer due to the influence of cloud cover and other factors. Widespread lake expansion has occurred on the interior TP
More work is needed to demonstrate this process by using during the past 2 decades (e.g., Lei al., 2014; Yang et al.,
more intensive satellite data. 2017). Although there are quite a few studies reporting
changes in lake area and water level on the western TP,
bathymetry survey remains scarce for lakes on the western
TP due to the harsh natural conditions and remoteness. Qiao
et al. (2017) performed bathymetry survey at four lakes on
the western TP, including Guozha Co, Longmu Co, Aksai
Chin Lake and Bangdag Co. Their results showed that wa-
ter storage at Aksai Chin Lake and Bangdag Co has almost
https://doi.org/10.5194/tc-15-199-2021 The Cryosphere, 15, 199–214, 2021210 Y. Lei et al.: Response of downstream lakes to Aru glacier collapses
Figure 9. A comparison of MODIS-derived nighttime lake surface temperature (LST) in northern and southern Aru Co during the period of
2016–2019. The dashed lines indicate the time of the Aru-1 glacier collapse. The error bar is denoted in grey lines.
expansion at Memar Co occurred in 2000, which is about 1–
2 years later than at lakes in other regions of the TP (Lei et
al., 2014).
Since most glaciers on the TP have experienced significant
mass loss during the past decades, their impact on the rapid
lake expansion on the TP has been investigated in many stud-
ies (Yao et al., 2010, 2018; Lei et al., 2012; Song and Sheng,
2015; Li and Lin, 2017; Zhang et al., 2017; Zhou et al., 2019;
Treichler et al., 2019; Brun et al., 2020). For example, glacier
mass loss was estimated to contribute to ∼ 10.5 % of lake ex-
pansion at Nam Co on the central TP (Li et al., 2017). In the
Hoh Xil region, the glacier mass loss contribution to lake ex-
pansion was estimated to be 9.9 % and 11.1 % at Lixi Oidaim
Lake and Hoh Xil Lake (Zhou et al., 2019). However, re-
cent studies show that glaciers in the Karakoram and west-
Figure 10. Spatial distribution of nighttime lake surface temper- ern Kunlun Mountains have experienced balanced or slightly
ature at Aru Co and Memar Co before (11 July 2016) and after positive mass budgets (e.g., Kääb et al., 2015; Shean et al.,
(27 July 2016) the Aru-1 glacier collapse. Landsat satellite image 2020). Kääb et al. (2018) showed that the two Aru glaciers
is used to indicate the location of the two lakes and the Aru-1 ice have experienced a slight mass gain of 0.2–0.3 m yr−1 wa-
avalanche. ter equivalent (w.e.) since the early 2000s, despite a simul-
taneous glacier retreat of 520–460 m. This indicates that the
glacier mass changes have played a limited role in the rapid
doubled during the past 40 years. At Aksai Chin Lake and lake expansion of Memar Co since the 2000s. The melting
Bangdag Co, water storage increased from 1.33 to 2.57 Gt of the two avalanches was relatively fast (three melt seasons
and from 1.23 to 2.60 Gt, respectively, between 1996 and were sufficient to melt the Aru-1 deposit), but even with this
2015. In this study, our results showed that water storage additional meltwater, precipitation remains the main driver
at Memar Co almost doubled from 1.86 to 3.49 Gt between of the rapid lake expansion of Memar Co.
1999 and 2018, which was similar to the changes in the two Treichler et al. (2019) suggested that the glacier thickening
reported lakes. Meanwhile, based on more intense satellite and rapid lake growth on the western TP could be mainly at-
data, we also found that the turning point from shrinkage to tributed to the stepwise increase in precipitation since the late
The Cryosphere, 15, 199–214, 2021 https://doi.org/10.5194/tc-15-199-2021Y. Lei et al.: Response of downstream lakes to Aru glacier collapses 211
1990s. Significant increase in precipitation since the 2000s is 6 Conclusions
evident from meteorological station and reanalysis data (Lei
et al., 2014; Treichler et al., 2019). This indicates that rapid The deposit of the Aru glacier collapses on 17 July and
lake expansion on the western TP, including Memar Co, was 21 September 2016 had almost melted by September 2019
mainly a result of climate change, especially climate wetting (∼ 30 % of ice remained for the Aru-2 ice avalanche). A com-
(Lei and Yang, 2017). prehensive investigation of the impact of the glacier collapses
on the two downstream lakes, the outflow lake Aru Co and
5.2 Potential risk of lake expansion on the TP the terminal lake Memar Co, was conducted from 2016, in-
cluding on meteorology, ice mass balance, lake bathymetry
Lake expansion on the interior TP inundated grassland and and lake level changes. Based on in situ observation and
infrastructures (e.g., road and bridges) in the surrounding satellite data, the response of the two downstream lakes to
area, which led to not only very large economic loss but the ice avalanches in the subsequent years (2016–2019) has
also serious ecological and environmental problems (Yao et been evaluated in this study. We found that the ice avalanches
al., 2010; Liu et al., 2019). For example, a significant over- significantly affected the two downstream lakes during the
flow suddenly occurred at Zhuonai Lake (255 km2 ) in Hoh period 2016–2019.
Xil Nature Reserve in late August 2011, which further led to During the Aru-1 glacier collapse, the fragmented ice mass
the overflow of Kusai Lake (260 km2 ) and rapid expansion slid into Aru Co along with a large amount of debris, which
of the downstream lakes (X. Yao et al., 2012; Hwang et al., generated great impact waves in Aru Co and modified the
2019; X. Li et al., 2019) and even had serious consequences shoreline and bathymetry. The Aru Co shoreline was pushed
for antelope survival (Pei et al., 2019). offshore by 100–120 m along the two sides of the first glacier
The continuous lake expansion of Memar Co may fur- collapse fan. Lake bathymetry near the Aru-1 ice avalanche
ther lead to its coalescence with Aru Co in the near future, became very uneven, in contrast to the smooth lake floor in
which will have significant impact on the regional geomor- the adjacent areas. The intruding ice into Aru Co, with an
phology and ecosystem. In 2003, the water level of Aru Co area of ∼ 0.89 km2 and a volume of at least 7.1 × 10⁶ m3 ,
(4936.8 m a.s.l.) was about 14 m higher than that of Memar melted in less than 2 months.
Co (4923.2 m a.s.l.), as indicated by ICESat satellite altime- The spread of ice floes over the surface of Aru Co consid-
try data. In 2014, CryoSat-2 data show that the elevation dif- erably lowered the lake surface temperature by 2–4 ◦ C in the
ference between the two lakes decreased to ∼ 8 m due to the first 2 weeks after the Aru-1 glacier collapse. A similar lake
continual lake expansion of Memar Co. After the glacier col- surface temperature decrease was also observed at Memar
lapses, Memar Co expanded at an accelerated rate and the Co (the downstream lake of Aru Co) but with a smaller mag-
elevation difference became even smaller. In October 2019, nitude and shorter duration. The lake surface temperature in
the surface elevation of Memar Co reached 4931.3 m a.s.l. northern Aru Co was considerably lower than that in south-
and the elevation difference between the two lakes decreased ern Aru Co in summer 2016, which is mainly associated with
to only 5.5 m. Projection in the near future of the increasing the avalanche melting.
rate of 0.5–0.8 m yr−1 between 2003 and 2019 indicates that After the glacier collapses (2016–2019), Memar Co ex-
the water level of Memar Co could reach that of Aru Co in panded more rapidly than before (2003–2015) as a result
7–11 years. According to the reconstructed relationship be- of faster lake level increases in summer. Between 2016 and
tween lake area and lake level in Sect. 4.5, when the lake 2019, the ice avalanche melting contributed about 23.3 % of
level of Memar Co increases by 5 m, the lake area and water the increase in lake storage at Memar Co. If Memar Co con-
storage will increase by 10.6 % and 0.65 Gt, relative to 2019. tinues to expand steadily, it will coalesce with Aru Co in 7–
At present, Memar Co is a saline lake, while Aru Co is a 11 years, which could have significant impact on the regional
freshwater lake. If the two lakes merge, lake salinity and ion geomorphology and ecosystem. This study also suggests the
composition will exchange freely. Memar Co will be diluted necessity for more comprehensive monitoring at Aru Co and
while Aru Co will be significantly salted. The habitat of the Memar Co as significant changes may occur at the two lakes
phytoplankton and zooplankton in the lakes will also change in the near future.
significantly in response to changes in lake salinity and ion
composition. Therefore, it is necessary to carry out compre-
hensive monitoring at Aru Co and Memar Co in the coming Data availability. Landsat 8 OLI data and Sentinel-2 data can be
years, including lake hydrology, meteorology, water quality accessed at http://glovis.usgs.gov (last access: July 2019, USGS,
and ecology. 2019). MODIS LST products are available at HYPERLINK https:
//ladsweb.modaps.eosdis.nasa.gov (last access: July 2019, NASA
LAADS, 2019). Any other specific data can be provided by the au-
thors on request.
https://doi.org/10.5194/tc-15-199-2021 The Cryosphere, 15, 199–214, 2021212 Y. Lei et al.: Response of downstream lakes to Aru glacier collapses
Supplement. The supplement related to this article is available on- Cook, K., Andermann, C., Gimbert, F., Adhikari, B. R., and Hovius,
line at: https://doi.org/10.5194/tc-15-199-2021-supplement. N.: Glacial lake outburst floods as drivers of fluvial erosion in the
Himalaya, Science, 362, 53–57, 2018.
Cui, P., Su, F., Zou, Q., Chen, N., and Zhang, Y.: Risk assess-
Author contributions. YL, TY, LT and YS conceived and designed ment and disaster reduction strategies for mountainous and me-
the experiments; YBL, TY, LJ, HZ, WY, MZ and GW performed teorological hazards in Tibetan Plateau, Chin. Sci. Bull., 60,
the fieldwork; YL, TY, LT, YS, L and KY analyzed the data; JL, 3067–3077, https://doi.org/10.1360/N972015-00849, 2015 (in
EB, FB and YG processed the satellite data. All the authors wrote Chinese).
the paper. Dussaillant, I., Berthier, E., Brun, F., Masiokas, M., Hugonnet, R.,
Favier, V., Rabatel, A., Pitte, P., and Ruiz, L.: Two decades of
glacier mass loss along the Andes, Nat. Geosci., 12, 802–808,
Competing interests. The authors declare that they have no conflict https://doi.org/10.1038/s41561-019-0432-5, 2019.
of interest. Gilbert, A., Leinss, S., Kargel, J., Kääb, A., Gascoin, S., Leonard,
G., Berthier, E., Karki, A., and Yao, T.: Mechanisms leading
to the 2016 giant twin glacier collapses, Aru Range, Tibet, The
Cryosphere, 12, 2883–2900, https://doi.org/10.5194/tc-12-2883-
Acknowledgements. We thank USGS for providing Landsat data
2018, 2018.
and Sentinel data, NASA LAADS for providing MODIS LST data,
Guo, W., Liu, S., Xu, J., Wu, L., Shangguan, D., Yao, X., Wei,
and the China High-Resolution satellite data sharing platform for
J., Bao, W., Yu, P., Liu, Q., and Jiang, Z.: The second Chinese
providing Gaofen-2 data. We are also grateful to all the agency
glacier inventory: data, methods and results, J. Glaciol., 61, 357–
members who took part in the fieldwork. We also thank the three
372, 2015.
anonymous reviewers and Linghong Ke for their constructive com-
Hwang, C., Cheng, Y.-S., Yang, W.-H., Zhang, G., Huang,
ments which have improved this paper.
Y.-R., Shen, W.-B., and Pan, Y.: Lake level changes in
the Tibetan Plateau from CryoSat-2, SARAL, ICESat, and
Jason-2 altimeters, Terr. Atmos. Ocean. Sci., 30, 1–18,
Financial support. This research has been supported by the Strate- https://doi.org/10.3319/TAO.2018.07.09.01, 2019.
gic Priority Research Program of the Chinese Academy of Sciences Jiang, L., Nielsen, K., Andersen, O. B., Bauer-Gottwein, P.: Mon-
(grant no. XDA2006020102), the Second Tibetan Plateau Scientific itoring recent lake level variations on the Tibetan plateau using
Expedition and Research Program (grant no. 2019QZKK0201), the CryoSat-2 SARIn mode data, J. Hydrol., 544, 109–124, 2017.
National Science Foundation of China (grant nos. 41971097 and Kääb, A., Treichler, D., Nuth, C., and Berthier, E.: Brief Communi-
21661132003), the Youth Innovation Promotion Association of the cation: Contending estimates of 2003–2008 glacier mass balance
Chinese Academy of Sciences (grant no. 2017099), and the French over the Pamir–Karakoram–Himalaya, The Cryosphere, 9, 557–
Space Agency (CNES), through its TOSCA and ISIS programs. 564, https://doi.org/10.5194/tc-9-557-2015, 2015.
Kääb, A., Leinss, S., Gilbert, A., Bühler, Y., Gascoin, S., Evans,
S. G., Bartelt, P., Berthier, E., Brun, F., Chao, W., Farinotti, D.,
Review statement. This paper was edited by Jürg Schweizer and re- Gimbert, F., Guo, W., Huggel, C., Kargel, J. S., Leonard, G.
viewed by three anonymous referees. J., Tian, L., Treichler, D., and Yao, T.: Massive collapse of two
glaciers in western Tibet in 2016 after surge-like instability, Nat.
Geosci., 11, 114–120, https://doi.org/10.1038/s41561-017-0039-
7, 2018.
Ke, L. and Song, C.: Remotely sensed surface temperature variation
References of an inland saline lake over the central Qinghai-Tibet Plateau,
ISPRS J. Photogramm. Remote Sens., 98, 157–167, 2014.
Berthier, E. and Brun, F.: Karakoram geodetic glacier mass balances Kleinherenbrink, M., Lindenbergh, R. C., and Ditmar, P. G.: Moni-
between 2008 and 2016: persistence of the anomaly and influ- toring of lake level changes on the Tibetan Plateau and Tian Shan
ence of a large rock avalanche on Siachen Glacier, J. Glaciol., by retracking CryoSat SARIn waveforms, J. Hydrol., 521, 119–
65, 494–507, https://doi.org/10.1017/jog.2019.32, 2019. 131, 2015.
Berthier, E., Arnaud, Y., Kumar, R., Ahmad, S., Wagnon, Lei, Y. and Yang, K.: The cause of rapid lake expansion in the
P., and Chevallier, P.: Remote sensing estimates of glacier Tibetan Plateau: climate wetting or warming?, WIREs Water,
mass balances in the Himachal Pradesh (Western Hi- e1236, https://doi.org/10.1002/wat2.1236, 2017.
malaya, India), Remote Sens. Environ., 108, 327–338, Lei, Y., Yao, T., Yi, C., Wang, W., Sheng, Y., and Li, J.: Glacier
https://doi.org/10.1016/j.rse.2006.11.017, 2007. mass loss induced the rapid growth of Linggo Co on the central
Brun, F., Berthier, E., Wagnon, P., Kääb, A., and Treichler, D.: Tibetan Plateau, J. Glaciol., 58, 177–184, 2012.
A spatially resolved estimate of High Mountain Asia glacier Lei, Y., Yang, K., Wang, B., Sheng, Y., Bird, B. W., Zhang, G.,
mass balances from 2000 to 2016, Nat. Geosci., 10, 668–673, and Tian, L.: Response of inland lake dynamics over the Ti-
https://doi.org/10.1038/NGEO2999, 2017. betan Plateau to climate change, Climatic Change, 125, 281–290,
Brun, F., Treichler, D., Shean, D., and Immerzeel, W. W.: Lim- https://doi.org/10.1007/s10584-014-1175-3, 2014.
ited contribution of glacier mass loss to the recent increase Lei, Y., Yao, T., Yang, K., Sheng, Y., Kleinherenbrink, M., Yi, S.,
in Tibetan Plateau lake volume, Front. Earth Sci., 8, 582060, Bird, B., Zhang, X., Zhu, L., and Zhang, G.: Lake seasonality
https://doi.org/10.3389/feart.2020.582060, 2020.
The Cryosphere, 15, 199–214, 2021 https://doi.org/10.5194/tc-15-199-2021You can also read