Results for the year ended 31 March 2018 - Dominic Taylor, Chief Executive Rachel Kentleton, Finance Director 24 May 2018 - PayPoint
←
→
Page content transcription
If your browser does not render page correctly, please read the page content below
Dominic Taylor, Chief Executive
                   Rachel Kentleton, Finance Director

                   24 May 2018

Results for the year ended
31 March 2018
Introduction
Continued strategic and operational progress                                                               3

 Good FY18 financial performance
 •      Net revenue up £2.1m to £119.6 million, with underlying growth of £6.3m
 •      Profit before tax £52.9 million, slightly ahead of expectations
 •      Operating cashflows increased by 6.5% to £65.1 million
 •      New financing facility secured at improved margins

 Business delivering against strategic priorities
 •      PayPoint One in over 8,500 sites, exceeding 8,000 target
 •      Strong pipeline of parcel opportunities, contract discussions underway with the intention to have at
        least one live before peak
 •      Good momentum in MultiPay, transactions increased 88%, servicing 22 client brands
 •      Romania performing well; Payzone integration progressing

 Business reorganised for better innovation and customer service
 •      Operations Management Group established to deliver process improvements across the business
 •      Product and marketing restructured to drive more focused commercial execution
 •      CRM implemented for new client business
 •      Costs down £1.0 million in second half

 Ongoing attractive shareholder returns
 •      Full year dividend of 45.9 pence per share, up by 2%
 •      Additional dividend of 36.7 pence per share

Results for the period ended 31 March 2018
Reshaping phases complete, now set for growth                                                                        4

                                                                                                    4
                                                                          3
                                                    2                                             Future

            1                                                    8,500 PayPoint One live
                                                                                             Grow PayPoint One
                                                                                                ecosystem
                                                                  Launched EPoS Pro          Launch new parcel
                                                                    and Mobile App                carriers
                                             Launched MultiPay                              Continued strong cash-
                                                                  19m transactions on      flows from UK payments
        Mobile and                              Launched               MultiPay                  and top-ups
        Online Sale                            PayPoint One         Payzone Romania         Integrate Payzone and
     Refocus on core                                                    acquired           grow Romanian business
                                             Parcels agreement
    markets of UK and                          renegotiated
        Romania

                                                                   2017 - 2018                    Future
    2015 - 2016                              2016 - 2017             Deploy new            Sustainable delivery
                                         Invest for growth          growth levers              and growth
  Simplify business

Results for the period ended 31 March 2018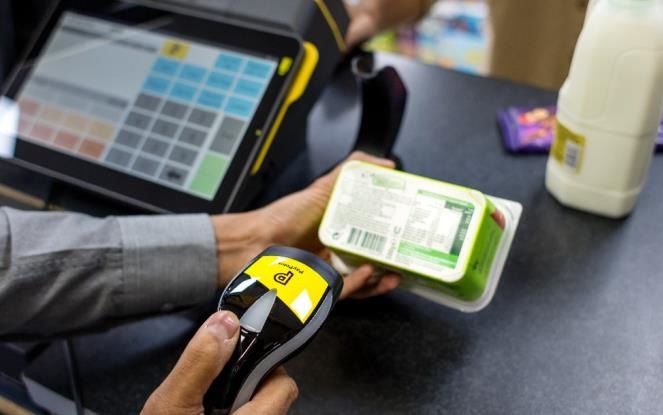
Financial review

Financial results                                                         6

Year ended 31 March                          2018     2017          %
                                               £m       £m      change
Gross revenue                                213.5     211.9        0.8
Net revenue                                  119.6     123.9      (3.5)
Other cost of revenue                        (19.6)   (17.9)        9.5
Administrative costs                         (46.5)   (53.7)     (13.4)
Operating profit before disposals             53.5      52.3        2.3
Impairments and disposals                         -     15.6       n.m.
Share of Collect+ JV                              -      1.2       n.m.
Net financing costs                           (0.6)        -       n.m.
Profit before tax                             52.9      69.1     (23.4)
Tax                                          (10.0)     (9.5)       5.3
Earnings per share                           63.0p     87.5p     (28.0)
Ordinary dividend per share                  45.9p     45.0p        2.0
Disposal proceeds dividend per share              -    38.9p      (100)
Additional dividend per share                36.6p     36.7p
PayPoint* revenue growth continues                                                                                                                      7

 Year ended 31 March                                                                                     2018              2017                %
                                                                                                           £m                £m            change
 Gross revenue                                                                                           213.5              203.4                    5.0

 Net revenue                                                                                             119.6              117.5                    1.8

 Other cost of revenue                                                                                   (19.6)             (16.7)                  17.4

 Administrative costs                                                                                    (46.5)             (47.5)                  (2.1)

 Operating profit                                                                                          53.5               53.3                   0.4

 * Consists of our UK, Irish and Romanian retail businesses. A reconciliation, for each measure, from the financial results to Retail networks is
   included in note 4 to the financial statements.

Results for the period ended 31 March 2018
Underlying growth in net revenue                                                                                                                                 8

   (net revenue 2017)                                                                                                              (net revenue 2018)

             UK top-
                                                                                                                                           UK top-
               ups                                                                             Parcels
                                   Parcels
                                                    Parcels & other
                                                                                                                                             ups
             £16.9m                (old fee)
                                                                                                 &
                                                       £10.7m                                  Other                                       £17.7m
                                    £1.8m                              Cards                                 Cards
                                                                                               £9.7m
                       UK retail                                       £7.0m                                 £7.5m
  UK bill              services                                                                                                UK retail
                                                                                     Service                                                           UK bill
payments               £36.6m                                                         fees
                                                                                                                               services
 £52.4m                                                                              £7.7m                                     £37.7m                payments
                                               Service fees        ATM                                ATM                                             £52.3m
                                                 £4.0m            £13.1m                             £12.8m

                                                                                                                             Romania
                       Romania
                                                                                                                             £11.9m
                        £9.2m
            £m
            122

                                                                                                                           £2.7m
            117
                                    (£4.2m)                                                                 £2.9m                      £119.6m
                   £117.5m                                                 (£0.1m)                                         £116.9m
                                                                                       £0.8m              £114.0m
            112
                                                         £113.3m
                     Retail        VAT and C+             Retail         UK              UK                     UK         Romania        Retail
                   networks                             networks   bill payments       top-ups           retail services                networks
                  net revenue                          net revenue                                                                     net revenue
                     2017                                 2017                                                                            2018

* VAT and C+ comprises the £2.4m included in prior year for benefit from the change of card payments to exempt status and the £1.8m impact
  in the current year from the revised terms with Yodel. Both items are included in UK retail services.
Results for the period ended 31 March 2018
Reduction in second half costs                                                                                                                            9

                                         £66.6m total
                                                   1                                                        Half year analysis
                             Third party costs 2018
                               costs
               D&A            £24.0m
              £10.5m                                                                                                           £35.4m      £34.4m
                                                                                           £28.8m        £32.2m

                           People                                                                 First half                     Second half
                           £32.1m                                                                         2016/17              2017/18
 £m
                                                                                                                                     £123.1m

                                                                                                                 2

                                                                                                                     £0.5m
 67                                                                                    £0.4m       £0.8m                        (£1.2m)

                     £1.2m                                                £2.2m
                                  (£2.7m)                                              £66.1m £66.5m                            £66.6m £66.6m
                                               £0.4m        £0.8m
       £64.2m
 62
         Retail       Payzone        VAT         Agile        D&A            D&A       PayPoint       CRM              Net      Sustainable     Retail
        networks                             reorganisation Reasses       investment     One        Salesforce       finance    efficiencies   networks
          costs                                            useful lives                 Rollout    investment         costs                      costs
          2017                                                                                                                                   2018

1. Comprises £19.2 million other costs of revenue, administrative expenses £46.9 million and net financing costs of £0.5 million.
2. Comprises £2.4 million benefit relating to a net VAT adjustment from the tribunal overturning the HMRC’s ruling that part of PayPoint’s services
   were VAT exempt, £1.5 million of this relates to years prior to 2017/18. 2016/17 included a one-off cost of £0.3m as a result of increased
   irrecoverable VAT arising from the change in the VAT treatment of card payment revenue.
Results for the period ended 31 March 2018
Financing and working capital                                                                                              10

 • Working capital improvements – better terms for card rebate reduced from 3
   months to 1 month

 • New dividend payment profile from 1 April 2019 (ordinary and additional) –
   quarterly payments will reduce working capital spikes

 • New financing facility in place - £75 million – five year term at better margins

                                      Cumulative Dividend Payment profile1
                                                              Yodel

     60.0

£m   30.0

        -
                         July                 September          December           January                  March
                                                          1/3 & 2/3   Quarterly   * Based on dividend payments in 2017/18

 Results for the period ended 31 March 2018
Cash generation and use 11
Year ended 31 March 2018 2017
£m £m
Profit before tax 52.9 69.1
Non-cash items / other 12.2 (8.0)
Operating cash flows 65.1 61.1
Working capital – PayPoint / other 2.9 0.9
Working capital – Client funds 5.4 (11.6)
Tax paid (10.3) (8.6)
Capital and other expenditure (13.4) (17.5)
Free cash flow 49.7 24.3
Net cash from business disposals (0.9) 22.7
Dividends paid (55.9) (78.5)
Effects of foreign exchange rate changes - 1.2
Net cash movement (7.1) (30.3)
Cash at 31 March 46.0 53.1
Client funds included in cash at 31 March 27.5 20.2
Results for the period ended 31 March 2018Uses of cash 12
4.3 4.3
3.5
Capex
maintenance (£m)
Maintain/optimise core business
2015/16 2016/17 2017/18
14.0
9.1
Capex 3.9
growth (£m)
Invest for future performance
2015/16 2016/17 2017/18
Yodel
55.9
38.0
Dividends (£m) 27.4
Ordinary and additional
Generate capital returns for shareholders
2015/16 2016/17 2017/18
Results for the period ended 31 March 2018Balance sheet remains strong 13
Year ended 31 March 2018 2017
£m £m
Goodwill 12.2 8.2
Other intangible assets 13.6 11.9
Property, plant & equipment & deferred tax 28.6 27.5
Cash 46.0 53.1
Working capital (34.9) (23.1)
Current tax (4.2) (4.5)
Net assets 61.3 73.1
Equity shareholders’ funds 61.3 73.1
Non-controlling interests - -
Total equity 61.3 73.1
Results for the period ended 31 March 2018Outlook 14 Headwinds • DWP contract reduction £4m • Yodel renegotiation, second year impact £1m Growth drivers from a base of £47.9m • Further PayPoint One rollout to 12,400 outlets and mix improvement • Card services; volume growth • Pipeline of parcel deals; volume & revenue this year will be influenced by speed of implementation • MultiPay growth in clients and transactions • Romania; organic growth and Payzone integration synergies IFRS 15 impact (2017/18) • Revenue £1.0m - reduction • Cost £1.0m - reduction • Profit before tax - broadly flat Summary Despite these headwinds and whilst the final outturn for the forthcoming financial year will be influenced by the timing of and volumes from new parcel contracts, the Board anticipates a progression in profit before tax in this financial year as the growth drivers in our business continue to develop. Results for the period ended 31 March 2018
Embedding PayPoint at the heart
of convenience retail
PayPoint’s unique business model                                                                                        16

                                   Growing portfolio

                                                                                               Popular services for
                PayPoint One                    MultiPay                Parcels
                                                                                               customers, retailers and
                                                                                               clients, which increase
                                             Over the counter
                     ATM
                                              bill payments
                                                                        Top-ups                engagement

                                             UK & Romania
     Differentiated                                          Robust             24/ 7
                                    Retailer
       & resilient                                         settlement         Operational
                                    support
      technology                                            systems            support         Low cost, scalable and
                                                                                               technologically
                                                                                               advanced platform

                                                                                               Consistent value
       Healthy                   Strong cash               Investment in          Attractive   creation for
       margins                   generation                  innovation           dividends    shareholders

Results for the period ended 31 March 2018
Strong portfolio of products drives strategic priorities 17
Cash generation
Illustrative
Over-the-
Top- counter
ups bill Parcels
payments
ATM
PayPoint One
ecosystem
Romania
Decline
Multi Growth
-Pay
Current position of priorities
Omnichannel payments future Innovation
Retail services future
Investment
Results for the period ended 31 March 2018Convenience is the place to be and growing 18
Behavioural change
• Consumers want convenience,
variety and choice, whether online
or close to home
Growing market
• Forecast to grow by £7bn by 2022,
along with online and discounters Independent retailers*
67%
Independent retail opportunity Multiples
• Represent 67% of the convenience 33%
market, yet only a third have EPoS
PayPoint increases retail value PayPoint
opportunity value
* Of which
• Move to heart of store, providing
34% are
technology that helps retailers run affiliated to a
their whole store profitably and symbol group
efficiently
Source: William Reed Grocery Retail Structure 2017 & IGD 2017. The Retail Sectors that are
included are Convenience, Forecourts, Supermarkets, Specialist CTN & Specialist Off-licences.
Results for the period ended 31 March 2018 Includes symbols managed as a multiple Group. Excludes non-retail locations.Strong progress on PayPoint One 19
• What we have achieved 31 Mar 18 31 Mar 17
− Growth to over 9,000 stores (as of Total 8,550 3,601
21 May 2018) with continued rollout
over next 12 months EPoS Base 3,718 1,421
− EPoS Pro version launched offering £10/week
full stock management EPoS Core 4,678 2,180
£15 or £20/week
− Supplier links to Nisa and Booker
agreed, along with launch of ‘News EPoS Pro 154 3 (pilot sites)
£30/week
Management’
Average
− Innovative mobile app launched £14.68 £13.94
service fee
enabling retailers to have their ‘store
in their pocket’
New products
and services e.g. Market access
• Future ecosystem development IOT for store
− Continued rollout and usage focus
e.g. scanning
− Continued enhancements delivering Enhance
value to independent retailers e.g. Improve
in-store
profitability
iOS app, multisite management, experience
further supplier links
− Unlocking data insights to support
retailers, FMCG companies and
Footfall &
industry commentators Business
Commission
insights
Income
Results for the period ended 31 March 2018Retail flexibility provided by our stock app 20 Results for the period ended 31 March 2018
Value of EPoS to a typical store                                                                           21

 A typical store turnover is £1.2m per annum and invests £20,000 in stock

 There are 5 key areas where EPoS can help retailers:
 1. Margin management                                        Increasing to 20% would drive
        − Average margin achieved in store is £3,000 per   £1,000 improved margin per stock
          stock turn (15%)                                                turn

 2. Stock turn                                             If that could be improved by 1 week,
        − On average it take 3 weeks to turn the stock     the retailer could be c.£70,000 per
                                                                      annum better off

 3. Shrinkage
        − Average revenue lost = £14,760 (1.2%)

 4. Wastage                                                Just a 10% improvement in managing
                                                           these three areas with EPoS data can
        − Average revenue lost = £38,400 (3.2%)
                                                              bring a c.£10,000 benefit to
                                                                          retailers
 5. Out-of-stocks
        − Average revenue lost = £49,200 (4.1%)

                                                           1. Source: Global Retail Theft Barometer 2016
Results for the period ended 31 March 2018
                                                           2. Source: Order Dynamics
Strategic priorities 22
Delivering today Preparing for tomorrow
Sustain leadership
Embed PayPoint at PayPoint becomes
in ‘pay as you go’, Innovate for future
the Heart of the definitive parcel
OTC & grow digital growth & profits
Convenience Retail point solution
Bill Payments
• Link OTC cash trial
• Deliver CRM: IT & business change
• Card payment net
• Deliver new product & technology agile
settlement
organisation
Our people and • T4 for Romania
• Integrate Payzone Romania
organisation • PayPoint One
• Continue to develop a performance based
ecosystem
culture; with focus on empowerment and
• Direct Debit for
customer service
MultiPay
Our values
Results for the period ended 31 March 2018Delivery roadmap 23
May 2018 May 2019 Future
Products
T2 Sunset
PP1 9000 12400 Rollout completed
T4 Romania deployment
iOS app
EPoS IOT for store e.g. fridges Data/supply chain management
LINK OTC Trial
ATM
Cards Net settlement
Peak 18 Peak 19
Parcels Carrier 1 Carrier 2 Carrier 3
MultiPay Direct Debit 2nd PSP
Service and
Organisation
Delivery Phase 1 Phase 2
CRM
IVR
Q1 Q2 Q3 Q4 Q1 Q2 Q3 Q4
Customer service
improvements
Agile adoption
Results for the period ended 31 March 2018PayPoint uniquely placed to grow 24
Business Market Delivery
Model
+ Opportunity
+ Roadmap
=
PayPoint uniquely placed to benefit
from market growth
Results for the period ended 31 March 2018Summary 25
• Good FY 17/18 financial performance
• Business reshaped and well positioned for future growth
• Clear strategy in place to capture market opportunities, across
a strong portfolio of products
• Company reorganised to enable faster and more efficient
innovation
• Prioritised capital allocation framework with a commitment to
attractive shareholder returns
Results for the period ended 31 March 2018Appendices
Appendix 1
Strategic priorities
1. Embed PayPoint at the heart of convenience retail                                                               28

•       What we have achieved                                             31 Mar 18            31 Mar 17
        − Growth to over 9,000 stores (as of            Total                 8,550                 3,601
          21 May 2018) with continued rollout
          over next 12 months                       EPoS Base                 3,718                 1,421
        − EPoS Pro version launched offering           £10/week

          full stock management                     EPoS Core                 4,678                 2,180
                                                    £15 or £20/week
        − Supplier links to Nisa and Booker
          agreed, along with launch of ‘News         EPoS Pro                  154            3 (pilot sites)
                                                       £30/week
          Management’
                                                     Average
        − Innovative mobile app launched                                      £14.68               £13.94
                                                    service fee
          enabling retailers to have their ‘store
          in their pocket’
                                                           New products
                                                          and services e.g.            Market access
•       Future ecosystem development                        IOT for store
        − Continued rollout and usage focus
          e.g. scanning
        − Continued enhancements delivering          Enhance
          value to independent retailers e.g.                                                        Improve
                                                     in-store
                                                                                                   profitability
          iOS app, multisite management,            experience
          further supplier links
        − Unlocking data insights to support
          retailers, FMCG companies and
                                                                 Footfall &
          industry commentators                                                         Business
                                                                Commission
                                                                                        insights
                                                                  Income
    Results for the period ended 31 March 2018
2. PayPoint becomes the definitive parcel point solution 29
• Best network and brand
− Network was grown from just over 6,000 to over
7,400 sites across the UK
− Tesco have opened over 400 locations along with
over 700 in McColls
− Trusted brand (Trust Pilot: 9.2 out of 10)
− Opportunity to serve other carrier networks –
discussions progressing well
• Pipeline of new carrier deals
− At least 1 in place for peak 2018
− Plan to grow the business to be handling 60m 3% 2%
3% Royal Mail
parcels p.a. within 5 year plan (from 24m 17/18) 3%
3% Hermes
4% DPD
• Operational preparedness for multicarrier
TNT / Whistl
− Developing a range of service and UX 5% 42%
Yodel
improvements, including a new retailer app 6%
DX
− Up-skilling stores, who are overwhelmingly positive 6% Parcelforce
about the move to multicarrier UK Mail
10%
− Increasing network reach, enhancing consumer 13% Amazon Logistics
experience and driving extra footfall into stores UPS
Results for the period ended 31 March 2018 Source: IMRG 2017 - market share based on the volume of parcels delivered3. Sustain PAYG and grow digital bill payments (UK) 30
• Remain market leader in PAYG and over-
the-counter bill payments
− TV Licensing – new long term agreement
− All major clients retained with good
contractual/relationship stability
− Stable/increasing market shares
− More than 20 new clients added during the year,
across a range of sectors and services
• Margin improvements
− High focus on margin improvements – 9%
volume decline vs. 1% net revenue increase
− Strong performance of smaller clients supporting
this dynamic, particularly in energy sector
• Digital is our engine of growth (MultiPay)
− App usage leading the channels with 112%
growth in 17/18 (Mar 17 Vs Mar 18)
− Plan to launch Direct Debit functionality
− Integrate new PSP (Payment Service Provider)
Results for the period ended 31 March 20184. Grow our Romanian business 31
• Strong country opportunity
Net revenue £m
− Cash has a 90% share of household payments
− Growing economy; GDP growth of 4.6%, driven by 11.9
consumption 9.2
− Online growing but yet to take hold 6.8 7.0
− eCommerce yet to kick off – potential cards and
parcels opportunity
• PayPoint has an advantaged market position 2014/15 2015/16 2016/17 2017/18
− PayPoint strong consumer brand with 75% recognition
− PayPoint share of bill payments growing as Post
Office and banks retrench
− Payzone integration progressing
• Romania future platform for strong growth
− Optimise PayPoint and Payzone networks and extend
product and service offerings across the network
− Integrate back offices and save cost
− Developing a T4 terminal to replace legacy to include
integrated card payments
− Grow value add Retail services – Card services, money
transfer, EPoS
Results for the period ended 31 March 20185. Innovate for future growth and profits 32
Over-the-counter cash Card payment
T4
trial with LINK Net Settlement
• Trial of over-the-counter • Expansion of net settlement • Slimline terminal for
cash withdrawal service in proposition to 10k card deployment in Romania
15 stores payment customers • Includes card payment
• Bolster customer choice • Help retailers reduce banking capability
and access to free charge burden
withdrawals
• Unique ability to withdraw
exact amounts, to nearest
penny
Timings: Timings:
Timings:
Trial Summer 2018, Rollout Spring 2019
Trial in Summer 2018
Autumn 2018
Results for the period ended 31 March 2018Appendix 2 Local shop economics
Changing consumer behaviour                                                                        34

Big changes over last 10 years:

•    Shift from ‘big, weekly’ shop to ‘top up, little and often’ shopping
•    Planned shopping down 9% but distress purchases up 5%
•    ‘Meal for tonight’ mission +6% but huge regional differences
     (7.2% of visits in London, 1.7% in Wales)
•    11% drop in news category but 5% growth in services

Shopper demands growing, retailers need data and analysis to
keep up:

•    Convenience retail under-delivering on speed of service and
     value for money
•    Shop spend can grow up to 42% with a positive in-store
     experience and tailored product range
•    Diverse shopper needs and missions to cater for with multiple
     repeat visits each week

Results for the year ended 31 March 2018                                    Source: HIM CTP 2017
Local shop economics 35
Anatomy of a typical convenience store: Value that PayPoint brings to local stores:
• £1.2m p.a. turnover • Average of 1,200 consumer visits per month
• Annual gross profit of 20% of turnover • Over 60% of PayPoint shoppers also bought
• c. 1000 square feet shop items
• Average investment of £6-8k on store • £8.78 basket spend vs. £6.13 convenience
shopper average
• Average net profit c. £20,000 p.a.
• £37.75 average spend per week vs. £22.07
convenience average
Average cost breakdown
3% 2%
6%
12%
77%
Product for sale People costs Rent and rates Energy costs Wastage
Results for the year ended 31 March 2018 Source: ACS and Said Business School 2015, HIM CTP 2017Value of EPoS to a typical store 36
A typical store turnover is £1.2m per annum and invests £20,000 in stock
There are 5 key areas where EPoS can help retailers:
1. Margin management Increasing to 20% would drive
− Average margin achieved in store is £3,000 per £1,000 improved margin per stock
stock turn (15%) turn
2. Stock turn If that could be improved by 1 week,
− On average it take 3 weeks to turn the stock the retailer could be c.£70,000 per
annum better off
3. Shrinkage
− Average revenue lost = £14,760 (1.2%)
4. Wastage Just a 10% improvement in managing
these three areas with EPoS data can
− Average revenue lost = £38,400 (3.2%)
bring a c.£10,000 benefit to
retailers
5. Out-of-stocks
− Average revenue lost = £49,200 (4.1%)
1. Source: Global Retail Theft Barometer 2016
Results for the period ended 31 March 2018
2. Source: Order DynamicsAppendix 3 PayPoint One
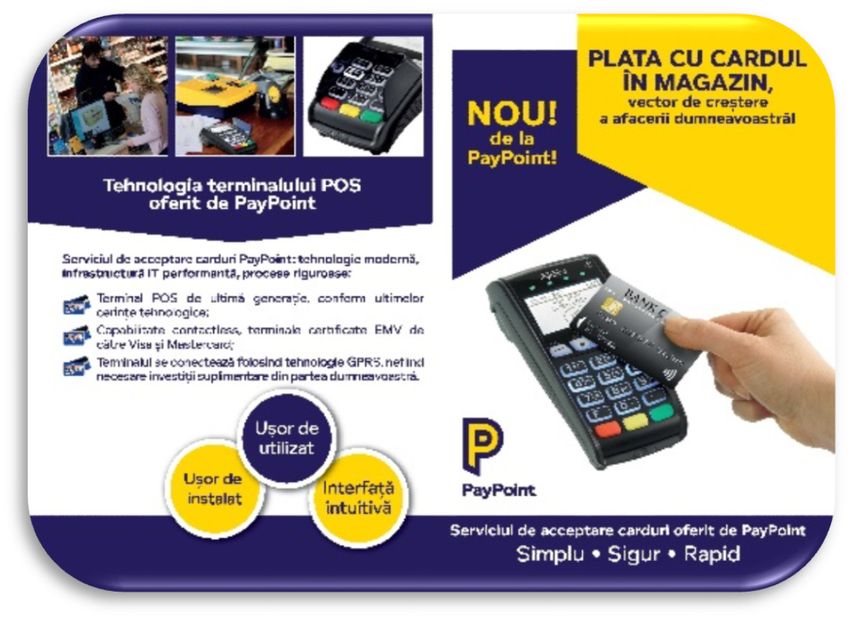
PayPoint One                                                                  38

                                Everything a modern convenience store needs

      Contactless Card Payments

     Parcel – pick up and drop off

                     Bill Payments

                             EPoS

          Future proof technology

Results for the period ended 31 March 2018
Platform that grows with your business 39
Pro
Core
Base
Launched Nov 2017
Launched
Usage
2016
T2 Mobile App
Launched Nov 2017
Cash Front of store Complete
Legacy register EPoS EPoS
Results for the period ended 31 March 2018EPoS: Base, Core, Pro 40
Base Core Pro
£10** per week £15** / £20* per week £30 per week
• PayPoint services-footfall • PayPoint services-footfall • PayPoint services-footfall
Attract • Enhanced service (scanning) • Enhanced service (scanning)
• Clear pricing & promotions • Clear pricing & promotions
customers
• Cash register • Cash register • Cash register
Business • Sales & margin reports • Sales & margin reports
• Wastage & shrinkage tracking
insights • Payment type analysis
• Integrated pin pad • Integrated pin pad • Integrated pin pad
Store • Range tagging • Range tagging
• Stock management & symbol
efficiency links
• News management
• PayPoint benefits-commission • PayPoint benefits-commission • PayPoint benefits-commission
Cost • No upfront fees • No upfront fees • No upfront fees
benefits • Free updates • Free updates • Free updates
• Accounting benefits
** Existing customers
* New customers PayPoint mobile app
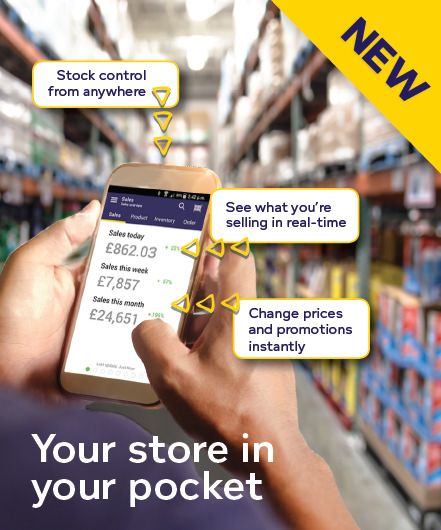
Results for the period ended 31 March 2018EPoS: Mobile App 41
Allowing retailers to:
• See sales in real time
• Change prices and promotions
instantly
• Control stock from anywhere
Available to all
PayPoint One users
with functionality aligned
to their EPoS package
Results for the period ended 31 March 2018Positive customer feedback 42
How do you find PayPoint One to use?
How likely are you to recommend PayPoint One to another retailer?
from an outbound telephone customer satisfaction survey of 100 PayPoint One users
Results for the period ended 31 March 2018You can also read