RESULTS PRESENTATION for the six months ended 31 August 2019 - www.deltafund.co.za - Delta Property Fund
←
→
Page content transcription
If your browser does not render page correctly, please read the page content below

RESULTS PRESENTATION
                                 for the six months ended 31 August 2019

P RO P ERT Y F U N D

           www.deltafund.co.za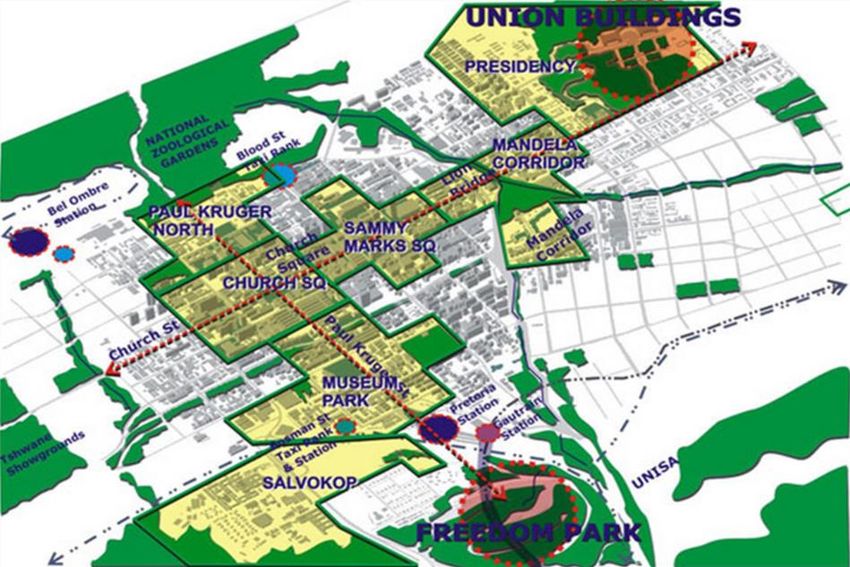
AGENDA                                                P RO P ERT Y F U N D

  01    Introduction and Business Update

       02    Financial Review

            03      Operational Review

                 04       Conclusion

                       05       Questions & Answers

                             06          Annexures
P RO P ERT Y F U N D

www.deltafund.co.za

                       INTRODUCTION AND
                         BUSINESS UPDATE
                                     Sandile Nomvete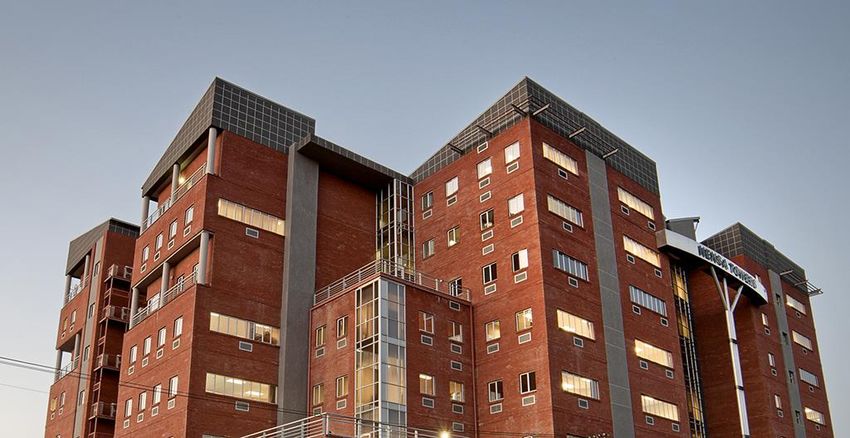
INTRODUCTION TO DELTA
Assets under Highly Sovereign
management of empowered fund underpinned
JSE listed REIT
R11.3bn Level 2 80.7%
B-BBEE
By 100% black-owned asset manager Rating on new sector codes of revenue from sovereign tenants
Net asset value Average property Dominant in
value of
Pretoria &
R9.29 R109.7m Durban CBDS
(Feb 2019 : R9.30) (Feb 2019 : R109.1m)
RESULTS PRESENTATION FOR THE SIX MONTHS ENDED 31 AUGUST 2019
4
BUSINESS UPDATE
Exceptionally difficult trading conditions continued during the reporting period, characterised by weak economic growth
and subdued investment within the economy. Policy uncertainty and protracted lease negotiations with DPW contributed
to Delta’s challenges during this period, however, we have made headway with lease renewals, signing on new tenants,
extending expiring debt facilities and successfully disposing of some assets held for sale
Considering the current tough trading environment, and cognisant of increased working capital and contractual capex
commitments on the back of new leases concluded, the board and management deemed it prudent to declare an interim
distribution of 12.19 cents per share
Leasing Progress
Initial total bulk lease renewals of 227 550 m2 submitted to DPW
• 95 523 m2 renewed during the reporting period
• The remaining balance of 131 086 m2 includes four leases of 96 502m2. Two of these leases aggregating
65 000m2 are in final stages of negotiation with approximately a third remaining under negotiation
Vacancies increased primarily due to loss of tenants at Capital Towers, UNISA and Bloemfontein
RESULTS PRESENTATION FOR THE SIX MONTHS ENDED 31 AUGUST 2019
5
BUSINESS UPDATE cont.
Debt Funding
Delta’s long-standing banking partners approved extensions totalling ca.R2.8 billion in expiring facilities during the
period, with further extensions concluded post interim reporting
Interest rates slightly more competitive than exit rates and are expected to normalise on conclusion of bulk renewals
Disposals
Management remains cognisant of the tough economic environment and will only announce unconditional
transactions
Several unsolicited offers have been received and are under consideration
BEE opportunities to acquire and secure long-term leases are prevalent in the market but access to funding seen as
barrier
RESULTS PRESENTATION FOR THE SIX MONTHS ENDED 31 AUGUST 2019
6
BUSINESS UPDATE cont.
Proposed Rebosis merger
In line with Delta’s strategy to introduce an element of bulk and diversification into its portfolio, we are continuing to
progress a proposed merger with Rebosis
To date the parties have made good progress with both Delta and Rebosis committed to the process
Key milestones that have been achieved:
• Preliminary due diligence has been completed
• Initial optimal capital structure has been determined
• Methodology on swap ratio determined
• Includes the funding gap to achieve an acceptable LTV level for the merged entity
• Preliminary meetings conducted with major shareholders/funders to obtain support for proposed merger terms
and for the potential capital raise. In this regard the major shareholders/funders are following internal evaluation
and approval processes before providing firm feedback
A more formal announcement on the specifics relating to the above will be made in due course
RESULTS PRESENTATION FOR THE SIX MONTHS ENDED 31 AUGUST 2019
7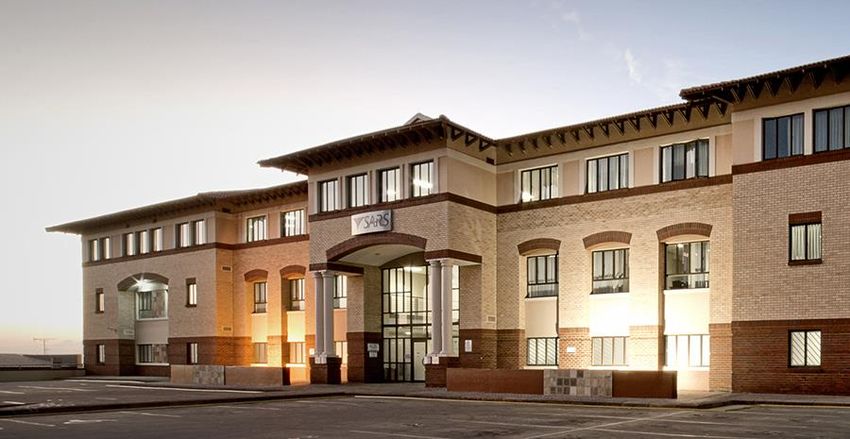
P RO P ERT Y F U N D

www.deltafund.co.za

                      FINANCIAL REVIEW
                                     Shaneel Maharaj
INTERIM PERFORMANCE 2020
Extended Loan to Interest
facilities totaling value of cover ratio
R2.8 billion 44.3% 1.9
(Feb 2019 : R2.1 billion) (Feb 2019 : 45.1%) (Feb 2019 : 2.1)
Debtors Property operating Fixed
managed at margin at debt of
28.0 days 67.2% 44.1%
(Feb 2019 : 31.0 days) (Feb 2019 : 67.8%) (Feb 2019 : 59.8%)
RESULTS PRESENTATION FOR THE SIX MONTHS ENDED 31 AUGUST 2019
9
FINANCIAL REVIEW

                                                               31 August 2019   31 August 2018   28 February 2019
Revenue (R’000)                                                      759 031          779 643          1 547 365
Net property income (R’000)                                          507 261          525 560          1 037 786
Finance costs (R’000)                                                296 522          248 604           537 281
Cost to income ratio - gross method                                    32.8%            32.0%             32.2%
Cost to income ratio - net method                                      17.8%            17.9%             18.3%
Investment property (R’000)                                        11 305 258       11 535 867        11 350 331
Investment in listed securities (R’000)                              417 669          453 468           461 822
Borrowings (R’000)                                                  5 210 232        5 121 953         5 258 471
Loan to value (LTV)                                                    44.3%            43.0%             45.1%
Weighted average interest rate                                         10.0%             9.3%             10.2%
Average debt expiry period (years)                                        0.6              1.1               0.8
Average debt fix expiry period (years)                                    3.3              1.1               2.1
Fixed : floating debt (excluding revolvers)                            44.1%            81.9%             59.8%
Net asset value per share                                              R9.29            R9.93             R9.30

RESULTS PRESENTATION FOR THE SIX MONTHS ENDED 31 AUGUST 2019
                                                                                                                    10
DISTRIBUTABLE INCOME STATEMENT
31 August 2019 31 August 2018 28 February 2019
Net property income (excl. straight line accrual) 514 775 540 423 1 072 090
Administration expenses (35 943) (46 672) (79 727)
Net finance costs (285 255) (235 906) (511 249)
Foreign exchange gain - 51 -
Dividend income – investment in GRIT 23 538 21 747 39 187
Other income 607 1 103 6 356
Antecedent interest - 476 569
Distributable income for the period 217 722 281 222 527 226
Number of shares in issue (’000) 714 230 713 793 714 230
Distributable earnings per share (cents) 30.48 39.40 73.84
Distributable earnings per share declared (cents) 12.19 39.40 55.39
RESULTS PRESENTATION FOR THE SIX MONTHS ENDED 31 AUGUST 2019
11ANALYSIS OF DISTRIBUTIONS DECLARED
HISTORIC DISTRIBUTION PER SHARE (CENTS)
H1 – Interim 23.1% 9.6% 15.6% 7.2% 8.7% 8.0% 7.1% 7.1% 7.1% 1.0% (1.0)% 0% (15.1)% (68.5)% (43.0)% (69.0)%
H2 – Final
Total – Full year
97.2 97.2
90.8
84.1
72.7
55.4
51.3 50.8
47.9 45.9 46.4
44.1 42.9
40.2 40.0 39.4
32.5
23.7
16.0
12.2
FY2013 H1 Aug-13 H2 Feb-14 FY2014 H1 Aug-14 H2 Feb-15 FY2015 H1 Aug-15 H2 Feb-16 FY2016 H1 Aug-16 H2 Feb-17 FY2017 H1 Aug-17 H2 Feb-18 FY2018 H1 Aug-18 H2 Feb-19 FY2019 H1 Aug-19
RESULTS PRESENTATION FOR THE SIX MONTHS ENDED 31 AUGUST 2019
12DISTRIBUTABLE EARNINGS BRIDGE
R’000
6 042 10 729
1 792 5 040
281 223 (51) (476) (497)
(12 250)
(24 479)
217 722
(49 349)
H1 Aug 2018 Dividend Net property Provisions Admin Foreign Antecedent Other income Disposals Vacancies Net finance H1 Aug 2019
income (Grit) income raised expenses exchange loss dividend costs
RESULTS PRESENTATION FOR THE SIX MONTHS ENDED 31 AUGUST 2019
13LIKE-FOR-LIKE NET PROPERTY INCOME ANALYSIS
%
Standing portfolio growth estimate (R’000) FY19 FY18
Change
Rental income 766 544 794 506 (3.5)%
Less: Property operating expenses (251 770) (254 083) (0.9%
Net rental income 514 774 540 423 (4.7)%
Less:
Net income from disposals in FY18 (833) (7 928)
Net income from disposals in FY19 (2 245) (3 516)
Like-for-like NPI calculation 511 696 528 979 (3.3)%
RESULTS PRESENTATION FOR THE SIX MONTHS ENDED 31 AUGUST 2019
14STATEMENT OF FINANCIAL POSITION
%Change
R’000 31 August 2019 31 August 2018 28 February 2019
(Feb 19 – Aug 19)
ASSETS
Non-Current assets 10 332 482 11 016 677 10 377 347 (0.43%)
Investment property 9 913 379 10 561 140 9 913 811 (0,01%)
Fair value of property portfolio 9 762 271 10 383 457 9 755 209 (0.07%)
Straight line rental income accrual 151 108 177 683 158 602 (0.43%)
Investment in other assets 417 669 453 468 461 822 (9.56%)
Other non-current assets 1 434 2 069 1 714 (16.32%)
Current assets 478 518 525 072 447 729 6.88%
Non-current assets held-for-sale 1 391 878 974 727 1 436 520 (3.11%)
Total assets 12 202 878 12 516 476 12 261 596 (0.48%)
EQUITY AND LIABILITIES
Total equity 6 635 452 7 084 784 6 641 445 (0.09%)
Liabilities 5 567 426 5 431 692 5 625 627 (0.94%)
Non-current liabilities 1 616 060 2 985 737 1 470 696 9.88%
Current liabilities 3 951 366 2 445 955 4 149 455 (4.77%)
Total equity and liabilities 12 202 878 12 516 476 12 261 596 (0.48%)
RESULTS PRESENTATION FOR THE SIX MONTHS ENDED 31 AUGUST 2019
15NAV BRIDGE
Rands
0.03
0.21
(0.03)
(0.06)
9.30 9.29
(0.16)
31-Aug-18 Contribution from Fair value of Net debt facilities Fair value of listed Dividend paid 31-Aug-19
operations financial raised instruments
instruments &
forex gains
RESULTS PRESENTATION FOR THE SIX MONTHS ENDED 31 AUGUST 2019
16DEBT SUMMARY
As at 31 August 2019
Weighted Ave.
Facility Type R’ m
Rate
Floating bank facilities 4 565 9.9%
Revolving bank facilities 648 9.6%
Total borrowings, net of accrued interest 5 213 9.9%
Accrued interest 9
Debt structuring fees amortized (12)
Total borrowings, including interest and fees 5 210
Interest rate swap contracts 2 020 7.8%
Total fixed 2 020
Fixed % (excluding revolvers) 44.1% 10.0%
RESULTS PRESENTATION FOR THE SIX MONTHS ENDED 31 AUGUST 2019
17GRAPHICAL DEBT ANALYSIS
SOURCE OF DEBT TOTAL: R5 213M DEBT CLASSIFICATION TOTAL: R5 213M
3.5% 12.4%
Floating Bank Facilities (R4 565m)
ZAR Bank Facilities (R5 029m) 0.0%
Fixed Bank Facilities (Rm)
USD Bank Facilities (R184m) Revolving Bank Facilities (R649m)
96.5%
87.6%
FINANCIER SPLIT TOTAL: R5 213M FIXED DEBT BREAKDOWN TOTAL: R2 020M
3.5%
Nedbank (R3 146m)
19.5%
Standard Bank (R868m)
Interest rate swap Contracts (R2 020m)
Investec (R1 016m)
16.6%
60.4% Bank of China (R184m)
100%
RESULTS PRESENTATION FOR THE SIX MONTHS ENDED 31 AUGUST 2019
18DEBT EXPIRY PROFILE
5000
4500
4000
3500
3000
Rand (million)
2500
2000
1500
1000
500
0
28-Feb-20 28-Feb-21 28-Feb-22 28-Feb-23 28-Feb-24 28-Feb-25 Total
Floating Bank Facilities Revolving/Liquidity Bank Facilities Swap Contracts
RESULTS PRESENTATION FOR THE SIX MONTHS ENDED 31 AUGUST 2019
19DEBT COMMENTARY
Extended R2.8 billion in expiring debt facilities during the period. These facilities were further extended
post the interim reporting period to year-end, with the intention for a permanent refinance once the DPW
lease renewals are concluded
The weighted average cost of debt decreased to 10.0% ( Feb 2019: 10.2%) with the interest cover ratio
at 1.9 (Feb 2019: 2.1)
Loan to value decreased to 44.3% ( Feb 2019: 45.1%), primarily due to improved cash resources and
settlement of debt facilities
The average debt facility expiry period and average fixed debt ratio decreased to 0.6 years (2019: 0.8 years)
and 44.1% (2019: 59.8%) respectively, impacted by the passage of time and short-term refinance of
facilities. We intend to term out the debt expiry profile and fix at least 75% of our debt once facilities
are refinanced
RESULTS PRESENTATION FOR THE SIX MONTHS ENDED 31 AUGUST 2019
20P RO P ERT Y F U N D
www.deltafund.co.za
OPERATIONAL REVIEW
Otis TshabalalaINTERIM PERFORMANCE 2020
Defensive Bulk lease renewal Total lease
Sovereign tenants proposal to DPW (PMTE) renewals in a
challenging environment
76.6% 44.3% 156 846m²
Gross lettable area (GLA)
(Feb 2019: 73.6%) Renewed 95 523m² (40 leases) by Aug 19 (Feb 2019 : 46 833m2)
Total new leases WALE increased to Weighted average
concluded (GLA) rental of
6 465m² 1.7 years R123.5 m²
(Feb 2019: R119.5m²
Retail and office other (Feb 2019 : 1.2 years)
RESULTS PRESENTATION FOR THE SIX MONTHS ENDED 31 AUGUST 2019
22GEOGRAPHICAL AND GRADE SPLIT
GLA - BY BUILDING RENTAL - BY BUILDING
Gauteng (41.2%) Gauteng (45.2%)
Kwazulu-Natal (29.8%) Kwazulu-Natal (23.4%)
Free State (9.2%) Limpopo (9.9%)
Limpopo (4.8%) Free State (6.0%)
Western Cape (4.5%) Western Cape (5.2%)
Northern Cape (4.0%) Northern Cape (3.7%)
Mpumalanga (3.2%) Eastern Cape (3.3%)
Eastern Cape (2.5%) Mpumalanga (2.6%)
North West (0.6%) North West (0.5%)
OFFICE GRADE - BY GLA OFFICE GRADE – BY RENTAL
A (15.5%) A (21.4%)
B (84.2%) B (78.5%)
C (0.3%) C (0.1%)
RESULTS PRESENTATION FOR THE SIX MONTHS ENDED 31 AUGUST 2019
23PORTFOLIO BREAKDOWN
Office -
Office - Other Industrial Retail Total
Sovereign
Number of properties 81 16 3 3 103
Gross lettable area (m2) 1 576 478 108 916 11 177 56 481 753 052
Income (R’ 000) 75 052 9 877 7 115 1 006 92 996
Vacancies Including assets held for sale (%)2 14.2 34.2 54.4 5.9 19.3
Value ( R billions) 8.7 2.1 0.2 0.3 11.3
Average rental (R/m2) 130.2 90.4 90.0 125.0 123.5
Weighted average escalation (%) 6.7 7.4 8.0 7.5 6.8
Weighted average lease expiry (by GLA) (years) 1.4 1.9 0.0 2.6 1.7
Cost to income ratio (net) (%) 11.9 23.4 6.8 27.5 17.8
Cost to income ratio (gross) (%) 27.9 46.2 18.9 47.4 32.8
1 The GLA was previously reported by building classification and included vacancies, it is now represented by tenant type. Total GLA including vacancies of 179 553m2 is 932 605m2
2 Vacancies are classified by building type which is based on the majority tenant type within each building
RESULTS PRESENTATION FOR THE SIX MONTHS ENDED 31 AUGUST 2019
24DETAILED TENANT BREAKDOWN
TENANT PROFILE BY GLA TENANT PROFILE BY RENTAL
1,1%
7,6% 1.1%
1.5%
7.6%
Office - Sovereign 10,6%
7.5% National Government
10.6%
14.5% 40.3%
41.6% Office - Other Provincial 7.5%
Government
7.3% Retail Local Government
12.1%
76.5% Industrial State-Owned 80.7%
13.1% Enterprise
20.8%
14.5%
2
Excludes vacancies. Total occupied GLA = 753 052m
RESULTS PRESENTATION FOR THE SIX MONTHS ENDED 31 AUGUST 2019
25OPERATIONS AT A GLANCE
It is a tough time for our sector, as we battle to halt rising vacancies as well as rental reversions
Most tenants are adopting ultra conservative approaches by optimizing their real estate needs
We have managed to secure a significant number of leases notwithstanding tenants negotiating on lower
rental and escalations
The cost of relocation including fit out is a significant capital expenditure, therefore, most tenants prefer to
negotiate lower rental terms as opposed to moving
However, the competition for tenants is quite aggressive as some landlords are carrying the cost of
relocations and offering 12-month rent free periods and flat rentals as well as low rentals in their quest to
attract tenants into their buildings
RESULTS PRESENTATION FOR THE SIX MONTHS ENDED 31 AUGUST 2019
26DPW UPDATE
There is a great need for DPW leasing policy certainty to bring back much needed
confidence in our sovereign sector
o A meeting with the DPW Minister, SAPOA and landlords of significance is in the pipeline.
Notwithstanding , Delta is continuing engagements with the Minister’s office and Senior Managers in
the department regarding the bulk renewals and arrears
DPW debtors
o High level meeting held between DPW, SIU, Delta Senior Management and DPW Auditors (O.M.A.)
o Significant progress is being made in resolving arrear payments that are historic in nature
Government treatment of rates and taxes
o SAPOA & IPD engagement on non-payment of rates & taxes – Part of discussion with DPW Minister &
SAPOA
o Impact on rental and ability of Government landlords to create sustainable profit
o Potential payment of increases
RESULTS PRESENTATION FOR THE SIX MONTHS ENDED 31 AUGUST 2019
27LEASING UPDATE - SOVEREIGN TENANTS
Bulk renewal progress
Initial submission - 227 550 m²
Tenants vacated - Stats House Nelspruit (892m²), balance of bulk renewal of 226 609m 2
40 Leases signed to date totalling 95 523m² (67.6% - 5 years, 29.7% - 3 years, 2.7% - 1 year)
While our Bulk Renewals look daunting at just under 130 000m2 remaining, there is a concrete plan in place to reduce
this significantly by the end of the year
Focusing on the 4 major leases hereunder, which have been escalated to Senior Management and Ministerial level, will
see our bulk renewals backlog considerably reduced resulting in us accomplishing over 80% of the Bulk Renewals
DEFAULT LEASES - SENT TO MINISTER
Poyntons DCS 35 981 Dept of Correctional Service 3-5 years
Poyntons Defence 24 268 SANDF 3-5 years
Hallmark 22 885 Dept of Home Affairs 3-5 years
Servamus 13 368 SAPS 3-5 years
96 502
RESULTS PRESENTATION FOR THE SIX MONTHS ENDED 31 AUGUST 2019
28BULK RENEWAL UPDATE
Building Name Area User Department Lease Term
LEASE AGREEMENTS CONCLUDED & SIGNED
Defence Force - Old Pretoria Road 2 504 Defence Force -Yard 5 Years
Defence Force Logistics 2 430 Defence - Logistics 5 Years
Mayors Walk 235 SAPS 5 Years
SAPS Flying Squad 1 125 SAPS Flying Squad 5 Years
2 Devonshire Place 5 117 DOJ&CD 5 Years
2 Devonshire Place 2 171 DOJ&CD 5 Years
Commissioner House 377 National Prosecuting Authority 5 Years
88 Field Street 6 157 National Prosecuting Authority 5 Years
Hollard House & Parkade 8 481 DOJ&CD 5 Years
WB Centre 638 DOJ&CD 5 Years
The Marine Building 1 348 SA Police Services 5 Years
Mayors Walk 297 Defence Force 5 Years
Defence Force Transport 841 Defence Transport 5 Years
Defence Force Headquarters 2 174 Defence Headquarters 5 Years
Military Hospital 3 000 Military Hospital 5 Years
WB Centre 747 SAPS 3 years
Tivoli 1 975 Home Affairs 5 Years
Domitek Building 877 SAPS 5 years
Classic Building 1 301 Arts & Culture Museum 5 years
22 & 24 George Lubbe Str 6 200 SAPS 5 years
Hatfield Forum East 3 644 Dept of Correctional Services 5 years
RESULTS PRESENTATION FOR THE SIX MONTHS ENDED 31 AUGUST 2019
29BULK RENEWAL UPDATE cont.
Du Toitspan 623 SAPS 3 years
SAPS – Ferreira Street 4 637 SAPS 3 years
88 Field Street 4 617 Dept of Water Affairs 5 years
Edgars Kroonstad 322 Dept of Correctional Services 5 years
Campus Building 3 488 Dept of Water Affairs 5 years
Azmo Place 5 225 Dept of Water Affairs 5 years
Absa United 3 779 SAPS 3 years
Du Toitspan 1 090 Dept of Correctional Services 3 years
Liberty Towers 1 350 Statistics South Africa 3 years
Liberty Towers 540 Department of Public Works 3 years
Liberty Towers 1 486 Statistics South Africa 3 years
The Marine Building 1 313 Indepe. Police Invstig. Directorate 3 years
SA Eagle 2 662 Dept of Land Affairs 1 year
Die Meent 3 171 SAPS 3 years
Standard Bank Unisa 500 Dept of Environmental Affairs 3 years
Continental Building 4 133 Dept of Water Affairs 3 years
WB Centre 461 Public Service Commission 3 years
Commissioner House, Bellville 3 447 SAPS 3 years
Shorburg 1 043 Department of Public Works 3 years
95 523
DEFAULT LEASES - SENT TO MINISTER
*Detail as per slide 28 96 502
DEFAULT LEASES
Balance of bulk renewal 34 584 3-5 years
226 609
RESULTS PRESENTATION FOR THE SIX MONTHS ENDED 31 AUGUST 2019
30LEASING UPDATE
Lease renewals concluded
For the six months ending 31 August 2019, lease renewals were concluded for a total GLA of 156 846m 2, to the value of R671 million
RAF has put out a tender for a 10 year lease for 7 200 m². Currently a tenant at Embassy Building – Durban
Mayors Walk Social Development has renewed 4 975 m² for 5 years post interim
SIU awarded Delta a 5 year tender for 2 200 m² for occupation of space in Liberty Towers Durban – commencement Dec 2019
The most notable renewals are :
Building Tenant GLA
SARS Bellville SARS 16 006 m²
Shell House Ethekwini Municipality 13 828 m²
Hollard House Dept of Justice 6 954 m²
22 & 24 George Lubbe SAPS 6 200 m²
88 Field Dept of Justice 6 157 m²
AZMO Place Dept of Water Affairs 5 224 m²
2 Devonshire Dept of Justice 5 117 m²
SAPS 4294 SAPS 4 637 m²
Total 64 123 m²
RESULTS PRESENTATION FOR THE SIX MONTHS ENDED 31 AUGUST 2019
31LEASING UPDATE cont. .
Several new leases were concluded measuring 6 400m2 to the value of R 21.5 million over the lease term
Prospective new deals:
SARS in Randburg have initiated discussions with regards to re-occupying 2 700m² of the 2nd floor that they previously vacated.
Discussions are at an advanced stage
Delta House - negotiations with a JSE- listed entity for 8 000m² for 5, 7 and 10-year lease, with an option to purchase the building
Tenant Retention
Tenant retention remains a significant focus for Delta
Tenant requirements higher due to higher nodal vacancies and include
o relocation costs, fit out costs, rent free periods
Agents are non-negotiable on commissions and demanding full SAPOA tariff
o some brokers in certain areas are demanding higher tariffs as the battle for tenants intensifies in nodes like Sunninghill and Bloemfontein and other
nodes where there is oversupply
Tenants now have representatives assisting them in the leasing process
There is push back on rent renewal rates and escalations
RESULTS PRESENTATION FOR THE SIX MONTHS ENDED 31 AUGUST 2019 32
32VACANCIES
Vacancies
Our total portfolio vacancies have increased to 19.3% due to the loss of some key tenants
• UNISA (JHB) in Unisa House – 9 069m2
• Department of Health (PMB) in Capital Towers – 13 485m2
• We are in advanced negotiations with replacement tenants
National office vacancies remain high (SAPOA Q2 2019: 11.3%)
• The two highest being the eThekwini Municipality at 13.5% and the City of Johannesburg at 12.9%
Solutions to fill up these vacancies are a work in progress
• Showrooms to advertise what we can offer on our premises
• Engaging active top brokers in the difficult nodes and incentivizing them with higher commissions
• Tenant Installation, tenant relocation costs and beneficial occupation
Vacancies by region
Region Total GLA Vacancy GLA Vacancy SAPOA
(m2) (m2) (%) (%)
Pretoria 274 065 26 164 10% 9%
Durban 231 936 45 026 19% 14%
Johannesburg 45 533 18 348 40% 13%
Bloemfontein 78 284 21 202 27% Not Available
RESULTS PRESENTATION FOR THE SIX MONTHS ENDED 31 AUGUST 2019
33VALUATIONS
Currently evaluating the entire portfolio as part of the due diligence on the proposed merger between Delta and
Rebosis
o Market related cap rates and discount rates are being applied
o In cases where higher than market rentals are being achieved, these rentals are being reverted to market rates to reduce the risk
on future earnings
As and when we conclude leases, we will revalue the respective property
Number of Properties Value Feb 2019
103 properties (R’000) R11 305 258
93 properties* (R’000) R10 401 230
*excluding assets held for sale (Bloemfontein portfolio not included)
RESULTS PRESENTATION FOR THE SIX MONTHS ENDED 31 AUGUST 2019
34DISPOSAL OF ASSETS
During the 2020 financial year, Delta sold Top Trailers site 1, for R45 million
Building
Property Classification Location GLA (m2) Sales price (R) Transfer date
Transferred 15 741 45 000 000
Top Trailers site 1 Industrial Wadeville, Johannesburg 15 741 45 000 000 09-May-19
As at 31 August 2019, Delta had approximately R1.39 billion non-current assets held for sale at book value. 1 sale agreements was
concluded for R33 million and an offer received for Protea Coin Cape Town for R10 million
Building Expected
Property Classification Location GLA (m2) Sales price (R) transfer Date
Broadcast House Office - Sovereign Mthatha, Eastern Cape 4 934 33 000 End Nov 2019
Sale agreements concluded 4 934 33 000
1 non-current assets under offer 5 700 10 000
7 other non-current assets held for sale 61 387 864 450
10 Bloemfontein non-current assets held for sale Office - Sovereign Bloemfontein Portfolio 59 427 483 400
TOTAL NON-CURRENT ASSETS HELD FOR SALE 131 448 1 391 870
RESULTS PRESENTATION FOR THE SIX MONTHS ENDED 31 AUGUST 2019
35DISPOSAL OF ASSETS cont.
Disposing of the Free State Provincial Government Portfolio continues to be a priority as vacancies continue to escalate
o Delta continues to work with reputable local brokers and have issued mandates to these brokers
Vacancies in Sunninghill remain a focus area with increased interest from prospective buyers, albeit at significant discounts to book
value
The sale of Block G to a PPP partnership has been delayed and further engagement is taking place.
The transfer of Broadcast House is imminent as the buyer has finally secured the lease which was holding up the sale
A new offer for Protea Coin Cape Town is under review with the sale agreement being finalised.
An offer from a JSE listed entity has been received for the purchase/leasing of Delta House with DD underway.
A JSE REIT submitted a letter of intent for the acquisition of Delta’s undivided share in Silverstream Building 3
o They have made a two-pronged offer with scenario 1 being Delta retaining their lease and scenario 2 being Delta cancelling the
lease and vacating
o A detailed investigation in the possible transaction is still being assessed by management
Delta has received an offer for one of the Bloemfontein assets which is currently under consideration
An unsolicited offer to purchase the Marine building was received from a blue-chip institution
o The prospective buyer is still conducting their due diligence
Unsolicited offers for SARS Randburg and SARS Bellville were also received from reputable property investors
o Management is reviewing these offers
RESULTS PRESENTATION FOR THE SIX MONTHS ENDED 31 AUGUST 2019
36CAPEX UPDATE
Capital Expenditure
Our main focus is on compliance and defensive expenditure
o predominantly to maintain the value of the properties and counter competition
Following the signing of the DPW leases TI and Capex will be required to comply with the Schedule C requirements and the improvement of tenant
spaces based on the lease agreements
DPW Bulk Lease Renewal LIFT HVAC STRUCTURAL OHS T /I Allowance TOTAL CAPEX
40 Leases signed 15 054 550 65 260 896 23 557 621 33 960 072 30 865 562 168 698 701
18 Leases outstanding 30 744 431 34 709 695 5 610 913 56 493 897 47 532 975 175 091 912
Total 45 798 981 99 970 591 29 168 534 90 453 969 78 398 537 343 790 613
The mentioned Capex programme will be supported with structured procurement principles and will require the following:
o Database of consultants for all regions where DPF are represented
o Database of suppliers with technical and financial strength for all regions
o Tender committee representative of the various business lines within DPF to assure industry compliance and uniform standards for all projects &
regions
Some of the projects undertaken which are complete or in progress are:
o Poyntons Fire Project - fire compliance is a key requirement for safety within the portfolio and the project includes installation of fire lobbies, fire
doors, fire hydrants and hose reels with the associated pumps and tanks. Anticipated completion Q3 FY20. Estimated spent R35m
o Dept of Justice - 2 Devonshire Place and Hollard House. TI installation and Schedule C compliance. Estimated spend R25 million, completion Q3 FY21
o SIU – Liberty Towers (Complete fit-out on behalf of tenant with limited TI contribution), estimated spend R6.5 million, completion Q1 FY21
RESULTS PRESENTATION FOR THE SIX MONTHS ENDED 31 AUGUST 2019
37GREEN BUILDING AND SUSTAINABILITY
Buildings consume a third of the world’s energy and are responsible for a fifth of global emissions
Over and above the usual initiatives like energy efficiency through efficient lighting and optimised HVAC
upgrades, water-saving interventions etc. , we have identified areas in our existing buildings where can
contribute towards this very important cause
We are in the process of introducing projects that will assist us in working towards a sustainable
environment. These include :
• Recyclable Waste Management
• Collaborating with other stakeholders such as soft services (cleaning) and technical services providers
to use environmentally friendly materials including painting, carpets and ceilings for our
refurbishment projects
• More initiatives are being looked at in order to enhance our goal towards reduced carbon footprint
RESULTS PRESENTATION FOR THE SIX MONTHS ENDED 31 AUGUST 2019
38P RO P ERT Y F U N D
www.deltafund.co.za
CONCLUSION
Sandile NomveteCONCLUSION
The national economic outlook remains challenging with investment levels expected to remain subdued
with a lacklustre outlook on future business conditions, especially in light of a possible further credit rating
downgrade
Management’s focus will continue to be on
• Concluding the remaining bulk lease renewals
• Formulating, planning and executing capex linked to TI and general building condition
• Refinancing of expiring debt and managing forward looking debt expiry profile
• Driving significant effort into disposals to reduce debt and generate cash for capex and working capital
• Filling vacancies across the portfolio
• Introducing an element of bulk and diversification into the portfolio through the proposed merger
with Rebosis
RESULTS PRESENTATION FOR THE SIX MONTHS ENDED 31 AUGUST 2019
40P RO P ERT Y F U N D
www.deltafund.co.za
THANK YOU
Questions & AnswersANNEXURES P RO P ERT Y F U N D
01 Government Precinct Pretoria
02 Top 10 properties by value
03 Lease Expiry Profile
04 Sectorial Split
05 GLA and vacancy reconciliation
06 Leasing Outlook
07 Growth / ReversionGOVERNMENT PRECINCT | PRETORIA
RESULTS PRESENTATION FOR THE SIX MONTHS ENDED 31 AUGUST 2019
43REPRESENTATION BY PROVINCE AND MAJOR TENANTS
BUILDINGS REPRESENTED BY PROVINCE REPRESENTATIVE TENANTS
No of Buildings GLA (m2)
Gauteng 34 384 559
KwaZulu-Natal 17 278 269
Free State 17 85 980
Mpumalanga 11 30 2521
Limpopo 7 44 885
Northern Cape 7 37 275
Western Cape 5 41 889
Eastern Cape 3 23 717
North West 2 5 780
TOTAL 103 932 605 Limpopo
Mpumalanga
Gauteng
North West
Free KwaZulu
State Natal
Northern
Cape
Eastern
Cape
Western
Cape
RESULTS PRESENTATION FOR THE SIX MONTHS ENDED 31 AUGUST 2019
44TOP 10 PROPERTIES
Forum Building Poyntons Liberty Towers Hallmark Building Delta Towers
Location Pretoria Location Pretoria Location Durban Location Pretoria Location Durban
Office - Office - Office -
Sector* Sector* Sector* Office - Other Sector* Sector* Office - Other
Sovereign Sovereign Sovereign
GLA 35 905 m2 GLA 73 396 m2 GLA 40 080 m2 GLA 26 255 m2 GLA 41 651m2
Valuation R673 mil Valuation R576 mil Valuation R426 mil Valuation R410 mil Valuation R405 mil
* Building sector determined by majority occupation of a tenant type. Some buildings have different types in occupation
RESULTS PRESENTATION FOR THE SIX MONTHS ENDED 31 AUGUST 2019
45TOP 10 PROPERTIES | CONTINUED
Isivuno House Embassy Building Hensa Towers The Marine NPA Cape Town
Location Pretoria Location Durban Location Polokwane Location Durban Location Cape Town
Office - Office - Office - Office -
Sector* Sector* Sector* Sector* Office - Other Sector*
Sovereign sovereign Sovereign Sovereign
GLA 23 694 m2 GLA 32 788 m2 GLA 13 675m2 GLA 24 676 m2 GLA 10 552 m2
Valuation R373 mil Valuation R336 mil Valuation R303 mil Valuation R261 mil Valuation R249 mil
* Building sector determined by majority occupation of a tenant type. Some buildings have different tenant types in occupation
RESULTS PRESENTATION FOR THE SIX MONTHS ENDED 31 AUGUST 2019
46LEASE EXPIRY PROFILE AT 31 AUGUST 2019
TOTAL PORTFOLIO - BY GLA TOTAL PORTFOLIO - BY RENTAL
Vacant (19.3) Month to Month (36.1%)
11.8%
10.4%
19.3% Month to Month (28.1%)
29 Feb 20 (9.5%)
2.4% 3.1%
29 Feb 20 (5.8%) 7.7%
7.1% 36.1% 28 Feb 21 (22.7%)
28 Feb 21 (17.1%)
8.4% 28 Feb 22 (10.5%)
10.5%
29 Feb 22 (8.4%)
28 Feb 23 (7.7%)
28.1%
28 Feb 23 (7.1%)
17.1%
9.5% 29 Feb 24 (3.1%)
29 Feb 24 (2.4%) 22.7%
5.8%
Beyond 29 Feb 2024 (11.8%) Beyond 29 Feb 2024 (10.4%)
RESULTS PRESENTATION FOR THE SIX MONTHS ENDED 31 AUGUST 2019
47SECTORAL SPLIT
GLA - BY BUILDING GLA - BY TENANT*
2.6% 2.6% 7.5% 1.5%
Office - Sovereign (73.6%) Office - Sovereign (76.5%)
Office - Other (21.0%) 14.5% Office - Other (14.5%)
21.0%
Retail (2.6%) Retail (7.5%)
73.8% Industrial (2.6%) Industrial (1.53%)
76.5%
RENTAL - BY BUILDING RENTAL - BY TENANT
2.8% 1.4% 1.1%
7.6%
18.6%
Office - Sovereign (77.2%) Office - Sovereign (80.7%)
10.6%
Office - Other (18.6%) Office - Other(10.6%)
Retail (2.8%) Retail (7.6%)
Industrial (1.4%) Industrial (1.1%)
77,2%
80.7%
*
Excludes vacancies. Analysis focuses on what category the specific tenant falls into, rather than the category of the building
RESULTS PRESENTATION FOR THE SIX MONTHS ENDED 31 AUGUST 2019
48LEASE EXPIRY BY GLA | SECTORAL TABULAR REPRESENTATION
Month to Beyond 29
Sector Month
29 Feb 20 28 Feb 21 28 Feb 22 28 Feb 23 29 Feb 24
Feb 2024
TOTAL
National Government 131 025 17 066 43 668 17 967 28 063 16 846 58 377 313 012
Provincial Government 55 669 16 754 12 368 15 750 1 876 - 6 820 109 237
Local Government 24 822 - 16 323 308 13 828 - - 55 281
State-owned Enterprise 16 091 1 063 40 895 14 236 7 824 2 834 16 005 98 984
Total Sovereign 227 607 34 883 113 254 48 261 51 591 19 680 81 202 576 478
Office – Other 17 604 12 320 38 629 18 514 6 970 410 14 470 108 916
Retail 6 073 6 971 7 432 11 958 7 181 2 203 14 662 56 481
Industrial 10 812 - 365 - - - - 11 177
Vacant - - - - - - - 179 553
262 097 54 174 159 680 78 733 65 741 22 293 110 334 932 605
RESULTS PRESENTATION FOR THE SIX MONTHS ENDED 31 AUGUST 2019
49WALE BY TENANT TYPE
WALE by Tenant Type
Total GLA WALE by GLA Revenue WALE by Revenue
Sector
(m2) (yrs) ( R’000 ) (yrs)
National Government 313 012 1.63 37 437 1.44
Provincial Government 109 237 0.76 19 358 0.66
Local Government 55 281 0.89 6 994 0.67
State - Owned Enterprise 98 948 1.85 11 208 1.76
Office - Other 108 916 1.92 9 877 1.87
Retail 56 481 3.90 7 115 2.61
Industrial 11 177 0.03 1 006 0.04
Vacant 179 553 0.00 0 0
TOTAL 932 605 1.67 92 996 1.38
RESULTS PRESENTATION FOR THE SIX MONTHS ENDED 31 AUGUST 2019
50GLA AND VACANCY RECONCILIATION
Properties (No.) Total GLA (m2) Vacant GLA (m2) Vacancy (%)
As at 28 February 2019 104 950 422 136 986 14.4%
Disposals (1) (15 741) -
Leases terminated - - 49 032
New letting of vacant space - - (6 465)
Adjustments:
Forum 1 - (5 098)
Chambers of Change 2 3 043
Other (21)
As at 31 August 2019 103 932 605 179 553 19.3%
1Forum Building remeasured & GLA decreased by 5 098m 2
2 Chambers of Change GLA confirmed to plans after handover from Propertuity liquidation
RESULTS PRESENTATION FOR THE SIX MONTHS ENDED 31 AUGUST 2019
51LEASING | OUTLOOK
Anticipated budgeted sovereign renewals
W.A. Expiry W.A. Proposed Escalation /
Sector No of Leases Total Area
Rate / m2 * Rate / m2 * (Reversion)
Leases on month-to-month or expiring by 29 February 2020
National government 19 136 166 120.91 96.87 (19.76%)
Provincial government 16 71 433 193.20 124.44 (35.59%)
Local government 3 24 632 167.60 113.74 (32.14%)
State-owned enterprise 11 17 085 114.95 101.15 (12.01%)
TOTAL 49 249 316 145.83 106.73 (26.69%)
*
All rentals quoted are gross rentals
RESULTS PRESENTATION FOR THE SIX MONTHS ENDED 31 AUGUST 2019
52GROWTH / REVERSION - Annexure
Total leases concluded 1 March 2019 – 31 August 2019
W.A Term W.A. Expiry W.A. Achieved Growth / W.A. Esc.
No of Leases Total Area (m2)
(months) Rate (R / m2) * Rate (R / m2) * (Reversion) achieved
Renewed leases # 81 156 846 44.99 100.77 94.46 (6.26%) 6.46%
Renewals by Sector
W.A. Term W.A. Expiry W.A. Achieved Escalation / W.A. Esc.
Sector No of Leases Total Area
(months) Rate / m2 * Rate / m2 * (Reversion) Achieved
National Government 40 95 523 51.52 98.50 90.46 (8.16%) 6.11%
Provincial Government 1 779 6.00 129.25 129.25 0.00% 0.00%
Local Government 1 13 828 36.00 92.00 95.00 3.26% 9.00%
State-owned enterprise 4 20 204 53.54 117.74 98.05 (16.72%) 5.33%
Industrial 4 11 177 16.00 83.34 90.01 8.00% 8.00%
Office – other 14 12 168 18.38 98.05 104.65 6.74% 6.98%
Retail 17 3 167 46.52 158.56 151.69 (4.33%) 8.00%
Total 81 156 846 44.99 100.77 94.46 (6.26%) 6.46%
*All rentals quoted are gross rentals
RESULTS PRESENTATION FOR THE SIX MONTHS ENDED 31 AUGUST 2019
53NOTES RESULTS PRESENTATION FOR THE SIX MONTHS ENDED 31 AUGUST 2019
NOTES

RESULTS PRESENTATION FOR THE SIX MONTHS ENDED 31 AUGUST 2019
You can also read