RESULTS PRESENTATION FULL YEAR ENDED 31 DEC 2017 - 22 Feb 2018 - HotCopper
←
→
Page content transcription
If your browser does not render page correctly, please read the page content below

RESULTS PRESENTATION
FULL YEAR ENDED 31 DEC 2017

                              22 Feb 2018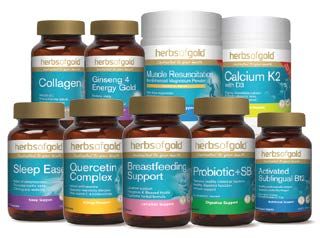
VITA LIFE SCIENCES OVERVIEW
•   Australian & Asia Pacific based pharmaceutical and healthcare over-the-counter business involved in the formulating,
    packaging, sales and distribution of vitamins and supplements
•   3 major consumer retail brands
•   750-800 registered SKUs of vitamins and supplements sold in 7 countries in Australia & Asia Pacific region:
      ‒   Herbs of Gold: sold in Australia, Malaysia and Singapore

      ‒   VitaHealth: sold in pharmacies, clinics and health food stores throughout Southeast Asia
      ‒   VitaScience: sold through independent pharmacies in Australia

•   430 employees in 7 countries
•   ASX listed since 2007 (ASX code: VLS)
FY 2017 - GROUP SUMMARY
•   Group sales of $37.7 million for the financial year (FY) ended Dec 2017, marginally lower (0.2%) than the previous
    corresponding period (PCP) of $37.8 million
•   Excluding share options expense of $0.9m, the Group recorded an EBIT of $5.6m (i.e. $4.7m after share options expense)
•   Net profit after tax of $2.8 million recorded for the financial year
•   Gross operating cashflow / EBITDA ( adjusted for non-cash option expense) of 100%
•   Returned $2.3m to shareholders through dividend payment and share buyback
•   Final fully franked dividend of 2.25 cents per share declared; total full year dividend of 3.75 cents per share
•   Period of transformational change and stability for the Group in the FY 2017 performance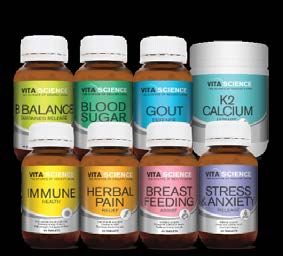
Key Financial Charts
                Revenue                                   EBIT*                         EPS*
                                               (A$m)                     (cps)
     (A$m)
     40                                        6
                                                                         7

     35
                                                                         6

     30
                                               4                         5
     25
                                                                         4
     20

                                                                         3                     6.06
     15
                                               2                                 4.89

     10                                                                  2

      5                                                                  1

      0                                        0
                                                                         0
              2017           2016                      2017       2016
                                                                                 2017          2016

  * Including share options expense of $0.9m
FULL YEAR 2017 RESULTS
        2017 revenue by geography                2016 revenue by geography

                        Other Asia   Australia                          Other   Australia
                           7%          41%                               Asia     41%
                                                                         6%
            Singapore
               17%                                       Singapore
                                                            17%

     Asia                                        Asia
     59%                                         59%

                                                             Malaysia
                  Malaysia                                    36%
                   35%

            Total revenue: $37.7m                       Total revenue: $37.8m
SEGMENT RESULTS
Revenue (A$m)
AUSTRALIA
16.0
12.0 H2 H2
8.0
Sales revenue: $15.6m (2016: $15.6m)
Revenue base business was sustained in a highly 4.0 H1 H1
competitive Australian market.
-
Export sales from Australia to China were slower
2017 2016
than expected
EBIT (A$m)
Gross margins remained steady
4.0
EBIT $3.4m (2016:$3.9m)
3.0 H2
EBIT down by 13% against FY16 due to higher
H2
overheads and higher investment in the Australian
2.0
business with a some shift in regional costs from
Malaysia to Australia
1.0 H1
H1
-
2017 2016Revenue (A$m)
SEGMENT RESULTS 16
MALAYSIA 12
8
H2 H2
4
Sales $13.2m (2016: $13.5m) H1 H1
Revenue base increased by 6.7% in local currency but it was impacted by the 0
weaker Malaysian ringgit (2017 average A$1: MYR 3.2971 [2016: MYR 3.0072]) 2017 2016
EBIT (A$m)
Increase in revenue of 98% in local currency from the Herbs of Gold brand due
to continued support from an exclusive distribution partnership agreement
2
MLM operation was suspended resulting in a smaller revenue contribution and
lower margin
EBIT $ 1.7m (2016: $1.8m) H2 H2
Margins were affected marginally due to competitive market forces and higher 1
sales in the newer market channels
H1 H1
0
2017 2016Revenue (A$m)
SEGMENT RESULTS
SINGAPORE
6
H2 H2
4
2
H1 H1
Sales $6.5m (2016: $6.5m)
Revenue base business was sustained in a highly competitive 0
market through a revised brand strategy. 2017 2016
The Herbs of Gold brand recorded strong growth of 119%
EBIT (A$m)
(PCP)
VitaHealth brand recorded a slight decline during this period
2
EBIT $1.4m (2016: $1.5m)
EBIT down due to higher A&P spending and a lower margin
recorded for the newer channels and brand expansion H2
1 H2
H1 H1
0
2017 2016SEGMENT RESULTS
OTHERS
Revenue (A$m)
Sales $2.5m (2016: $2.2m)
Revenue in other markets growth of 15% (PCP)
2
Stronger sales were recorded for Vietnam and Thailand H2
H2
compared to the PCP
Vietnam continues to perform to expectation and is
expected to grow faster leading into FY2018 H1 H1
Indonesia remains challenging and requires continued
0
investment and revised distribution pathways 2017 2016FINAL DIVIDEND & CASHFLOW
• Final dividend declared of 2.25 cents per share for FY 2017 (2016: 2.25 cents)
• Final dividend will be fully franked. Directors anticipate future dividends to be fully franked.
• Dividend reinvestment plan is currently suspended
Gross operating
Dividend (cps) cashflow to EBITDA
(cps)
4.0 100%
3.0 75%
2.0 50%
1.0 25%
0.0 0%
2017 2016 2017 2016Strategic Priorities and Outlook
• 2018 will be the second year of a three year strategic plan set to grow future revenues
• Increased advertising and promotional investment in core markets
• Increasing export sales to China utilising strategic partnerships
• Developing new distribution channels utilising both VitaHealth and Herbs of Gold brands
• South East Asia markets remain critical pathways and will receive continued investment to
support growth
• Increase brand investment may impact profitability in the short term with a view to increased
profitability in the medium term
• The Board will provide guidance mid-way through the yearAPPENDIX
APPENDIX 1 – PROFIT & LOSS
Full year ended Dec          2017   2016
                              $m     $m

Revenue                      37.7   37.8

EBITDA                       5.0    6.0

EBIT                         4.7    5.7

Profit before tax            4.7    5.6

Profit after tax             2.8    3.3

EPS (Basic – cents/ share)   5.21   6.06

Dividend (cents / share)     3.75   3.75
APPENDIX 2 – BALANCE SHEET
Balance Sheet as at Dec 2017 Dec 2016
$m $m
Current assets 22.3 21.7
Non-current assets 10.6 10.6
Total assets 32.9 32.3
Current liabilities 6.0 6.8
Non-current liabilities 2.1 2.3
Total Liabilities 8.1 9.1
Net Assets 24.8 23.2APPENDIX 3 – CASH FLOW
Cash Flow for the year ended 2017 2016
$m $m
Receipts from customers 40.8 41.6
Payments to suppliers and employees 34.8 36.2
Gross operating cash flow 6.0 5.4
Adjusted EBITDA (excluding share options expense) 6.0 6.0
Gross operating cash flow / EBITDA 100.0% 90.0%
Net interest (paid) / received 0 0
Income tax paid 2.8 0.7
Operating cash flows 3.2 4.7
Cash flows for investing 0.2 2.2
Net movements in equity 2.5 2.6
Cash flows from financing 0.5 (0.1)
Net foreign exchange differences 0.1 (0.2)
Net increase in cash reserves 0.6 (0.3)
Cash at beginning of period 9.4 9.7
Cash at end of period 10.0 9.4CONTACT Telephone: +61 2 9545 2633 Website: vitalifesciences.com Email: enquiries@vitalifesciences.com Head Office: 1/102 Bath Road, Kirrawee, NSW 2232
DISCLAIMER
This document has been prepared by Vita Life Sciences Limited (Vita Life Sciences) and comprises written material/slides for a presentation concerning Vita Life Sciences.

The presentation is for information purposes only and does not constitute or form part of any offer or invitation to acquire, sell or otherwise dispose of, or issue, or any solicitation of any offer to sell or
otherwise dispose of, purchase, or subscribe for, any securities, nor does it constitute investment advice, nor shall it or any part of it nor the fact of its distribution form the basis of, or be relied on in
connection with, any contract or investment decision.

Certain statements in this presentation are forward looking statements. You can identify these statements by the fact that they use words such as “anticipate”, “estimate”, “expect”, “project”,
“intend”, “plan”, “believe”, “target”, “may”, “assume” and words of similar import. These forward looking statements speak only as at the date of this presentation. These statements are based on
current expectations and beliefs and, by their nature, are subject to a number of known and unknown risks and uncertainties that could cause the actual results, performances and achievements to
differ materially from any expected future results, performance or achievements expressed or implied by such forward looking statements.

No representation, warranty or assurance (express or implied) is given or made by Vita Life Sciences that the forward looking statements contained in this presentation are accurate, complete, reliable
or adequate or that they will be achieved or prove to be correct, Except for any statutory liability which cannot be excluded, Vita Life Sciences and its respective officers, employees and advisers
expressly disclaim any responsibility for the accuracy or completeness of the forward looking statements and exclude all liability whatsoever (including negligence) for any direct or indirect loss of
damage which may be suffered by any person as a consequence of any information in this presentation or any error or omission therefrom.

Subject to any continuing obligation under applicable law or any relevant listing rules of the ASX, Vita Life Sciences disclaims any obligation or undertaking to disseminate any updates or revisions to
any forward looking statements in these materials to reflect any change in expectations in relation to any forward looking statements or any change of events, conditions, or circumstances on which
any statement is based. Nothing in these materials shall under any circumstances create an implication that there has been no change in the affairs of Vita Life Sciences since the date of this
presentation.
You can also read