Retail & Restaurant Market Analysis - Mack Avenue - Grosse Pointe Chamber of Commerce
←
→
Page content transcription
If your browser does not render page correctly, please read the page content below
Mack Avenue
Retail & Restaurant Market Analysis
                      Grosse Pointe & Detroit, Michigan

                                            Prepared for:
                    City of Grosse Pointe Park
                          City of Grosse Pointe
                  City of Grosse Pointe Farms
                  City of Grosse Pointe Woods
                                  City of Detroit
                                            Prepared by:
                         Gibbs Planning Group

                                     12 July 2016

TABLE OF CONTENTS

INTRODUCTION ..................................................................................................................           1

Executive Summary .............................................................................................................           1

Background ..........................................................................................................................     3

Methodology .........................................................................................................................     4

Trade Area ...........................................................................................................................    6

Demographic Characteristics ...............................................................................................               7

Tapestry Lifestyles ...............................................................................................................       9

Employment Base ................................................................................................................ 12

TRADE AREA CHARACTERISTICS ................................................................................... 14

Location ................................................................................................................................ 14

Access .................................................................................................................................. 15

Other Shopping Areas .......................................................................................................... 16

SUMMARY OF FINDINGS .................................................................................................... 19

2019 Supportable Retail and Appropriate Tenant Discussion .............................................. 21

Retail Category Definitions ................................................................................................... 21

Shopping Center Definitions ................................................................................................. 24

Rationale ............................................................................................................................... 25

Limits of Study ....................................................................................................................... 25

APPENDIX ............................................................................................................................ 27

Exhibit A: Primary Trade Area Business Summary .............................................................. 27

Exhibit B: Primary Trade Area Community Profile ................................................................ 29

Exhibit C: Primary Trade Area Housing Profile .................................................................... 35

Exhibit D: Primary Trade Area Dominant Tapestry Map and Descriptions ........................... 37

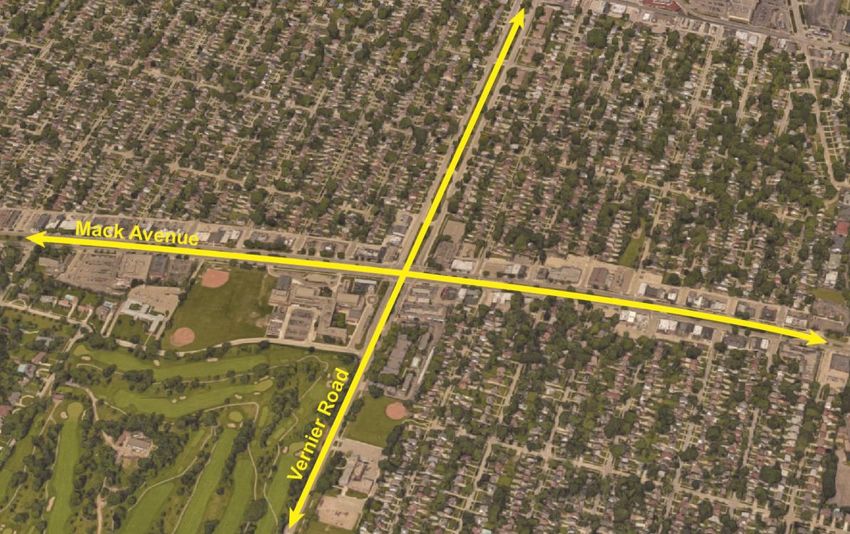
INTRODUCTION

Figure 1: Aerial photo of one of the key intersections of the Mack Avenue study area. In Grosse Pointe Woods, Mack
Avenue is within the municipal jurisdiction; for the remainder of the study area it serves as the border with Detroit.

Executive Summary
This study finds that the Mack Avenue study area can presently support up to 283,500 additional
square feet (sf) of retail and restaurant development, generating over $73.6 million in new sales. By
2021, household income growth in the primary trade area could increase the total captured sales to
$77.3 million. The demand could partially be absorbed by existing businesses and/or with the
opening of 80 to 105 new restaurants and stores.

Additional retail development in the study area can provide needed goods and services for the
existing surrounding consumer base of nearby residents, employees and regional visitors.
Furthermore, adding to the critical mass of retailers and restaurants in the study area can
increase the vibrancy of the study area and strengthen the pull of trade area consumers. Apart
from the still evolving downtown Detroit and suburban malls in Oakland and Macomb County, the
area is underserved by desirable shopping and an urban experience. The demographics of the
trade area represent a pent up market for a variety of retail offerings and Mack Avenue has
several advantageous locations to bring these retailers to the market. The leading categories of
supportable retail growth are grocery, general merchandise, electronics, department store
merchandise, sporting goods and pharmacy.

GPG understands the Grosse Pointe communities may be implementing a new high-speed fiber
optic cable network in the near future. Similar fiber systems in Chattanooga, Tennessee and
Kansas City, Kansas have generated significant booms in housing demand and have created
thousands of new jobs. While there is no data to forecast the network’s potential impact on
Grosse Pointe’s retail sales, new housing demand and job creation will likely generate a notable
increase in Grosse Pointe retail and restaurant sales beyond the estimates of this study.

Mack Avenue Retail Market Study                                                                                          1.
Gibbs Planning Group, Inc.
12 July 2016

The five Grosse Pointe communities, Grosse Pointe Park, Grosse Pointe City, Grosse Pointe
Farms, Grosse Pointe Woods and Grosse Pointe Shores, altogether cover 10.4 square miles,
bordered by Detroit on the south and west, Lake St. Clair on the east and south, Harper Woods
on the west and St. Clair Shores on the north. Grosse Pointe has many famous historic estates
and is home to many well-to-do professionals who work in Detroit and throughout southeastern
Michigan. With history dating back to the 1800s, Grosse Pointe has gained a reputation as a
notable American suburb with successful businesses, ample recreational activities, quality public
services and exceptional schools.

The study area is the approximate four-mile stretch of Mack Avenue from Alter Road to 8 Mile
Road. There are a number of contemporary shopping centers mixed with stretches of traditional
retail development. A wide variety of national, regional and local retailers exists along Mack
Avenue; however, there are a number of advantageous sites for future development. While there
are a number of opportunities for continued development within the existing Grosse Pointe Park,
City and Farms shopping areas, Mack Avenue presents an ideal location to attract new retailers
to the market and to improve the corridor for residents of Grosse Pointe and Detroit.

                                    Table 1: 2016 Supportable Retail

                                                Est. 2016          Est. 2016             Number
     Retail Category
                                              Supportable SF      Retail Sales           of Stores

     Retail
     Apparel & Shoe Stores                           14,100 sf          $2,891,750          9 - 12
     Book & Music Stores                              4,000 sf            $761,900           1-2
     Department Store Merchandise                    12,500 sf          $2,257,200           5-6
     Electronics & Appliance Stores                  13,100 sf          $4,270,500           5–6
     Furniture & Home Furnishings Stores             18,300 sf          $4,829,550           5-7
     General Merchandise Stores                      36,700 sf          $6,415,500          8 - 10
     Grocery & Specialty Food Stores                 56,800 sf         $19,885,850           3-5
     Jewelry Stores                                   5,400 sf          $2,013,750           3-4
     Lawn & Garden Supply Stores                      2,700 sf            $576,200           1-2
     Miscellaneous Store Retailers                   38,100 sf          $8,548,350         11 - 15
     Office Supplies & Gift Stores                    9,000 sf          $1,926,400           8-9
     Pharmacy                                        10,400 sf          $3,729,600           1-2
     Sporting Goods & Hobby Stores                   12,300 sf          $3,015,950           3-4
          Retail Totals                             233,400 sf         $61,122,500         63 - 84
     Restaurants
     Bars, Breweries & Pubs                           6,000 sf          $1,936,000          2-3
     Full-Service Restaurants                        15,300 sf          $4,275,600          4-5
     Limited-Service Restaurants                     20,600 sf          $4,439,750          7-8
     Specialty Food Stores                            8,200 sf          $1,836,000          4-5
     Restaurant Totals                               50,130 sf         $12,487,350        17 - 21
     Retail & Restaurant Totals                     283,500 sf         $73,609,850        80 - 105

This study further finds that the Mack Avenue primary trade area has a population of 151,600
persons, decreasing under current trends to 149,000 persons by 2021. Median household income
in the primary trade area is $50,000, which is similar to state and national figures. The average
household income is higher than state and national averages at $75,800, representing the
influence of high-wage earning individuals. The trade area is well educated, as 34.7 percent of
adults over the age of 25 have earned a bachelor’s degree or higher. Housing favors owner-

2.                                                                        Mack Avenue Retail Market Study
                                                                                Gibbs Planning Group, Inc.
                                                                                             12 July 2016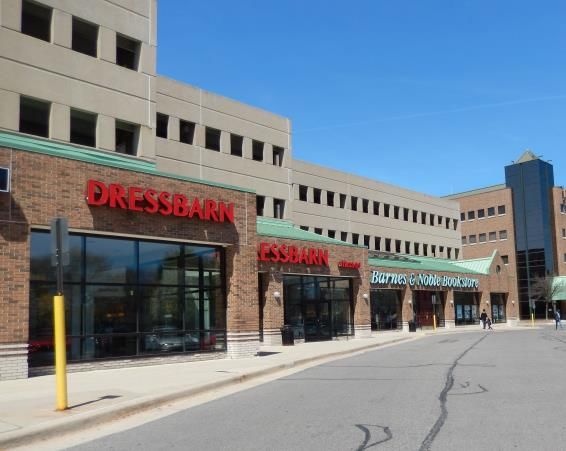
occupied units, which comprise 57.7 percent of all housing, compared to 25.2 percent renter-
occupied households; the vacancy rate is 17.1 percent. The primary trade area has a labor base
of 48,900 workers.
Figure 2: The Mack Avenue corridor runs through Grosse Pointe Woods and is the border between Grosse Pointe Park,
the City of Grosse Pointe, Grosse Pointe Farms and Detroit.
Background
Gibbs Planning Group, Inc. (GPG) has been retained by the Grosse Pointe communities to
conduct a retail feasibility analysis for an approximately four-mile stretch of Mack Avenue running
from Alter Road to 8 Mile Road. The area serves as an important corridor for residents of Grosse
Pointe, Detroit and commuters who use Mack Avenue. The vibrancy varies throughout the
corridor, but there are a number of valuable shopping centers and destinations as well as
advantageous sites for infill development or redevelopment. Many residents and public officials
instinctively see the opportunity for additional retail and restaurant development in the study area,
but have often been dismissed by potential retailers due to negative perceptions of bordering
Detroit and a limited market bound by Lake St. Clair (whereas other locations in the region are
surrounded by neighborhoods and therefore more consumers). This study is to serve as a third-
party assessment of the qualitative and quantitative characteristics of the Mack Avenue retail
market and to determine the amounts of additional retail and restaurant development that could
be supported in the study are over the next five years. GPG is conducting similar studies for
Grosse Pointe Village (City), Grosse Pointe Farms and Grosse Pointe Park.
GPG addressed the following issues in this study:
What is the existing and planned retail market in the study and trade area?
What is the primary trade area for the Mack Avenue study area?
Mack Avenue Retail Market Study 3.
Gibbs Planning Group, Inc.
12 July 2016
What are the population, demographic and lifestyle characteristics in the primary trade
area, currently and projected for 2021?
What is the current and projected growth for retail expenditures in the primary trade area,
now and for the next five years?
How much additional retail square footage is supportable in the Mack Avenue study area
and what retail uses should be encouraged? What sales volumes can development
achieve in or near the study area?
Figure 3: The Mack Avenue study area is just six miles from downtown Detroit making it a very popular destination for
downtown workers wanting to live in an established and proximate suburb.
Methodology
To address the above issues, GPG defined a trade area that would serve the retail in the study
area based on geographic and topographic considerations, traffic access/flow in the area, relative
retail strengths and weaknesses of the competition, concentrations of daytime employment and
the retail gravitation in the market, as well as our experience defining trade areas for similar
markets. Population, consumer expenditure and demographic characteristics of trade area
residents were collected by census tracts from the U.S. Bureau of the Census, U.S. Bureau of
Labor Statistics and Esri (Environmental Systems Research Institute).
Finally, based on the projected consumer expenditure capture (demand) in the primary trade area
of the gross consumer expenditure by retail category, less the current existing retail sales (supply)
by retail category, GPG projects the potential net consumer expenditure (gap) available to support
4. Mack Avenue Retail Market Study
Gibbs Planning Group, Inc.
12 July 2016
existing and new development. The projected net consumer expenditure capture is based on
household expenditure and demographic characteristics of the primary trade area, existing and
planned retail competition, traffic and retail gravitational patterns and GPG’s qualitative
assessment of the Grosse Pointe Park study area. Net potential captured consumer expenditure
(gap) is equated to potential retail development square footage, with the help of retail sales per
square foot data provided by Dollars and Cents of Shopping Centers (Urban Land Institute and
International Council of Shopping Centers), qualitatively adjusted to fit the urbanism and
demographics of the study area.
For the purposes of this study, GPG has assumed the following:
Other major community retail centers may be planned or proposed, but only the existing
retail is considered for this study. The quality of the existing retail trade in the study area
is projected to remain constant. Gains in future average retail sales per sf reflect higher
sales per sf in newly developed retail and selected increases in sales per sf by individual
retail categories.
No major regional retail centers will be developed within the trade area of this analysis
through 2021 for the purposes of this study.
The region’s economy will continue at normal or above normal ranges of employment,
inflation, retail demand and growth.
The subject site is properly zoned to support infill and redevelopment projects with current
and innovative standards, and the existing infrastructure (water, sewer, arterial roadways,
etc.) can support additional commercial development.
Annual population growth for the primary trade area is estimated to be -0.36 percent
throughout the five-year period of this study.
Employment distribution is projected to remain constant, without a spike or decline in
employment by NAICS categories.
The projected lease and vacancy rate model is based on our proprietary econometric
model of the relationship between changes in employment and changes in vacancy and
lease rates. Data was gathered from the U.S. Census Bureau, Esri, CBRE and local
brokerage services.
Any new construction in the study area will be planned, designed, built and managed to
the best practices of the American Institute of Architects, American Planning Association,
American Society of Landscape Architects, Congress for the New Urbanism, International
Council of Shopping Centers and The Urban Land Institute.
Parking for new development projects or businesses will meet or exceed the industry
standards.
Visibility of any new retail is also assumed very good, with signage as required to assure
easy visibility of the retailers.
Infill or redevelopment projects in the study area will open with sustainable amounts of
retail and anchor tenants, at planned intervals and per industry standards.
Mack Avenue Retail Market Study 5.
Gibbs Planning Group, Inc.
12 July 2016
Trade Area
Based on GPG’s site evaluation, the existing retail hubs, population clusters, highway access,
and the retail gravitation in the market, as well as our experience defining trade areas for similar
communities throughout the United States, it was determined that consumers in the primary trade
area generate demand to support a variety of retailers. This potential will continue to increase
over the next five years, sustained by continued economic recovery and household income
growth of 2.92 percent.

Figure 4: The Mack Avenue study area’s primary trade area is shown above outlined in blue; the total trade area is
outlined in purple. The primary trade area consists of the five Grosse Pointe municipalities, Detroit and St. Clair Shores.

The primary trade area is the consumer market where the study area has a significant competitive
advantage because of access, design, lack of quality competition and traffic and commute
patterns. This competitive advantage equates to a potential windfall in the capture of consumer
6.                                                                                         Mack Avenue Retail Market Study
                                                                                                 Gibbs Planning Group, Inc.
                                                                                                              12 July 2016
expenditure by the retailers in the study area. Through observation, retailer interviews and consumer focus groups it was determined that each of the commercial areas in the five Grosse Pointe municipalities generally share the same trade area. GPG defined a primary trade area by topography, vehicular access, strength of retail competition and residential growth patterns instead of standardized “drive-times.” Consumers inside the primary trade area will account for up to 60 to 75 percent of the total sales captured by retailers in the study area. Due to the strong retail gravitational pull of downtown Detroit and suburban shopping destination throughout the metro area, GPG finds that the primary trade area accounts for a nearly 40-acre area inclusive of the five Grosse Pointe municipalities and parts of Detroit and St. Clair Shores. Residents of the primary trade area likely drive by the study area on a daily basis. The following borders approximately delineate the primary trade area: North – 11 Mile Road South – Detroit River East – Lake St. Clair West – Beaconsfield Street / East Grand Boulevard The total or community-oriented trade area extends six to 15 miles in all directions to include many neighborhoods with easy access to I-94. This draw area encompasses downtown and Midtown Detroit, Detroit’s east side, and parts of Macomb County. Residents who live in the total, but not within the primary, trade area will shop or dine in the study area periodically, but the area will not be their primary shopping destination. Residents in the total trade area will likely account for 10 to 20 percent of the total sales captured by retailers in the study area. Demographic Characteristics Using data from Esri (Environmental Systems Research Institute) and the U.S. Census Bureau, GPG obtained the most recent population and demographic characteristics (2016), and those projected for 2021 for the defined trade area, as well as regional and statewide statistics. The primary trade area has an estimated 2016 population of 151,600 persons, which will nominally decrease at an annual rate of -0.36 percent to 149,000 by 2021. This annual population loss is in contrast to modest growth rates projected for the state and U.S. The number of households in the primary trade area will decrease from 61,100 in 2016 to 60,300 in 2021, while each household will average 2.46 persons. Median household income is $50,000 and is expected to increase to $57,800 in 2021 at an annual rate of 3.12 percent. Average income in the trade area is $75,800, while 34.1 percent of households earn over $75,000 per year – which is similar to state and national figures. Displaying higher levels of education than the state, 34.7 percent of residents over the age of 25 have earned a bachelor’s degree or higher. The median age trends older at 41.6. The total trade area displays lesser demographic characteristics than the mixture of neighborhoods in the Wayne and Macomb County. There are 527,700 residents decreasing by - 0.18 percent annually to 522,900 by 2021. This growth rate is in between the primary trade area and the state. The number of households is 212,300 decreasing to 211,300 by 2021. Median household income in the area is $37,200 and the average household income is $53,400, both of which are lower than the primary trade area. Median incomes are expected to increase to $37,200 by 2021, when the average income will have grown by 13.8 percent to $60,800. Mack Avenue Retail Market Study 7. Gibbs Planning Group, Inc. 12 July 2016
Educational attainment is the lowest of the comparison geographies and 22.5 percent of
households earn more than $75,000 annually. The median age is 38.4.

                                      Table 2: Demographic Comparisons

                                            Grosse             Primary        Total
 Characteristics                            Pointe              Trade         Trade        Michigan           USA
                                          Communities           Area          Area

 2016 Population                              45,100          151,600        527,700       9,870,800      318,536,400

 2021 Population                              44,600          149,000        522,900       9,944,000      330,622,600
 2016-21 Projected Annual
                                              -0.22%           -0.36%         -0.18%         0.15%           0.75%
 Growth Rate
 2016 Households                              18,100           61,100        212,300       3,902,500      120,746,300

 2021 Households                              17,900           60,300        211,300       3,943,200      125,477,600
 2016-21 Projected Annual HH
                                              -0.13%           -0.26%         -0.10%         0.21%           0.77%
 Growth Rate
 Persons Per Household 2016                     2.5             2.46           2.45           2.47            2.57

 Median Age                                    46.1             41.6           38.4           39.9            37.9

 2016 Median Household Income                $94,900          $50,000        $37,200        $49,400         $53,200
 2016 Average Household
                                            $135,600          $75,800        $53,400        $66,500         $74,700
 Income
 2021 Median Household Income               $109,900          $57,800        $42,500        $56,700         $60,700
 2021 Average Household
                                            $153,500          $86,500        $60,800        $76,300         $84,900
 Income
 % Households w. incomes
                                              59.7%            34.1%          22.5%          31.5%           35.6%
 $75,000+
 % Bachelor’s Degree                          33.1%            19.7%          12.1%          16.7%           18.6%

 % Graduate Degree or higher                  32.4%            15.0%           8.2%          10.8%           11.4%

Table 2: This side-by-side table compares and contrasts the primary trade area demographic statistics with those of the
total trade area, the Grosse Pointe communities, Michigan and the USA.

The Grosse Point Communities exhibit the most favorable demographics of the comparison
geographies. Consequently, the study area benefits from an ample supply of high-earning
consumers nearest the site. There will be a slight decline population from 45,100 in 2016 to
44,600 in 2021; based on age cohort data this is likely attributed to families having fewer children
and young adults leaving home for college. The median income is $94,900 and the average
income is $135,600, significantly higher than the comparison geographies. Similarly, 59.7 percent
of households earn over $75,000 annually and 65.5 percent of adults over the age of 25 have
earned a bachelor’s degree or higher. At 46.1 years, this is the oldest demographic group.

Approximately 91.6 percent of primary trade area homes are occupied and the median home
value is estimated to be $133,400. Of all households, 42.5 percent are owner-occupied, a number
that has decreased 1.7 percent since 2010 and is expected to continue downward to 41.5 percent
by 2021. Renter-occupied households have decreased from 49.5 percent in 2010 to 49.1 percent

8.                                                                                      Mack Avenue Retail Market Study
                                                                                              Gibbs Planning Group, Inc.
                                                                                                           12 July 2016
in 2015; this statistic is projected to continue to decline to 48.1 percent by 2021. The vacancy rate
has increased from 6.3 percent in 2010 to 8.4 percent in 2015, and is expected to trend towards
10.4 percent through 2021. Of the nearly 2,000 vacant housing units, 66.7 percent are actively for
sale or rent while 6.3 percent are used seasonally. The percentage of housing units valued at
over $200,000 is expected to increase from 17.1 percent to 27.9 percent – coinciding with an
increase in the median home value to $145,500 by 2021.
Tapestry Lifestyles
Esri has developed Tapestry Lifestyles, which is an attempt to create 65 classifications, or
lifestyle segments, that help determine purchasing patterns. These segments are broken down to
the U.S. Census Block Group level and used by many national retailers to help determine future
potential locations. The following Table 3 details the top Tapestry Lifestyles found in the primary
trade area.
Table 3: Tapestry Lifestyles
Trade Area
Lifestyle Short Description
Statistics
Population Residents in the Modest Income Homes segment base
31,300 their lives on their religious faith and family values. These
households could contain multiple generations as many
Households individuals care for their elderly family members.
11,300 Unemployment in this sector is more than double the US
rate and many households require Social Security and
Median HH Income public assistance income to help support the family. Most
$22,000 households rely on public transportation, but some may
18.4% Primary Trade have one car.
Area Households
Market Share Consumers prefer television as their media of choice and
they tend to purchase products that are endorsed by a
Modest Income 1.3% National celebrity. They are unlikely to possess a credit card, so all
Homes Households bills are paid in person. Modest Income Homes residents
Market Share primarily shop at warehouse clubs and low-cost retailers to
make ends meet.
Population Family Foundations are established on family values and
23,600 religious faith. Families can have older children at home
who are working on financial independence as well as live-
in grandparents. These consumers care about appearance
Households
and prefer shopping at discount stores such as T.J. Maxx
8,800 and Marshalls.
Median HH Income These are connected individuals that use the Internet
$40,000 primarily for chat rooms, online gaming, and entertainment.
Urban format radio and magazines on health and child
14.5% Primary Trade development are popular. Many have no financial
Area Household investments or retirement savings. A majority of households
Family Foundations Market Share have one to two vehicles at their disposal.
1.1% National
Market Share
Mack Avenue Retail Market Study 9.
Gibbs Planning Group, Inc.
12 July 2016Trade Area
Lifestyle Short Description
Statistics
Population The backbone of older industrial cities in states surrounding
18,700 the Great Lakes, Rustbelt Traditions residents are a mix of
married-couple families and singles living in older
developments of single-family homes. While varied, the
Households
work force is primarily white collar, with a higher
7,800 concentration of skilled workers in manufacturing, retail
trade, and health care. Rustbelt Traditions represents a
Median HH Income large market of stable, hard-working consumers with
$49,000 modest incomes but above average net worth. Family
oriented, they value time spent at home. Most have lived,
12.8% Primary Trade worked, and played in the same area for years.
Area Households
Rustbelt Traditions Market Share Residents take advantage of convenience stores for fueling
up and picking up incidentals. Watching television is a
2.2% National common pastime; many households have more than four
Households TVs. Rustbelt Traditions are connected to electronics.
Market Share Favorite family restaurants include Applebee’s, Outback
Steakhouse, and Texas Roadhouse.
Population Exurbanites residents are college educated, with more than
12,400 half earning a bachelor’s degree or higher; almost 80
percent have some college education. This labor force is
beginning to retire. One in three households currently
Households receives Social Security or retirement income. Labor force
5,000 participation has declined to less than 60 percent.
Unemployment remains low at 5.5 percent; more of the
Median HH Income residents prefer self-employment or working from home.
$98,000
These consumers are more interested in quality than cost.
8.1% Primary Trade They take pride in their homes and foster a sense of
Area Households personal style. Exurbanites residents are well connected,
Market Share using the Internet for everything from shopping to managing
Exurbanites their finances. Sociable and hardworking, they still find time
1.9% National to stay physically fit.
Market Share
Population Comfortable Empty Nesters is a large, growing segment
9,200 that consists of older individuals. More than half of all
householders are age 55 or older. These professionals are
Households enjoying the transition from child rearing to retirement. They
live throughout suburbs of metropolitan areas where they
4,000
can participate in activities that keep them physically active.
Median HH Income
This tapestry prefers to conserve money by eating at home
$68,000 instead of out at restaurants. They also utilize older home
computers because spending time online is not a priority.
6.2% Primary Trade Comfortable Empty Nesters prefer to spend time golfing,
Area Households listening to sports radio, or just enjoying a comfortable
Market Share financial future. Households tend to have one or two
Comfortable Empty vehicles. A reliable vehicle is important to commute to work
Nesters 1.9% National and participate in many outdoor activities.
Households
Market Share
Table 3: The top five Tapestry Lifestyle groups profiled above portray the blend of households found within and
surrounding the Mack Avenue study area.
10. Mack Avenue Retail Market Study
Gibbs Planning Group, Inc.
12 July 2016The trade area’s most prominent lifestyle groups demonstrate the dichotomy of established and
well-to-do households found in the Grosse Pointe communities and the low to moderate-income
households of Detroit and St. Clair Shores. This unique condition leverages the significant
expendable incomes found near the study area with the characteristic population density
throughout the trade area - a favorable condition for retailers.
The trade area’s leading tapestry segment is “Modest Income Homes,” which represents 18.4
percent of households. This group is comprised of traditional and non-traditional families living in
faith-based and family-oriented communities. Many residents are primary caregivers to their
elderly family members and female-headed households are common. The average household
size is 2.56 persons that median age is 36.1 – slightly younger than the US.
Tapestry Lifestyles Segmentation
Figure 7: The relative proportions of the top twenty Tapestry Lifestyle segments found in the primary trade area.
Single-family homes built over 60 years ago are the dominant housing choice and over half of the
homes are renter-occupied. The age of the homes correlates to the average rent of $720, which is
$270 below the national average. Still, many homes require public assistance and labor force
participation is only 50 percent due to the demands of multi-generational living. Most households
have no vehicle or one car, with a high dependence on public transportation.
Mack Avenue Retail Market Study 11.
Gibbs Planning Group, Inc.
12 July 2016Modest Income Homes residents live for today, choosing to save only for a specific purpose. They
favor TV as their media of choice and are likely to purchase products with a celebrity
endorsement. Warehouse clubs and low-cost retailers supply the day-to-day goods these
resident’s needs. Not likely to own a credit card, cash is used for most purchase and bills are paid
in person. Local outdoor recreation, church activities and listening to music are favorite pastimes.
Mack Avenue’s most common Tapestry Segment is Exurbanites, comprising 27.5 percent of
municipal households. Exurbanites residents are now approaching retirement but showing few
signs of slowing down. They are active in their communities, generous in their donations, and
seasoned travelers. They take advantage of their proximity to large metropolitan centers to
support the arts, but prefer a more expansive home style in less crowded neighborhoods. They
have cultivated a lifestyle that is both affluent and urbane. Attentive to ingredients, they prefer
natural or organic products. Gardening and home improvement are priorities, but they also use a
number of services, from home care and maintenance to personal care. Financially active with
wide-ranging investments, these investors rely on financial planners, extensive reading, and the
Internet to handle their money.
Employment Base
The employment picture found in the primary trade area reflects a concentrated Services and
Retail sector foundation, comprising 78.9 percent of total employment. For both categories, this
represents a higher proportion than in the state or nation. With the exception of Transportation, all
other categories show lesser proportions than the comparisons. Overall, the primary trade area
economy is 66.9 percent white-collar.
Table 4: Employment Comparison by Sector (SIC)
Primary Trade Total Trade
Sector Michigan USA
Area Area
Agriculture and Mining 1.0% 0.6% 1.5% 2.2%
Construction 2.4% 3.0% 4.0% 5.3%
Manufacturing 1.9% 11.9% 12.5% 9.6%
Transportation 3.7% 3.4% 2.6% 3.4%
Communication 0.3% 1.0% 0.7% 1.1%
Utility 0.1% 0.4% 0.6% 0.7%
Wholesale Trade 1.4% 3.1% 4.8% 4.2%
Retail Trade 21.2% 16.5% 21.3% 16.7%
Finance, Insurance & Real Estate 6.0% 6.8% 6.2% 6.4%
Services 57.7% 46.0% 39.9% 41.8%
Government 3.6% 6.9% 5.4% 8.7%
Unclassified 0.7% 0.5% 0.6% 0.0%
Table 4: Services and Retail Trade comprise the bulk of primary trade area employment.
As shown in Table 4 above, the Services sector accounts for the majority of employment (57.7
percent) in the primary trade area. Accounting for a significant share of the services employment,
Health Services is 27.3 percent of the total primary trade area employment. This is followed by
Other Services (17.6 percent), and Educational Institutions and Libraries (8.4 percent). Health
Services and Education employees are likely candidates to leave the workplace for lunch and
support study area restaurants, as well as shop in the evening on the way home from work.
12. Mack Avenue Retail Market Study
Gibbs Planning Group, Inc.
12 July 2016As the second leading category of employment, Retail workers account for 21.2 percent of
employment within the primary trade area – nearly five percent higher participation than the
nation. However, this is similar to estimated employment figures in the state. Within this category,
Eating and Drinking Places are the leading subcategory of employment comprising 8.8 percent of
total employment, followed by Auto Dealers, Gas Stations and Auto Aftermarket (3.2 percent)
Miscellaneous Retail (3.1 percent) and Food Stores (2.9 percent). Notably, General Merchandise
Stores, and Apparel and Accessory Stores, are not among the prevalent retail categories,
containing just 0.9 percent and 0.8 percent of total employment respectively.
Table 5: Trade Area Employment by Industry Sector
Grosse Pointe Primary Total
Employment Sector
Communities Trade Area Trade Area
Agriculture & Mining 130 490 1,910
Construction 310 1,190 9,110
Manufacturing 170 920 35,640
Transportation 80 1,830 10,100
Communication 40 150 2,870
Utility 10 30 1,150
Wholesale Trade 150 680 9,220
Retail Trade 2,910 10,410 49,400
Home Improvement 90 440 2,730
General Merchandise Stores 30 430 3,360
Food Stores 470 1,430 5,950
Auto Dealers, Gas Stations,
Auto Aftermarket 100 1,590 5,580
Apparel & Accessory Stores 190 390 1,910
Furniture & Home Furnishings 70 320 2,110
Eating & Drinking Places 1,320 4,290 20,600
Miscellaneous Retail 640 1,520 7,160
Finance, Insurance & Real Estate 1,320 2,940 20,230
Banks, Savings, & Lending Institutions 230 530 6,650
Securities Brokers 440 540 980
Insurance Carriers & Agents 120 400 4,870
Real Estate, Holding, Other Investment 530 1,470 7,730
Services 10,230 28,260 137,510
Hotels & Lodging 10 30 2,230
Automotive Services 60 630 3,410
Motion Pictures & Amusements 410 1,050 11,650
Health Services 5,150 13,350 53,400
Legal Services 170 460 5,330
Education Institutions & Libraries 1,600 4,120 17,820
Other Services 2,830 8,620 43,670
Government 980 1,760 20,650
Unclassified Establishments 100 320 1,400
Total Employment 16,430 48,980 299,190
Table 5: The Grosse Pointe communities contain one-third of the primary trade area employment.
Daytime employment plays a large role in supporting retail. The primary trade area is estimated to
have over 48,980 employees; an estimated 19,500 of them are office employees who are known
to expend at much higher rates, often eating out for lunch and shopping on the way to and from
work. The mix of employees within the Grosse Pointe communities resembles the primary trade
area, however Services is responsible for a larger majority of employment (10,230 workers),
followed by Retail (2,910 workers) and Finance, Insurance and Real Estate (1,320 workers). In
Mack Avenue Retail Market Study 13.
Gibbs Planning Group, Inc.
12 July 2016total, there are over 16,400 workers within the five Grosse Pointes. Furthermore, there are
approximately 48,980 workers within the primary trade area, providing a considerable supply of
captive daytime consumers nearest the study site. GPG estimates study area merchants
frequently capture expenditure from community workers and regularly, though less frequently,
capture expenditure from workers within the primary trade area.
Table 6: Primary Trade Area Worker Expenditure
Weekly Annual Office Worker Non-Office Worker Total
Category
Expenditure Expenditure Expenditure Expenditure Expenditure
19,500 29,480
Prepared Food &
Beverage
Limited & Full Service
Restaurants $44 $2,288 $44,616,000 $24,956,589 $69,572,589
Drinking Places $17 $884 $17,238,000 $9,642,318 $26,880,318
Retail Goods
General Merchandise,
Apparel, Home $70 $3,640 $70,980,000 $39,703,664 $110,683,664
Furnishings, Electronics
Grocery $30 $1,560 $30,420,000 $17,015,856 $47,435,856
Convenience Items $20 $1,040 $20,280,000 $11,343,904 $31,623,904
Total $181 $9,412 $183,534,000 $102,662,331 $286,196,331
Table 6: Employees within the primary trade area expend over $286.1 million dollars annually.
Consumer expenditure from daytime employment compliments that captured in the evenings and
on weekends by households in the trade area. “Office Worker Retail Spending in a Digital Age”,
published by the International Council of Shopping Centers in 2012, provides insight into the
impact of office worker employment. Weekly office worker expenditure, adjusted for 201 dollars, is
estimated at $181. Weekly non-office worker expenditure is estimated at 37 percent of office
workers. Non-office workers are estimated to have slightly less disposable income, to have
multiple work locations including at home, and typically are on the road more during their
workweek. Retail purchases (general merchandise, apparel, home furnishings, electronics,
grocery and convenience items) make up the majority of the office worker dollars, at $120 per
week. Restaurant expenditures (full service, limited service and drinking places) account for the
balance at $61 per week. Annualized, each office worker expends $9,412 before, during and after
work.
The annual impact of over 48,980 workers within the primary trade area is $286.1 million. This
expenditure breaks down to include $96.4 million in prepared food and beverage establishments,
$47.4 million in grocery purchases, $110.6 million in retail sales and $31.6 million in convenience
items.
TRADE AREA CHARACTERISTICS
Location
The primary trade area is located in southeastern Michigan approximately three miles east of
downtown Detroit. Similarly, the study area is just three miles from an international border
crossing with Canada and 20 miles east of Detroit Metropolitan Airport. The primary trade area is
mainly served by I-94 with local access supplied by Mack Avenue and Jefferson Avenue.
14. Mack Avenue Retail Market Study
Gibbs Planning Group, Inc.
12 July 2016Bordered by Lake St. Clair and the Detroit River, the area is a sought after residential destination
for waterfront access and connectivity to Detroit and the surrounding region. More so than any
other suburb bordering Detroit, the demographics of the Grosse Pointe Communities stand in
notable contrast to the low to moderate economic conditions found in many of the Motor City’s
neighborhoods. This is due to strong municipal governments, well-funded public services and
exceptional schools.
th
As the home for many auto industry executives in the first half of the 20 century and due to the
vintage of city and home building found in the trade area, the neighborhoods have retained
considerable value and at a density not always characteristic of Detroit’s other wealthy suburbs.
For instance, the Grosse Pointe communities average 1,750 households per square mile, while
Bloomfield Hills in Oakland County averages just over 300 households per square mile.
Alternatively, Birmingham, also in Oakland County, averages 1,950 households per square mile.
Household density, especially when involving high-earning households, is an important metric for
retailers because it translates into the depth of the spending power and the overall efficiency of a
potential retail location.
Table 8: Traffic Counts
Location Traffic Count
I-94 & Moross Road 127,200
Mack Avenue & Moross Road 30,000
Moross Road & Mack Avenue 27,700
Mack Avenue & Vernier Road 21,000
Mack Avenue & Cadieux Road 18,800
Jefferson Avenue & Cadieux Road 17,700
Alter Road & Kercheval Avenue 11,900
Jefferson Avenue & Alter Road 10,900
Cadieux Road & Mack Avenue 8,900
Kercheval Avenue 7,000
Table 8: The traffic chart shows heavy traffic along Mack Avenue fed by I-94 via Moross, Vernier and Cadieux.
(Source: MDOT, SEMCOG)
Access
Regional linkage is available to the study area; however, the Mack Avenue study area is not
easily reached by Detroit’s northern or western suburbs. Interstate-94 carries over 127,000 daily
vehicles and serves as the main regional access to the Grosse Pointe communities via Vernier,
Moross, Cadieux or Outer Drive/Alter.
Traffic volumes seen in Table 8 confirm the routes with the best local access: Mack Avenue,
Moross Road and Jefferson Avenue. Mack and Jefferson serve as the primary connections to
Detroit and are the main routes for Grosse Pointe residents working in Detroit. Kercheval Avenue,
the main street to the study area, does not have readily available traffic counts, but SEMCOG
estimates the route to have 7,000 average daily cars. A traffic study is recommended to better
understand the amount of traffic traveling through the study area and is a valuable resource for
retailers.
Mack Avenue Retail Market Study 15.
Gibbs Planning Group, Inc.
12 July 2016Parking in the study area appears to be adequate, although retail expansion will likely create
demand for additional capacity and comprehensive parking management. Individual parking
studies are recommended for each of the study areas to ensure adequate supply and updated
parking management policies to promote vehicle turnover and convenient availability.
Other Shopping Areas
As part of GPG’s evaluation, neighborhood, community and regional shopping centers near Grosse
Pointe were identified, visited and studied to assess their retail appeal, strength of tenant mix,
general maintenance and accessibility. In addition to on-site assessment, GPG used information
from the International Council of Shopping Centers’ Global Shopping Center Directory.
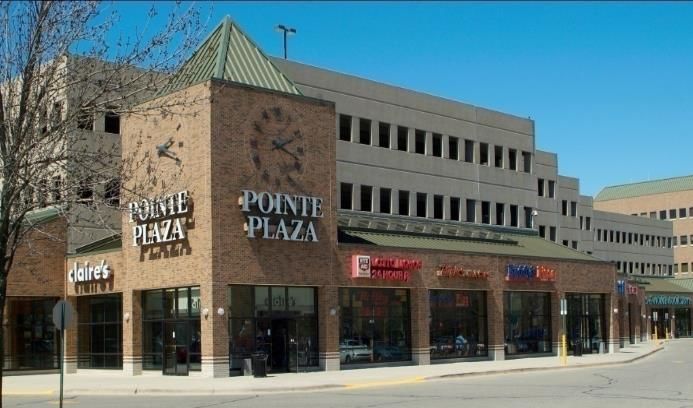
Figure 8: Pointe Plaza Shopping Center (left) and Mack Alter Square (right) are neighborhood centers closest to the
subject study areas.
For primary trade area residents, the most convenient shopping destination is the Pointe Plaza
Shopping Center in Grosse Pointe Woods, built in 1990. Located on the corner of Mack Avenue
and Moross Road, this 70,400 sf neighborhood center is conveniently situated next door to St.
John Hospital. Retail offerings include Rite Aid and Barnes & Noble, Bath & Body, Claire’s, Dress
Barn, GNC and SVS Vision, as well as a Buddy’s Pizza restaurant.
Two grocery-anchored centers round out the primary trade area’s neighborhood retail
competition. Mack-Alter Square, developed in 2005, is a 59,200 sf center anchored by an Aldi
grocery store and a Rite Aid. Other retail includes America’s Best, Family Dollar and Foot Locker,
with supporting service-oriented tenants. Riverbend Plaza Shopping Center, located on East
Jefferson Avenue and Piper Blvd. in Detroit, is situated in a growing commercial corridor and in
close proximity to the city of Grosse Pointe Park and downtown Detroit’s business district. The
72,000 sf center, built in 1984, is anchored by Parkway Foods, with Dollar Tree, GameStop,
O’Reilly Auto Parts and Sneaker Villa.
Significant additional retail and restaurant concentrations can be had within ten miles of the study
area. Eastgate Shopping Center is a 120,000 sf community center located at 10 ½ Mile Rd. and
Gratiot Ave. in Roseville. Noted as the first strip mall in Michigan, it is anchored by Kroger and TJ
Maxx, with retailers including Ace Hardware, Avenue, Citi Trends, GNC, Payless Shoe Source,
Rainbow Apparel, Subway, Sherwin Williams and Shoe Time. Approximately three miles west of
Eastgate is Hoover Eleven Shopping Center, at 26417 Hoover Road in Warren. The 290,000 sf
community center is anchored by a Kroger grocery store, and offers Bath & Body Works, CVS,
Dots, Dress Barn Women, GameStop, Hallmark, Marshalls, OfficeMax, Payless Shoes, Quiznos
and Subway. Finally, Gratiot Plaza offers 217,000 sf of retail and restaurant space, including
several outlot buildings along both Gratiot Avenue and 13 Mile Road. Anchored by Kroger, other
16. Mack Avenue Retail Market Study
Gibbs Planning Group, Inc.
12 July 2016retail includes Bed Bath & Beyond, Best Buy, Catherine’s, DSW Shoe Warehouse, GameStop, Hallmark Cards and Tuesday Morning, with restaurants Logan’s Roadhouse, Ruby Tuesday and Tim Horton. Eastland Center, a 1,400,000 sf regional center located in Harper Woods at the intersection of 8 Mile Road and Beaconsfield Avenue, is the closest regional center for primary trade area residents. Anchored by Macy’s Target and Burlington Coat Factory, features over 88 stores including K& G Fashion Superstore, Shoppers World. Also: Ashley Stewart, Bath and Body Works, Claire’s Champs Sports, Finish Line, Foot Locker, Kay Jewelers, Lids and Victoria’s Secret. Eastland opened in 1993 as an open-air shopping center and was later enclosed. Faced with declining occupancy, it was bought by Spinosa in July 2015 and underwent a major renovation and expansion. Figure 9: Eastland Center houses a celebrated work of public sculpture, “The Lion and Mouse," by Marshall Fredericks (left). Macomb Mall’s 2013 renovation brought in other new retailers such as Dick’s Sporting Goods (right). Macomb Mall is a 933,500 sf regional center in Roseville that offers 100 stores and services, including national retailers including Dick’s Sporting Goods, Kohl’s, Sears, Shoe Carnival and ULTA Beauty. Opened in 1964, it was developed by Schostak Brothers and sold to Lormax Stern in 2013, whose $30 million in improvements have seen year-over-year sales shoot up 50 percent in 2015. The 40-acre mall offers retailers Babies R Us, Bath and Body Works, H&M, Old Navy, rue21, White Barn Candles and Zales, with dining options including 1000 Degrees Pizzeria, Chipotle Mexican Grill and Potbelly Sandwich Shop. 32233 Gratiot Avenue Roseville, MI 48066 Oakland Mall is a 1,500,000 sf regional mall located in Troy. Built in 1965, it is owned by Urban Retail Properties and has over 1.5 million sf of leasable area. It is anchored by JCPenney, Macy’s and Sears, and a new freestanding Field and Stream. It has over 120 stores, including Champs Sports, Charlotte Russe, Dick’s Sporting Goods, Express and Express Men, Forever 21, H&M, Kay’s Jewelers (one of five jewelry stores), Lane Bryant, Land’s End, Victoria’s Secret and PINK. Several notable walkable downtown shopping venues are proximate to the study area: Detroit's Midtown neighborhood beckons shoppers as they attract national and destination retailers back into the city. M-1 Rail construction on Woodward and the efforts of Bedrock Real Estate Services and other owners along the Woodward corridor is building an infrastructure that is fostering a retail and restaurant resurgence to complement the city’s world-renowned cultural institutions. National retailers on Woodward such as Barnes & Noble, John Varvatos, Moosejaw and Nike join a plethora of local, independent names including Artloft, Detroit Bikes, Henry the Hatter, RUNDetroit, Mack Avenue Retail Market Study 17. Gibbs Planning Group, Inc. 12 July 2016
Shinola, Third Man Records and Will’s Leather Goods, and restaurants Jolly Pumpkin Pizzeria &
Brewery, Traffic Jam & Snug, Selden Standard, Slows to Go and The Whitney.

Figure 10: Downtown Ferndale (left) is situated around the intersection of Woodward Avenue and 9 Mile Road, while
Downtown Royal Oak (right) is centered on Main Street, 4th Street and Washington Avenue.

Ferndale’s downtown district, centered on Woodward Avenue and 9 Mile Road, offers the
authentic book and antique stores, coffee shops and custom retail that make it a destination for
neighborhood, community and tourism retail. In lieu of national tenants, downtown businesses
include art galleries, a comic book store, retro-themed antique, clothing and candy stores, health
foods, a record store and several independent bookstores. Dining includes many small, ethnic-
themed restaurants and several full-service bar and grilles. Unique cocktail lounges are abundant
in lieu of traditional bars.

                                     Table 9: Existing Shopping Centers

                                                                                           Driving Distance to
 Map            Retail Center Name              Shopping Center Type         Size SF
                                                                                           Study Area
   1       Pointe Plaza Shopping Center         Neighborhood Center            70,400 sf           0.1 miles
   2            Mack-Alter Square               Neighborhood Center            59,200 sf           3.3 miles
   3     Riverbend Plaza Shopping Center        Neighborhood Center            72,000 sf           5.5 miles
   4         Eastgate Shopping Center              Regional Center          1,400,000 sf           7.4 miles
   5      Hoover Eleven Shopping Center          Community Center             290,000 sf          10.0 miles

   6               Gratiot Plaza                 Community Center             217,000 sf           9.0 miles
   7              Eastland Center                Community Center             120,000 sf           3.3 miles
   8               Macomb Mall                     Regional Center            933,500 sf           9.0 miles

   9               Oakland Mall                    Regional Center          1,500,000 sf          21.0 miles
  10              Midtown Detroit                 Downtown District             NA                11.0 miles
  11            Downtown Ferndale                 Downtown District             NA                18.0 miles

  12           Downtown Royal Oak                 Downtown District             NA                19.5 miles

                                                            th
Downtown Royal Oak, centered on Main Street, 4 Street and Washington Avenue, hosts a
trendy mix of more than 40 local, regional and national retailers. American Apparel, GameStop
and several eclectic boutiques have locations in the downtown district. Coffee houses, casual
upscale bistros and wine bars coexist with a full range of quick service and casual dining
restaurants, including bd’s Mongolian Grill, Noodles & Co., and Qdoba Mexican Grill. A 10-screen
first-run theater and 16-lane bowling alley opened in 2011, complementing a long-standing art
theater on Main Street.

18.                                                                                  Mack Avenue Retail Market Study
                                                                                           Gibbs Planning Group, Inc.
                                                                                                        12 July 2016
Figure 11: The majority of competing shopping areas lie to the north and west of Grosse Pointe Farms.
SUMMARY of FINDINGS
This study finds that the Mack Avenue study area is presently supportable with up to 51,080 sf of
additional retail and restaurant space. This new retail can potentially capture $15.6 million of
expenditures in 2016, growing to $16.4 million in expenditures by 2021. This retail development
could include:
Corner Stores: One to two corner stores at 1,500 to 2,500 sf, located on the periphery of
downtown at popular neighborhood entries.
Convenience Centers: One to two 20,000 to 25,000 sf convenience centers. These
centers can include a wide range of retailers such as apparel, bakeries or butchers,
department store merchandise, florists, furniture and home furnishings, jewelry,
pharmacy, full-service and limited-service restaurants and general merchandise.
Mack Avenue Retail Market Study 19.
Gibbs Planning Group, Inc.
12 July 2016These retail centers could be developed as conventional shopping centers or most likely as filled
vacancies, infill or mixed-use redevelopment into the current walkable study area.
The demographics of the primary trade area show a population base of 151,600, which will
decrease to 149,000 by 2021, at an annual growth rate of -0.36 percent. The persons per
household is 2.46, and median age is 41.6 years old. Median household income of $50,000 in the
primary trade area is similar to state and national averages. The average household income is
$75,800 demonstrating a positive effect on spending potential from the top wage earners in the
area. Educational attainment is higher than state and national levels as 34.7 percent of residents
over the age of 25 have earned a bachelor’s degree or higher.
Figure 12: Mack Avenue is a long-standing commercial corridor with national and local retailers. While there are
successful blocks of retail along the corridor there are also a number of opportunities to expand retail offerings.
Employment in the primary trade area favors the Services sector (57.7 percent), while other
strong sectors include Retail (21.2 percent) and Finance, Insurance and Real Estate (6.0
percent). There are nearly 49,000 employees within the primary trade area and 16,400
employees within the Grosse Pointe communities. These daytime consumers expend over $286.1
million annually before, after or during the workday.
The most prevalent tapestry lifestyle in the market is Modest Income Homes, representing 18.4
percent of households. Residents in the Modest Income Homes segment base their lives on their
religious faith and family values. These households could contain multiple generations as many
individuals care for their elderly family members. Consumers prefer television as their media of
choice and they tend to purchase products that are endorsed by a celebrity. They are unlikely to
possess a credit card, so all bills are paid in person. Modest Income Homes residents primarily
shop at warehouse clubs and low-cost retailers to make ends meet.
A detailed examination of the supportable sf of retail uses and potential tenants is found in the
following Table 9:
20. Mack Avenue Retail Market Study
Gibbs Planning Group, Inc.
12 July 2016Table 9: 2016 & 2021 Supportable Retail Table
Mack Avenue
Estimated 2016 2016 Estimated 2021 2021 Estimated No. of
Retail Category
Supportable SF Sales/SF Retail Sales Sales/SF Retail Sales Stores
Retailers
Apparel Stores 4,730 $185 $875,050 $195 $922,350 2-4
Auto Parts Stores 4,670 $235 $1,097,450 $245 $1,144,150 1-2
Book & Music Stores 4,010 $190 $761,900 $200 $802,000 1-2
Craft Beer, Spirits & Fine Wine Stores 3,110 $295 $917,450 $310 $964,100 1-2
Department Store Merchandise 12,540 $180 $2,257,200 $190 $2,382,600 5-6
Electronics & Appliance Stores 13,140 $325 $4,270,500 $340 $4,467,600 5-6
Florists 1,250 $225 $281,250 $235 $293,750 1
Furniture Stores 9,720 $245 $2,381,400 $255 $2,478,600 2-3
General Merchandise Stores 36,660 $175 $6,415,500 $185 $6,782,100 8 - 10
Grocery Stores 53,680 $355 $19,056,400 $375 $20,130,000 2-3
Home Furnishings Stores 8,590 $285 $2,448,150 $300 $2,577,000 3-4
Jewelry Stores 5,370 $375 $2,013,750 $395 $2,121,150 3-4
Lawn & Garden Supply Stores 2,680 $215 $576,200 $225 $603,000 1-2
Miscellaneous Store Retailers 29,080 $215 $6,252,200 $225 $6,543,000 8 - 10
Office Supplies & Gift Stores 8,960 $215 $1,926,400 $225 $2,016,000 8-9
Pharmacy 10,360 $360 $3,729,600 $380 $3,936,800 1-2
Shoe Stores 9,380 $215 $2,016,700 $225 $2,110,500 7-8
Specialty Food Stores 3,130 $265 $829,450 $280 $876,400 1-2
Sporting Goods & Hobby Stores 12,310 $245 $3,015,950 $255 $3,139,050 3-4
Retailer Totals 233,370 $253 $61,122,500 $265 $64,290,150 63 - 84
Restaurants
Bars, Breweries & Pubs 6,050 $320 $1,936,000 $335 $2,026,750 2-3
Full-Service Restaurants 15,270 $280 $4,275,600 $295 $4,504,650 4-5
Limited-Service Eating Places 20,650 $215 $4,439,750 $225 $4,646,250 7-8
Special Food Services 8,160 $225 $1,836,000 $235 $1,917,600 4-5
Restaurant Totals 50,130 $260 $12,487,350 $273 $13,095,250 17 - 21
Retailer & Restaurant Totals 283,500 $254 $73,609,850 $267 $77,385,400 80 - 105
Table 9: Sales stated in constant 2016 dollars.
Retail Category Definitions
Retail categories in the Supportable Retail Table correspond to the North American Industry
Classification System (NAICS), the standard used by Federal statistical agencies in classifying
business establishments for the purpose of collecting, analyzing, and publishing statistical data
related to the U.S. business economy. The following NAICS codes and definitions are provided by
the U.S. Census Bureau:
Retail
Auto Supply Stores (4411): establishments known as automotive supply stores primarily
engaged in retailing new, used, and/or rebuilt automotive parts and accessories,
automotive supply stores that are primarily engaged in both retailing automotive parts and
Mack Avenue Retail Market Study 21.
Gibbs Planning Group, Inc.
12 July 2016accessories and repairing automobiles; establishments primarily engaged in retailing and
installing automotive accessories; and establishments primarily engaged in retailing new
and/or used tires and tubes or retailing new tires in combination with automotive repair
services.
Furniture Stores (4421): establishments primarily engaged in retailing new furniture, such
as household furniture (e.g., baby furniture box springs and mattresses) and outdoor
furniture; office furniture (except those sold in combination with office supplies and
equipment); and/or furniture sold in combination with major appliances, home electronics,
home furnishings and/or floor coverings.
Home Furnishings Stores (4422): establishments primarily engaged in retailing new home
furnishings (except furniture).
Electronics and Appliance Stores (4431): establishments primarily engaged in retailing
the following new products: household-type appliances (refrigerator, dishwasher, oven),
cameras, computers/software, televisions and other electronic goods.
Hardware Stores (4441): establishments primarily engaged in retailing new building
materials and supplies (lumber, plumbing, electrical, tools, housewares, hardware, paint,
and wallpaper).
Lawn and Garden Supply Stores (4442): establishments primarily engaged in retailing
new lawn and garden equipment and supplies. (Nursery, farm and garden products,
outdoor power equipment).
Grocery Stores (4451): establishments primarily engaged in retailing a general line of
food products (canned/frozen food, fruits and vegetables, meat, fish, poultry, milk, bread,
eggs, soda).
Specialty Food Stores (4452): establishments primarily engaged in retailing specialized
lines of food (meat, fish/seafood, fruits/vegetables, baked goods, candy, nuts,
confections, popcorn, ice cream, items not made on the premises).
Beer, Wine, and Liquor Stores (4453): establishments primarily engaged in retailing
packaged alcoholic beverages, such as ale, beer, wine and liquor.
Health & Personal Care Stores (4461): establishments primarily engaged in retailing
health and personal care products (pharmacies/drug stores, first aid, beauty products,
household supplies, candy, prepackaged snacks, optical goods, vitamins/supplements).
Clothing stores (4481): men’s and boys’ clothing stores; women’s and girls’ clothing
stores; children’s and infants’ clothing stores; family clothing stores; clothing accessories
stores.
Shoe Stores (4482): Shoes (men’s, women’s, child/infant, athletic).
Jewelry Stores (4483): Jewelry, luggage, and leather goods (silverware, watches, clocks,
handbags, briefcases, belts, gloves).
22. Mack Avenue Retail Market Study
Gibbs Planning Group, Inc.
12 July 2016You can also read