RETAIL Second Half 2019 - Research & Forecast Report - Colliers International
←
→
Page content transcription
If your browser does not render page correctly, please read the page content below
Research &
Forecast Report

                   Accelerating success.

RETAIL
Second Half 2019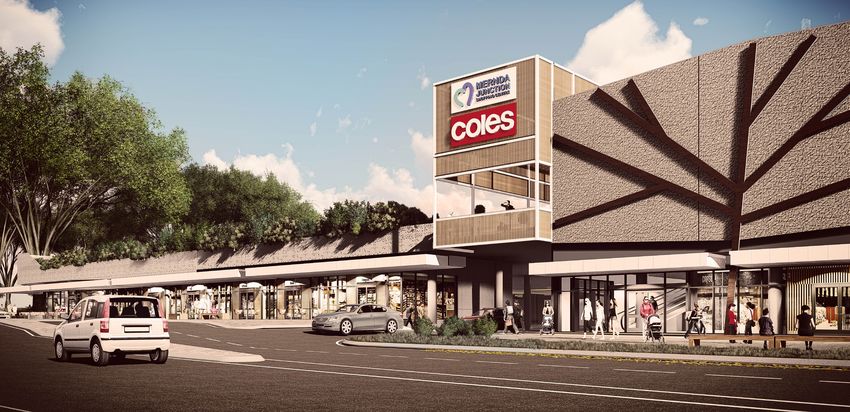
Accelerating success.

                                             MAXIMISE THE
                                             POTENTIAL OF
                                             DATA

  IN-DEPTH DATA                                   At the forefront of the
                                                  real estate industry, we
Granular datasets covering historical
                                                  understand the demand
 and forecast data with over 2,000
   datapoints updated quarterly.                  for reliable and accurate
                                                  data is more prevalent
                                                  than ever.
                                                  Our enterprising
                                                  technology, Colliers Edge,
                                                  offers comprehensive
    DETAILED                                      property data that enables
  TRANSACTIONS                                    you to delve deeper into
                                                  the Australian property
       Individual reporting of
                                                  market, using data to
         major transactions.
                                                  become more informed
                                                  and deliver enduring value.
                                                  Colliers Edge is a data
                                                  subscription service
                                                  developed by our in-
        INSIGHTS                                  house research experts,
  Our experienced research team                   who collaborate with
 will help you understand quarterly               our National network
changes, as well as broader themes                of operators to drive
  behind each sector and market.                  exceptional results.

             Joanne Henderson
             Director | Research
             +61 410 391 093
             joanne.henderson@colliers.com
             colliers.com.au/colliersedge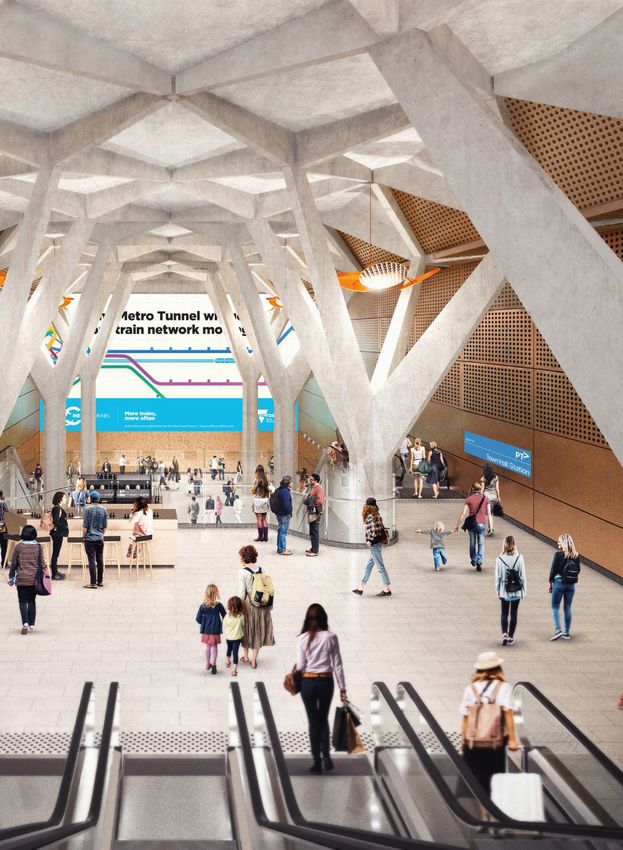
CONTENTS

     Snapshot | Retail                     4

     National Overview                     5

     Sydney                                6

     Melbourne                             8

     Brisbane                             11

     Gold Coast                           13

     Adelaide                             15

     Perth                                17

     New Zealand                          19

     Centres                              21

     LFR                                 23

     Our Expertise                       25

                         Accelerating success.
RETAIL | Research & Forecast Report | H2 2019

RETAIL
SNAPSHOT
                    AVERAGE GROSS
      SEP 2019                      MOVEMENT YOY   AVERAGE INCENTIVE   LOWER YIELD     UPPER YIELD          AVERAGE YIELD
                      FACE RENT

    SYDNEY

    CBD                $12,825                           9.5%             3.9%             5.5%                    4.7%

    Regional            $1,950                           14.0%            4.0%             5.5%                    4.8%

    Sub regional        $1,200                           19.0%            5.5%              7.1%                   6.3%

    Neighbourhood       $950                             17.0%            5.5%             7.0%                    6.3%

    Large Format        $488                             8.0%             6.3%             7.5%                    6.9%

    MELBOURNE

    CBD                 $7,500                           8.0%             4.1%             5.5%                    4.8%

    Regional            $1,750                           10.0%            3.8%             5.5%                    4.6%

    Sub regional        $1,005                           16.0%            5.3%             7.0%                    6.1%

    Neighbourhood       $738                             17.0%            5.3%             7.0%                    6.1%

    Large Format        $278                             11.0%            6.5%             7.5%                    7.0%

    BRISBANE

    CBD                $4,250                            17.5%            4.8%             6.0%                    5.4%

    Regional            $1,500                           17.5%            4.3%             5.8%                    5.0%

    Sub regional        $1,025                          25.0%             5.5%             7.3%                    6.4%

    Neighbourhood       $625                            25.0%             6.0%             7.5%                    6.8%

    Large Format        $345                            20.0%             7.0%             8.0%                    7.5%

    PERTH

    CBD                 $3,133                           15.0%            4.8%             5.5%                    5.1%

    Regional            $988                            20.0%             5.5%             6.0%                    5.8%

    Sub regional        $775                             15.0%            6.0%             7.0%                    6.5%

    Neighbourhood       $453                            20.0%             5.8%             7.0%                    6.4%

    Large Format        $203                             12.5%            7.2%             8.0%                    7.6%

    ADELAIDE

    CBD                 $2,875                           15.0%            4.8%             6.0%                    5.4%

    Regional            $1,425                          20.0%             5.0%             6.3%                    5.6%

    Sub regional        $688                            25.0%             6.0%             8.3%                    7.1%

    Neighbourhood       $525                            20.0%             6.3%             7.8%                    7.0%

    Large Format        $238                             15.0%            7.3%             8.3%                    7.8%

4
RETAIL | Research & Forecast Report | H2 2019

NATIONAL
                                                                            Generation MillZ is not only highly tech-savvy but also more
                                                                            environmentally conscious than any other generation. These

OVERVIEW
                                                                            characteristics are shaping their purchasing habits. According to a
                                                                            study by Deloitte, climate change is their most important concern.
                                                                            Another survey by HP Australia and Planet Ark further indicates that
                                                                            young Australians are increasingly shifting their consumption toward
                                                                            products and services that align with their ethical values.
By Alex Pham
Director | Research                                                         Quality over quantity
alex.pham@colliers.com
                                                                            Analysis by Colliers International reveals that Australian consumers
                                                                            are shying away from low-quality and disposable products to opt
Australian consumers are becoming increasingly environmentally              for more durable and higher-quality merchandise. Retail brands
conscious and are demanding higher-quality and more sustainable             that have not paid attention to improving their quality offerings have
products.                                                                   struggled with sales in recent years, while the higher end of the
                                                                            market continues to prosper. Brands are increasingly feeling the
Retailers must compete on values and customer experiences rather            impact of these changing consumer habits. The recent collapse of
than low prices.                                                            Forever 21 and Big W’s closure of 30 stores nationwide have brought
                                                                            these issues to light, presenting opportunities for retailers willing to
                                                                            embrace these challenges.
The investment market continues to be supported by offshore
appetite for Australian retail properties underpinned by positive           With a generation easily influenced by social media and marketing,
fundamentals and reasonable pricing.                                        retailers must focus on quality, value proposition and brand
                                                                            positioning. Some successful examples include brands such as H&M,

Retail Market Trends                                                        which is committed to supply-chain transparency and publish a list
                                                                            of 98.5 per cent of their suppliers’ names and addresses on their
The rise of conscious consumerism
                                                                            website and update it every quarter. Other brands such as David
While Australian consumers have always been conscious of the                Jones, Myer, ALDI are also committed to driving positive social and
social and environmental impacts of their consumption, there has            environmental change through their supply chain. These initiatives
always been a gap between their intention and action. This issue            are yielding results with examples such as Australian shoemaker,
is identified as the attitude-behaviour gap, which shows while              R.M. Williams, which focuses on sustainability and longevity, having
consumers are generally concerned about ethical issues, they                to double their production to meet the rising demand.
haven’t adjusted their purchasing activities in accordance. However,
this attitude-behaviour gap has begun to narrow in recent years.
                                                                            Implications for the retail industry
Australian consumers are becoming increasingly ethically-minded             The growing movement towards sustainable consumption is
and taking direct action to adjust their purchasing behaviours to bring     having significant implications for the retail industry in Australia.
about social, economic and environmental change.                            Consumers are starting to demand that more attention is paid to
                                                                            sustainability and corporate social responsibility issues by both
Generation MillZ
                                                                            retailers and shopping centre owners. Information transparency
The rise of conscious consumerism in recent years can be attributed         and local community engagement are other key considerations. The
to several factors, including; the spread of information through            retail landscape is evolving. Major retail brands are competing on
social media influencers as well as the emergence of the Millennials        values, ethics and sustainability rather than just low prices. In the
and Generation Z (those who were born after 1996) as the largest            future, more space allocation may be given to brands that focus on
consumer segment in the developed world. These cohorts of                   sustainability to meet the ethical expectations of consumers and
consumers - collectively known as ‘Generation MillZ’ - now make             society.
up 40% of the Australian working population and are gaining
tremendous power – commercially, socially and politically.

National Retail Sales                                                       Non-Disc vs Disc (% change rolling 12mth)
7%                                                                  2.0%    6.5%
                                                                            6.0%
5%
                                                                    1.2%    5.5%
3%                                                                          5.0%
1%                                                                  0.4%    4.5%
                                                                            4.0%
-1%                                                                 -0.4%   3.5%
-3%                                                                         3.0%
                                                                    -1.2%   2.5%
-5%                                                                         2.0%
-7%                                                                 -2.0%   1.5%

                         Monthly Growth-RHS   MAT Growth                                               Non-Discretionary      Discretionary

Source: Colliers International                                              Source: Colliers International

5
RETAIL | Research & Forecast Report | H2 2019
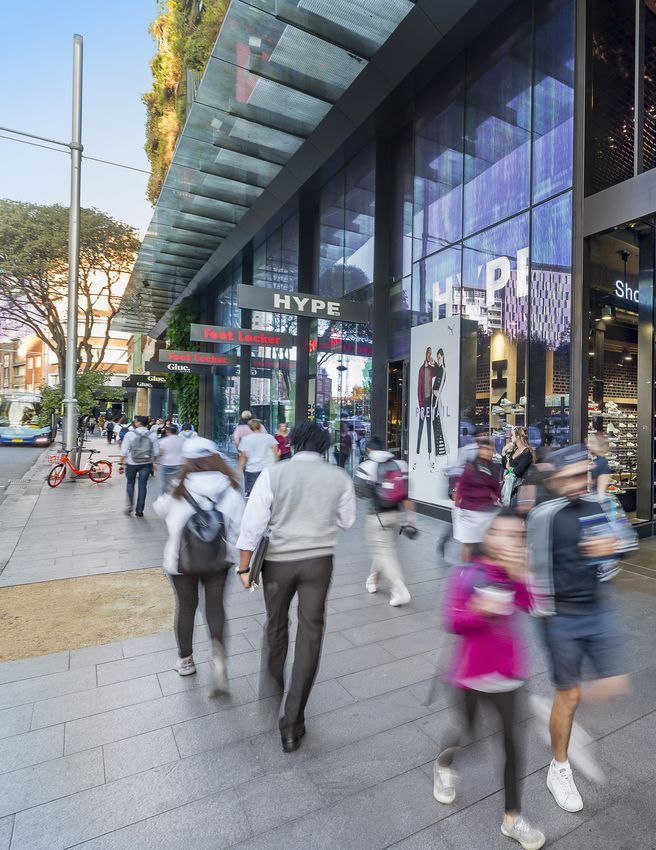
SYDNEY CBD
OVERVIEW
Market Indicators - December 2019 The Sydney CBD retail market remains supported by a confluence of
factors including the continued growth in population, office workers
AVERAGE NET FACE RENTS ($/m2) and students as well as the strength of the tourism sector.
Prime
L H
$2,750 $2,900 The total retail spending within the Sydney CBD is estimated at $4.2
billion at present and is projected to increase to $7.2 billion by 2031,
AVERAGE YIELDS representing an average annual growth rate of 4.2% per annum.
Prime
L H
More than 1.2 million sqm of new commercial space expected to be
3.9% 5.5%
delivered over the next 10 years.
AVERAGE INCENTIVE
Over the past 12 months to June 2019, Sydney received a total of 16.1
Prime
million visitors, representing an increase by 10% year on year.
L H
9.4% 9.5%
Sydney CBD Gross Rent & Incentive Sydney CBD - Yield Spread
$14,000 12% 8%
$13,000
10% 6%
$12,000
8% 4%
$11,000
$10,000 6% 2%
$9,000
4% 0%
$8,000
2%
$7,000 -2%
$6,000 0%
S Spread 10Y Bond Sydney
Source: Colliers International Source: Colliers International
6
RETAIL | Research & Forecast Report | H2 2019

By Alex Pham                                                               International student numbers continue to rise
Director | Research
alex.pham@colliers.com                                                     Over 107,000 students currently live and study at campuses within
                                                                           the CBD. Major education campuses include; the University of
Market Overview                                                            Sydney (Camperdown/Darlington Campus – 40,000 students), The
                                                                           University of Technology Sydney (UTS - 33,038 students), TAFE
The Sydney CBD retail market remains supported by a confluence
                                                                           NSW Ultimo Campus (approximately 30,000 students) and The
of factors including the continued growth in the local population,
                                                                           University of Notre Dame (Sydney Campus – nearly 4,500 students).
office workers and students as well as the strength of the tourism
                                                                           The inner-city student population of Sydney is typified as young and
sector. These favourable conditions are further buoyed by a
                                                                           technologically savvy consumers, who allocate a high proportion of
massive pipeline of investment in both public and private projects in
                                                                           their non-housing spending on food and technology products. The
Sydney. Colliers International is currently tracking over $116 billion
                                                                           student population contains a significant level of overseas students,
worth of projects across Sydney. Among the major projects that
                                                                           primarily from Asia.
will significantly transform the CBD are the Sydney Light Rail and
the pedestrianisation of George Street ($2.7 billion – opening in          Solid growth in tourist spending
December 2019), Sydney Metro City and Southwest project ($12               Tourism remains a driving force of retail spending in the Sydney CBD
billion – expected completion in 2024) and the recently announced          market, especially for the luxury retailing market. Over the past 12
Sydney Metro West (expected to cost $13-18 billion).                       months to June 2019, Sydney received a total of 16.1 million visitors,
Surging local resident community                                           representing an increase by 10% year on year. There were 12.0
                                                                           million local overnight visitors (up 13.6% on the previous year) who
With improved infrastructure and increased residential developments
                                                                           spent a total of $9.3 billion (up 17.8%). International visitors totalled
within the CBD, the local population is expected to expand strongly
                                                                           4.1 million (up 0.8% on the previous year) and contributed $10.2
over the next few years. A pipeline of $23 billion worth of residential
                                                                           billion (up 7.2%) to the Sydney retail economy.
projects is on track to be completed between now and 2024 and
will deliver approximate 15,000 additional units. The total trade area     China is the largest source market of international visitors to Sydney,
resident population within the Sydney CBD is estimated at 244,290          accounting for 16.2% of the total number of tourists from overseas.
as at 2018. The local population growth over the past 12 months was        On the back of these strong supports, spending on luxury products
4.2% which was almost double the Sydney average of 2.2%. The               is expected to grow by 7-8% over the next five years. Luxury brands
total retail spending within the catchment area is estimated at $4.2       in the Sydney CBD are upgrading their prime stores to cope with the
billion at present and is projected to increase to $7.2 billion by 2031,   increased demand, while more international brands continue to circle
representing an average annual growth rate of 4.2% per annum.              the market for flagship locations.

While the area is traditionally home to a substantial population of
students due to its strategic location near numerous university
campuses, there is also a rising number of local residents and
families. About 27% of the local household composition is made up
of families with children, while couples without children accounted
for approximately 28%. Single persons accounted for 17% of the total
population, and 21% are group households. The largest customer
segment in the area is the “Metro High Flyers”, who are young,
higher affluent couples and singles who typically work in the CBD
and have higher than average spending power. The average retail
spend per catchment resident is $18,313 per year, which is 4% above
the Sydney average.

A strong office worker market
The local worker population within the Sydney CBD market is
forecast to increase significantly over the next decade with more
than 1.2 million sqm of new commercial space expected to be
delivered over the next 10 years. The bulk of these developments
between now and 2024 will concentrate within Wynyard Station
and Circular Quay. In addition, the New South Wales Government
is planning for the development of an Innovation and Technology
Precinct in the Central to Eveleigh area. Central to this plan will be
the redevelopment of the Central Precinct over Central Station and
the Sydney Rail Yards. The area is expected to generate 25,000 new
jobs, mostly in the high-tech and creative industries. Atlassian has
announced its plans to relocate and expand its headquarters into this
                                                                           Central Park Retail, NSW
precinct once complete.                                                    Sold on behalf of Fortius Property Group

7
RETAIL | Research & Forecast Report | H2 2019
MELBOURNE
OVERVIEW
Market Indicators - December 2019 Tightened spending has led to greater discretion amongst
consumers in 2019. This has pushed retailers to offer a stronger
AVERAGE NET FACE RENTS ($/m2) point of difference in their retail and separate themselves from the
Prime larger brands which are tending to broaden their product lines.
L H This includes offering a service or experience to the customers, in
addition to the product.
$4,000 $11,000
In 2020, we expect to see stronger relationships between online
AVERAGE YIELDS
and bricks-and-mortar in businesses, with the emergence of resale/
Prime
consignment businesses. The student market will continue to be a
L H
driving force in the Melbourne retail market, as will the activation of
4.1% 5.5% spaces through redevelopment as a result of higher density in the
CBD.
AVERAGE INCENTIVE
Prime Struggling retail strips are likely to begin encouraging new concepts
and the saturation of Food & Beverage (F&B) may push service
L H
and convenience retail offerings back into previously unaffordable
7.0% 8.0%
precincts in the CBD.
The creation and strengthening of new precincts from new
developments within the CBD, further dispersing retail from the
traditional Bourke Street Mall, Swanston Street and Elizabeth Streets,
to the Western and Northern cores of the CBD.
September Gross Face Rents Melbourne CBD Gross Incentives
$12,000
$10,000 0.08
0.07
0.06
$8,000
0.05
%
0.04
$6,000
0.03
0.02
$4,000
0.01
0
$2,000
Jun-12
Jun-14
Jun-16
Jun-18
Jun-15
Jun-19
Jun-13
Jun-17
Mar-12
Mar-14
Mar-16
Dec-10
Mar-18
Sep-10
Mar-15
Mar-19
Mar-13
Dec-12
Dec-14
Sep-12
Sep-14
Dec-16
Dec-18
Dec-15
Sep-16
Sep-18
Sep-15
Mar-17
Sep-19
Dec-13
Sep-13
Jun-11
Dec-17
Sep-17
Mar-11
Dec-11
Sep-11
$0 Incentive
High Low High Low High Low
Collins Street Bourke Street Shopping Centres & Arcade
Source: Colliers International Source: Colliers International
8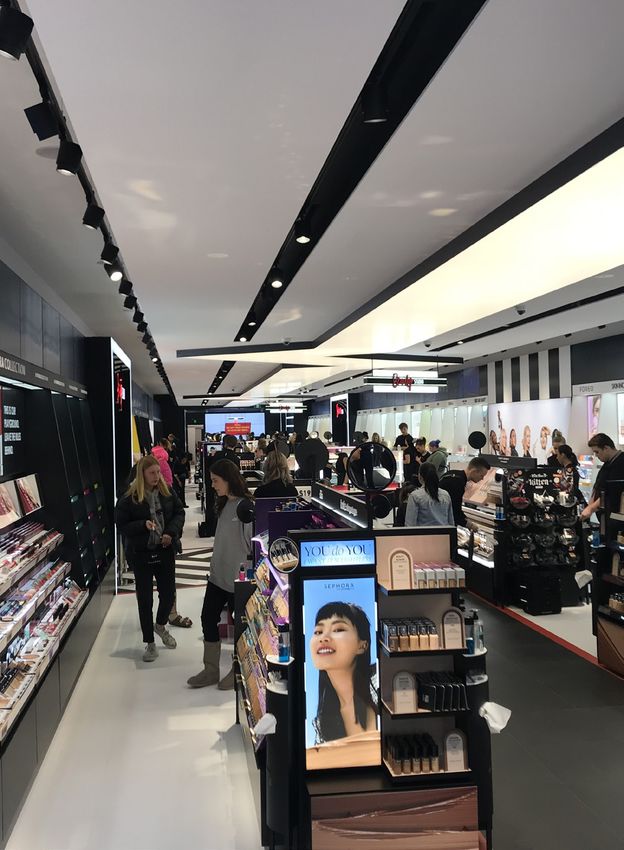
RETAIL | Research & Forecast Report | H2 2019

By Sarah Walker                                                            Western Core
Manager | Research
sarah.walker@colliers.com                                                  The Western Core is undergoing gentrification, growing at a rapid
                                                                           pace underpinned by major new developments that are in the
Leasing Market                                                             pipeline and under construction. ‘Collins Arch’ at 447 Collins Street
                                                                           due for completion early 2020, incorporates a W Hotel and at
Population growth in Victoria is supported by overseas migration,
                                                                           pedestrian level, a 1,900sqm Market Street public park (Melbourne’s
interstate migration and natural increases, As a result, Victoria has
                                                                           first park in 40 years) plus six new retail offerings. This new
recorded the largest population growth year on year compared to any
                                                                           development will increase pedestrian foot traffic between Collins
other Australian state at 2.5 per cent. Gross face rentals differ vastly
                                                                           Street and Flinders Lane and transform the precinct into a seven
within each of the CBD precincts. However, over the last six months
                                                                           day a week trade. Once completed, the ‘Olderfleet’ at 477 Collins
rents have remained stable in all precincts. Collins Street rents range
                                                                           Street will also provide additional retail amenity between Collins and
between $1,200/sqm to up to $10,000/sqm, Bourke Street ranges
                                                                           Flinders Lane.
from $2,000/sqm to up to $11,000/sqm and shopping arcades and
centres average $1,500/sqm. Incentives have recorded a small               Several upcoming lobby refurbishments, including 31 Queen Street
increase after a two-year period previously averaging approximately        (purchased this year by AEW Capital), will have a Flinders Lane
7 per cent, increasing one percentage point to 8 per cent as at the        address once completed. The ground floor will have a foyer café,
end of September as landlords offer a longer period of incentive to        business hub and 200sqm restaurant. GPT’s 530 Collins Street
remain competitive and fill vacancies.                                     is also undergoing a lobby upgrade with the previous food court
                                                                           tenancies being re-offered to market.
Investment Market                                                          Over the last three years, a single landlord has purchased all strata
37 & 39-41 Little Collins Street located at the Paris End of Collins       titles at the McPhersons Building at 546 Collins Street. The retail
Street transacted in June for a combined total of $22.35 million –         sites will be internally refurbished and leased on completion. Across
180% above the Vendor’s reserve. The sale comprised two separate           the road, Charter Hall’s earmarked development at 555 Collins
titles – 37 Little Collins a two storey fully refurbished art-deco         Street, as well as Brookfield and ISPT’s mixed use development
building tenanted by Bar Lourina, a tapas and fine wine destination.       at 405 Bourke Street, will increase workforce numbers within the
39-41 Little Collins is a three-storey hospitality and office building,    Western Core. Even more foot traffic to the Western Core will be
the ground floor tenanted by Italian dining institution ‘Lupino’. The      provided with the influx of hotels (the St Regis, W Hotel and Ritz
campaign by Colliers International generated over 200 enquiries with       Carlton) transforming the area from a 9-5 business hub to a 24
interest from both international and domestic buyers. The surge in         hour/ 7 day a week densely populated pocket of the city.
sentiment following the federal election and recent changes in fiscal
policy as well as the lack of quality freestanding assets in prime
locations in the city. The combined sale of these two addresses
reflected a sharp yield of 1.16% for 39-41 Little Collins and 2.20 per
cent for 37 Little Collins. Yields in the CBD are sharpening due to
higher sale prices and steady rents.

Mernda Junction Shopping Centre, Mernda, VIC
Leased on behalf of Mernda Junction Shopping Centre Pty Ltd

9
RETAIL | Research & Forecast Report | H2 2019

Consumer sentiment and adapting department store
The Australian economy is supported by increased wages growth,
current low inflation (1.6 per cent) and low interest rates, an
environment that should create increased consumer confidence and
spending. However, the Westpac Consumer Sentiment Index is at
record low levels (92.8 at October 2019). Weak economic growth,
annual GDP growth through the year to June 2019 was 1.4 per cent,
on track for 28 years of uninterrupted economic growth ,however,
still below 2 per cent. The retail market is affected by consumers
scaling back purchases of household goods, new vehicles and
discretionary spending and retailers are responding to these changes
in consumer spending.

A notable victim of changing retailer habits are department
stores. Department stores have struggled to adjust to the shift in
the younger generation who want more boutique, personalised
experiences. David Jones have reduced their overall footprint from
two stores along Bourke Street Mall, amalgamating to one store.
The menswear store will be sold with the new store having an
emphasis on luxury products responding to the uplift in spending in
this retail sector. Myer is also adapting by giving up the lease of the
top floor of their Bourke Street footprint, to be replaced by flexible
workspace. The basement of the department store has been re-
opened in October this year as a Harry Potter concept store – the
first of its kind in Australia. This is a clever response to the need to
enhance the customer shopping experience by creating a need to
physically visit stores and stay longer with enhanced experiences          Queen Victoria, Melbourne
only achieved visiting a physical store. Vicinity has successfully
brought this to the Emporium, one of the most successful department
stores in Melbourne, by incorporating pop-up stores that can quickly
respond to trends and create experiences that can’t be created online
(examples include the recent KitKat popup and E-Sports area to open
next year).

Northern Core
The Northern end of the city has benefited from the growth of
Melbourne’s Asian population in this pocket of town which has had
a knock-on effect for the local retail sector. Retailers are keen to
be located close to RMIT, Melbourne University and new student
accommodation and are fiercely competing to be at the epicentre of
this community along Elizabeth Street between La Trobe and Therry
Street. Student accommodation towers such as 383 Swanston
Street and 599 Swanston Street have secured retail operators such
as Sharetea, Ezymart and International Japanese Souffle operator
who are harnessing this demand. In proximity new developments
include Wesley Place, a 34 level commercial office tower with ground
and lower level retail and the Bennetts Lane development which
will include a laneway revitalisation through retail that responds to
the surrounding Asian food and beverage offerings. Together these
developments will provide approximately 10,000sqm of retail. In the
last 12 months there has been number of new and existing hospitality
groups such as Prime’s Hai, Hui Lau Sahan, Hungry Jacks, Chunky
Town and Red Spice Road all signing new deals or opening new
retail outlets within this catchment.

                                                                           Town Hall, Melbourne Metro Tunnel, VIC

10
RETAIL | Research & Forecast Report | H2 2019
BRISBANE
OVERVIEW
Market Indicators - December 2019 Private investors, developers and syndicates driving retail investment
volumes in Queensland in 2019.
AVERAGE NET FACE RENTS ($/m2)
CBD Prime Confidence returning to the Brisbane CBD leasing market on the
L H back of the transport infrastructure investment transforming the
$1,500 $7,000 dynamics of the city.
AVERAGE YIELDS Household hardware and supermarket retailers driving retail
CBD Prime development supply in middle and outer suburbs in Brisbane in 2019.
L H
4.8% 6.0%
AVERAGE INCENTIVE
CBD Prime
L H
17.0% 18.0%
Queensland Retail Sales ($5 mill+) Retail Brisbane CBD Prime Rents and Incentives
$1,800 $6,000 20%
$1,600 $5,500 18%
$5,000 16%
$1,400
$4,500 14%
$1,200
$4,000 12%
AUD$ (millions)
$/sqm
$1,000 $3,500 10%
%
$800 $3,000 8%
$600 $2,500 6%
$400 $2,000 4%
$200 $1,500 2%
$1,000 0%
$-
Sep-20
Sep-22
Sep-24
Sep-26
Sep-28
Sep-25
Sep-29
Sep-23
Sep-27
Sep-10
Sep-12
Sep-21
Sep-14
Sep-16
Sep-18
Sep-15
Sep-19
Sep-13
Sep-17
Sep-11
Brisbane - CBD Brisbane - Metro QLD - Other Gross Face Rents Incentives
Source: Colliers Edge Source: Colliers Edge
11RETAIL | Research & Forecast Report | H2 2019
By Karina Salas existing podium at 71-89 Adelaide street is currently under Council
Associate Director | Research assessment. All of these leasing deals show that retailers of high
karina.salas@colliers.com
calibre have faith and confidence in the Brisbane CBD retail market.
Investment Market Colliers International anticipates that the transformation of the Queen
Street Mall providing a renewed retail experience in the CBD will
Domestic capitals continue to drive investment
take shape over the next 2-3 years. This is expected to happen once
demand
the Cross River Rail and the Brisbane Metro are closer to reach
Capital flowing into the Queensland retail market has softened in
practical completion and the Queen’s Wharf hotel, restaurants and
2019 compared to the activity seen in 2018. Over the year to date,
public space open to the public by late 2022. The Queens’ Wharf
a total of $1.36 billion worth of retail assets in Queensland have
development is forecast to create 8,000 new jobs once operational,
transacted compared to circa $1.83 billion retail sales recorded
which represents an increase of 5.5 per cent on the Brisbane CBD
in 2018. Whilst still a few weeks remain in 2019, we expect the
labour force (144,700 jobs), and potentially is expected to support an
investment activity will fall slightly short compared to the activity
increase in the CBD foot traffic of the similar scale.
recorded in 2018.
Average gross face rents in the CBD have held steady at $4,250/sqm
Colliers International has witnessed an increase in activity from
over the past three quarters. Colliers International has witnessed
private investors, developers and syndicates acquiring approximately
leasing deals for new developments in Queen Street mall at $8,000/
64 per cent of the volume of sales (approximately $872 million) for
sqm, anticipating the upward pressure on rents on exclusive
the year to date. Domestic capital has historically dominated the
locations. Incentives have trended downwards to 17.5 per cent over
Queensland retail investment market and 2019 has not been the
the past three months due to the nature of the stock and the lower
exception, with nearly $910 million acquired by domestic investors.
vacancy on the market.
The most notable Queensland transaction occurring over the year to
Solid development activity in middle and outer-ring
date was the $250 million sale of Noosa Civic Town Centre offloaded
locations
by QIC Property Fund and purchased by the private domestic
Colliers International has witnessed a concentration of retail
developer and investor, Mark Stockwell. The transaction included
development supply in Brisbane middle and outer-ring suburbs in
the acquisition of Noosa Civic Shopping Centre, Noosa Emporium,
2019, and we expect this trend will continue into 2020.
Noosa Commercial and Noosa Business Centre plus vacant and
underutilised land for future commercial and residential expansion. Some of the largest projects already completed or expected to reach
The Noosa Civic Shopping Centre offers 20,091sqm of gross lettable practical completion in 2019 include the new Costco store in Ipswich
area to over 90 tenants, with Big W and Woolworths as its anchors. and new and refurbished space occupied by Bunnings Warehouse
Noosa Emporium is a 7,064sqm large format retail complex spread in Newstead, Lawnton, Acacia Ridge and Virginia. This trend reveals
across 13 tenancies. that supermarket, grocery and household hardware retail operators
have identified Brisbane as a strategic location for expansion due to
Other notable recent sales include the Arndale Shopping Centre
its growth potential.
anchored by Coles Supermarket and purchased for $35.5 million by
a local developer intending to undertake a $15 million redevelopment In 2020, we expect to see new and refurbished development activity
program. in neighbourhood shopping centres located in middle and outer
suburbs. The Coles Flagstone Village Shopping Centre, located in
Generally, yields fluctuate in the range of 5.0 per cent to 7.0 per cent,
Logan City, is expected to open to the public by Q2 2020 offering up
depending on the location and tenant profile. Assets offering secured
to 10-specialty tenancies. The Flagstone Village Convenience Centre,
long-term WALE attract yields in the 5.25 per cent to 6.5 per cent.
owned by Stockwell and anchored by Woolworths, is another new
Leasing Market development in the Logan City region. It is expected to be completed
by mid-2020 and will offer over 20-specialty stores. The potential
CBD leasing activity on the rise of business growth within these two shopping centres is promising
Confidence is returning to the Brisbane CBD retail market on the when we take into account the availability of land for further
back of transport infrastructure investment projects and the $3.6 residential development in the area.
billion Queens Wharf Entertainment Precinct, promising to reshape
The Distillery Road Market development, also located in Logan City
the dynamics of the city.
along the growth corridor between Brisbane and the Gold Coast,
Colliers International has witnessed a number of off-market is another exciting project in outer Brisbane. This development is
repositioning deals with major retailers strategically taking up space expected to open to the public by December 2020, offering a unique
on Queen Street Mall. High-end market retailers, like Swarovski retail and entertainment experience to cater for locals and tourists
and Michael Hill commenced operations over the past few months and capturing both, the Brisbane and Gold Coast markets.
and Hermes have recommitted and expanded their footprint at
their current location on 171 Edward Street. Also, the development
application for a third Coles Supermarket store in the city offering
940sqm of gross floor area and located on the upper level of the
12RETAIL | Research & Forecast Report | H2 2019
GOLD COAST
OVERVIEW
Market Indicators - December 2019 Multinational supermarket chains target the Gold Coast for future
expansion due to market niche growth potential.
COOMERA
Average Gross Face Rents ($/sqm)
Large format retail (LFR) expansion within the Northern Corridor
L H
supported by net internal migration.
$550 $700
PALM BEACH Gold Coast retail landlords on the front foot offering retail experience
Average Gross Face Rents ($/sqm) and enhancing the use of space.
L H
$450 $750
BURLEIGH HEADS
Average Gross Face Rents ($/sqm)
L H
$650 $1,200
Gold Coast Retail Sales ($5 mill+) Annual Population Growth
5%
$1,400
4%
Annual Population Growth (%)
$1,200 4%
AUD$ (millions)
$1,000 3%
3%
$800
2%
$600 2%
$400 1%
1%
$200
0%
$-
Gold Coast Queensland Australia
Source: Colliers International Source: Colliers International
13RETAIL | Research & Forecast Report | H2 2019
By Karina Salas million and also includes the creation of permanent jobs in the range
Associate Director | Research of 200 to 300 once operational. This is equivalent to 1-1.5 per cent of
karina.salas@colliers.com
the regional unemployed labour force (20,400 unemployed in August
Tightly held investment market 2019).
Following the solid volume of retail sales reported in 2018, the retail Northern corridor leading development supply
investment market in the Gold Coast has been very tightly held, with Experts have highlighted the current similarities of the Gold
the volume of sales for the year to date sitting at approximately $69 Coast Northern Corridor and North Lakes at the beginning of
million and just a handful of transactions completed from January to the millennium. Both regions have offered (at different points in
September 2019. time) available land to support residential, commercial, retail and
The most notable settled sale over the year to date was the industrial growth within 30 minutes to the capital city and solid net
transaction of the Pacific Pines Town Centre for $30.1 million at internal migration backing retail demand (the Ormeau-Oxenford
an estimated yield of 6.1 per cent. The neighbourhood shopping region welcomed 6,531 net internal migrants in 2018 out of 7,679
centre, now owned by the PGA Group, has Woolworths as an net internal migrants recorded in the Gold Coast). Transport
anchored tenant and is located within the Northern Gold Coast infrastructure investment is also promising with the Coomera
corridor wherein population growth continues to drive retail activity. Connector project (currently under feasibility stage) proposing the
Interestingly the PGA Group also owns the Hope Island Coles based construction of an alternate motorway to the M1 Pacific Motorway
centre close by, which has faced renewed competition of the new from Nerang to Loganholme.
Hope Island Woolworths in the same neighbourhood. Retail development supply is largely concentrated within the
Private investors and developers have grasped the very limited northern corridor. The $30 million Ormeau Village Shopping
opportunities at market yields generally in the range of 5.5 to 6.5 per Centre commenced operations in quarter three 2019, with Coles
cent. Supermarket as an anchor tenant and adding circa 4,900sqm of
retail floor space.
Multinational supermarket chains set eyes on the
Gold Coast Developers have shown strong interest in the LFR market along the
Northern Corridor connecting Brisbane and the Gold Coast. Some
Wholesale supermarket retail activity is set to transform the retail
of the potential LFR developments under consideration include the
experience for families in the Gold Coast, with two of the largest
$200 million Home Focus Pimpama and the $50 million Coomera
multinational chains announcing future operations or looking for
Home Ideas Centre. Both projects are still subject to development
suitable sites to expand their business activity. Kaufland and Costco
approval. However, the interest from large retailers seems to support
has identified the Gold Coast as a region offering growth potential
the project feasibility. The Coomera Home Ideas Centre is expected
underpinned by solid historical and forecast population growth.
to offer circa 28,000sqm of floor space The Home Focus Pimpama
According to the ABS, population growth in the Gold Coast has centre has secured pre-commitments of 16,500sqm (equivalent to 31
historically outperformed the population growth in Australia and per cent of the 53,000sqm floor space).
Queensland. The Gold Coast has recorded a cumulative population
growth of 26 per cent over the past decade (equivalent to an
Retail experience driving business decisions
annual compound growth of 2.3 per cent and above the Australian As the retail sectors continues to transform into an experienced-
annual compound growth of 1.6 per cent). The Queensland State based service, landlords in the Gold Coast continue to implement
Government forecasts an annual compound population growth strategies to boost foot traffic, improve the retail experience and
in the Gold Coast of 2 per cent to 2041, and outperforming the improve the use of space.
forecast population growth in Queensland of 1.6 per cent a year. This Pacific Fair has recently partnered with Mercedes Benz Gold Coast
means that the Gold Coast population is expected to reach 961,000 to offer a premium car service allowing customers to be chauffeur-
residents by 2041, significantly increasing the market niche for retail driven from their home or hotel to as far north as Brisbane and down
businesses, particularly for supermarkets and grocery operators. towards the Northern NSW regions. This is a first-to-market service
Kaufland purchased a 3.3 hectare site at 197 Reedy Creek Road in in Australia offered at request of retailers to their selected customers
Burleigh Heads for $19.74 million in July 2018. The project seems and free of charge.
to be stalled, as the land zoning must be modified to allow a retail Australia Fair has also launched a five-star office service located
development of the scale of the Kaufland module. on level 10 of the shopping centre, and offering 37 suites ranging
Colliers International has market insights that Costco Wholesale in sizes of 10 to 50sqm under flexible leasing conditions. This is
has targeted the Gold Coast as a preferred location for the third another business strategy placing the Gold Coast retail market on the
store in Queensland. At present, Costco has 11 stores throughout front foot of a globalised economy wherein innovative and shared use
Australia and two of them are located in Greater Brisbane. The first of space has become the norm and not the exception.
one opened in North Lakes in 2014 and the second one opened in
Ipswich just a few months ago. The economic-multiplier effect from
having a Costco or Kaufland alike store in the region extends beyond
the initial capital investment generally sitting in the range of $20-30
14RETAIL | Research & Forecast Report | H2 2019
ADELAIDE
OVERVIEW
Market Indicators - December 2019 Investment volumes remain strong with over $91.4 million of property
transacting in 2019 which is above the $87.3 million sales volume in
AVERAGE NET FACE RENTS ($/m2) 2018.
Prime
L H Metro markets have driven sales volumes in 2019, with 70 per
$2,000 $3,750 cent of office investments originating from this market. The Fringe
markets have seen an even higher level of activity, with $27.2 million
of assets changing hands within the year.
AVERAGE YIELDS
Prime
New supply in the Fringe and Metro markets is predicted to increase,
L H
with 2,641 sqm under construction and a further 32,200 sqm in the
4.8% 6.0%
approvals process. A further 4,390 sqm in the Adelaide Fringe is
currently under refurbishment.
AVERAGE INCENTIVE
Prime Vacancy in the metro markets has increased to 4.5 per cent, an
L H increase from the record low of 3.6 per cent however well below the
15.0% 15.0% five-year average of 6.3 per cent.
Land tax is a looming risk to Adelaide property markets, with regards
to the state governments proposed changes to allow for aggregation
across property portfolios – elaborated further below.
SA Retail Supply Rundle Mall
140 5.0%
4.5%
120
4.0%
100 3.5%
3.0%
'000s sqm
80
2.5%
60
2.0%
40 1.5%
1.0%
20
0.5%
0 0.0%
2013 2014 2015 2016 2017 2018 2019 2020 2021 2022 2023
New Stock Refurbishment
Source: Colliers International Source: Colliers International
15RETAIL | Research & Forecast Report | H2 2019
By Kate Gray Westfield Marion has seen a 50 per cent share sold by Lendlease, to
Director | Research Singapore Press Holdings for $670 million. The completion of this
kate.gray@colliers.com
sale will see a record year for retail sales volumes. The Adelaide
Adelaide’s largest shopping centre Westfield Marion has seen a shopping centre market is dominated by private investors who
50 percent stake sold by Lendlease to Singapore Press Holdings tend to be long term holders which limits transaction volumes. We
for $670 million. This sale was a nine per cent discount on the are however seeing renewed interest, particularly from interstate
June book value, and 2.9 per cent discount on the September book investors in the Adelaide retail market. Although there is limited stock
valuation. The remaining 50 per cent stake is retained by Scentre being offered to the market, we are expecting increased off market
Group. activity as these investors seek opportunities to invest. Many are
looking for opportunities to upgrade and review tenant mix. Recent
Retail sales in SA have seen annual growth of 2.0 per cent in August
examples include Renmark Plaza and Golden Grove Shopping Centre
which is below the national average of 2.6 per cent. Household
where these upgrades have led to very low vacancy and improved
goods and other retail have seen growth with clothing and footwear
trading performance.
and café & restaurants falling over the year. Food retail has seen
steady annual growth of 1.7 per cent. This slowing in retail sales The retail leasing market has seen challenging conditions due to
growth is restricting new demand in the retail property sector. slower trading conditions. While food and beverage tenants were
driving demand, with the slowdown in retail sales in this sector,
The supermarket sector is set for more competition as Kaufland start
demand has also slowed. Landlords need to be proactive including
construction on two stores in Adelaide. One of the main franchisees
investment in public spaces infrastructure, amenity and upgrades to
in the Foodland brand has separated from the Metcash network with
fit outs to continue to attract and retain tenants within their centres.
the opening of their 55,000sqm distribution centre and rebranded
Those that engage with tenants and look strategically at their tenant
their store network to “Drakes”.
mix are seeing lower vacancy as a result.
Burnside Village has development approval to expand their centre
In the Adelaide CBD, Rundle Mall has seen vacancy fall and several
by a further 18,000 sqm. The plans include cinemas, new food
tenants either move or refurbish over the last 12 months. Sephora
precinct, bars and high-end fashion. There is also plans to include
have opened their first Adelaide store on Rundle Mall in early
medical/office space in this development. Construction is expected to
October. Maple tree are also undertaking a full refurbishment of the
commence early in 2020 with completion in early 2022.
ground floor and public realm of 11 Waymouth Street with a new food
Rundle Mall vacancy has seen vacancy fall to 3.0 per cent down from offering expected. This is one part of the plaza developments which
4.2 per cent in 2018. Sephora is the latest new international addition includes the recently completed GPO exchange and the proposed
to Rundle Mall with their first SA store opening in October. There has Westin hotel development. This precinct is part of the ‘laneways’
been significant refurbishment activity and tenant movement along from River Bank to Central Markets and provide and extension from
Rundle Mall including L’Occitane, Pandora, Strandbags, Hype DC and Peel St/Leigh St and Topham Mall.
Forever New all either refurbishing their store or moving into new
Vacancy along Prospect Road is at historic lows. This is after
locations along Rundle Mall.
significant investment from the City of Prospect in the public realm
Supermarket sector sees increased competition and the completion of the cinema complex by the Maras Group which
The supermarket sector is set for more competition. This is the most is now fully occupied. Vacancy along Jetty Road has fallen marginally,
active part of the Adelaide retail market with the entry of Kaufland, with a vacancy rate of 6.2 per cent. The Parade, Norwood has also
Aldi’s continued expansion and the rebranding of Drakes which seen an increase in vacancy which is due to the completion of three
were under the Foodland banner which is a Metcash brand. New new mixed use developments, two being apartment developments
retail supply is being driven largely by the expansion of Aldi and the with ground floor retail.
entry of Kaufland to the Australian market. Kaufland has commenced King William Road is two thirds through a $15 million infrastructure
construction on two stores in Adelaide. The former LeCornu’s redevelopment. The whole road has been replaced between Union
Keswick site was the first site Kaufland purchased in Australia, but and Mitchell Streets, with new curbs, footpath and tree plantings.
it has taken some time to obtain approval but has now commenced This development is expected to be completed in February 2020.
construction. The Prospect store (6,626sqm) started construction in Prior to commencement of this work, vacancy along King William
September is expected to be the first Kaufland to open in Australia Road was consistently high. As the development progresses, we are
with the Keswick store likely to be the second or third store. seeing a renewed interest from tenants and it is expected that once
In a further shakeup, Drakes who own 50 stores across South road works is completed vacancy will be significantly lower.
Australia and Queensland has separated from Metcash under the
Foodland brand. Drakes have recently opened their purpose-built
distribution centre and rebranded their stores to Drakes. Their more
recent developments have focused on a smaller format, longer
opening hours stores which provide a wide product offering focusing
on fresh food with ready-made options.
16RETAIL | Research & Forecast Report | H2 2019
PERTH
OVERVIEW
Market Indicators - September Population growth continues to improve, rising to 1.0 percent per
2019 annum in March 2019. This further assisted growth in Food, Café,
AVERAGE NET FACE RENTS ($/m2) Restaurants etc., ‘Clothing and Soft Goods’ and ‘Other Goods’. Other
Prime retail sectors such as household goods are still struggling with
declining turnover.
L H
$2,100 $4,165
WA Consumer confidence suffered the largest fall in four years in
the September 2019 quarter. CCIWA’s Consumer Confidence Survey
AVERAGE YIELDS recorded a fall in short-term confidence from 117.5 in June to 109.4
Prime in September. Medium-term confidence also fell, decreasing 7.8
L H percent from 116.2 in June to 107.7.
4.75% 5.5%
Despite modest growth in total sector turnover, the depressed state of
Perth’s residential market, slow wages growth, rising debt, cost of living
AVERAGE INCENTIVE
and uncertainty about economic growth all contributed to the slide in
Prime
consumer confidence and weak retail spend per capita.
L H
10% 20%
Rents remain under pressure as vacancies rise and demand for
space remains relatively weak in the Perth CBD and more generally
across suburban locations. Retailers continue voicing concerns about
slow trading conditions.
Lacklustre trading conditions and slow tenant demand has
contributed to a delay in commencement at major retail space
expansion projects as owners await recovery in market sector
conditions; 2019 retail supply likely to be the lowest since 2013.
Perth CBD Average Retail Yields Perth CBD Mall & High Street Average Rents
9% $4,500
$4,000
8%
Average Gross Rate $/Sqm
$3,500
7%
$3,000
6%
$2,500
5%
$2,000
4% $1,500
3% $1,000
Sep-09
Mar-10
Sep-09
Mar-12
Mar-14
Mar-16
Mar-18
Mar-15
Mar-19
Sep-10
Mar-13
Sep-12
Mar-17
Sep-14
Sep-16
Sep-18
Sep-15
Sep-19
Sep-13
Mar-10
Sep-17
Mar-12
Mar-14
Mar-16
Mar-18
Mar-15
Mar-19
Sep-10
Mar-13
Sep-12
Sep-14
Mar-17
Sep-16
Sep-18
Sep-15
Sep-19
Mar-11
Sep-13
Sep-17
Sep-11
Mar-11
Sep-11
Source: Property Council of Australia, Colliers International Source: Colliers International
17RETAIL | Research & Forecast Report | H2 2019
By Quyen Quach Investment activity
Associate Director | Research
quyen.quach@colliers.com Demand for Perth retail assets remained buoyant over the first three
quarter of 2019. However, transaction activity is expected to be lower
Current retail market conditions than in previous years. In the three quarters ending September 2019,
In general, Perth retailers are continuing to experience subdued eight transactions totalling $178.3 million had been confirmed, down
trading conditions, despite total sector turnover growing 3.17 per from 21 transaction totalling $521 million in 2018. As was the case
cent year-on-year in the September quarter 2019. Calculated WA per in other sectors, this is mostly a function of low volume of quality
capita spend had been falling in real terms, and is estimated to have assets available for sale.
declined 0.46 per cent over the year to September quarter 2019.
Major transactions so far in 2019 included the Colonnade Subiaco -
The moderating per capita spend was driven by weak consumer $37.85 million, Woolworths Banksia Grove - $27.3 million and Trinity
sentiment as cost of living and household debt servicing concerns Village in Alkimos - $34.05 million. Two regional neighbourhood
persist in a soft wage growth environment. These concerns were centres also transacted; Coles Orana and The Village Margaret River
exacerbated by persistent housing market weakness, simmering sold for $22.8 million and $20 million respectively.
global trade tensions and uncertainty about the state’s economic
Retail yields remained attractive due to the widening spread with
outlook.
eastern city yields for comparable assets. Investors have targeted
However, after three years of declines, the ‘Household Goods’ sector neighbourhood centres due to their tenant mix, which tends to have
is showing signs of recover alongside the stabilising housing market; lower exposure to discretionary spending and online competition.
‘Households Goods’ turnover grew 0.48 per cent in the year to
Appetite for assets with comparatively strong free cashflow has
September 2019.
driven market yields and IRR’s lower during the past year. Analysed
Alongside the positive signs in ‘Household Goods’ turnover, market yields for neighbourhood centres averaged 6.38 per cent in
population growth has underpinned expansion in ‘Clothing & Soft 2019, down from an average of 6.51 per cent in 2018.
Goods’, ‘Other Goods’, Cafe, Restaurants etc.’ and ‘Food’ turnover;
these sectors grew 6.88 per cent, 6.19 per cent, 4.26 per cent and The Outlook
2.93 per cent respectively over the year to September 2019. The short-term outlook for WA’s retail sector looks likely to remain
Notwithstanding the past soft trading conditions, there are retailers subdued, although we do expect further improvement in overall
chasing space in the Perth market, which should aid space demand. sector turnover. Increased retailer competition over past years,
International brands like French based Sephora and Decathlon are combined with per capita spend moderation, means some individual
looking at opportunities to open stores in the near future. Other retailers could struggle to grow turnover.
parties actively in the market for space include TK Maxx, Kaufland, That said, an improving economic and jobs market outlook along with
James Lane and restaurant chain Guzman Y Gomez. lower mortgage rates and signs the residential market is bottoming
A tenant migration is underway on Kings Street, once the preferred may assist per capital spend in 2020. Accelerating population growth
home for luxury brands in Perth. Louis Vuitton and Kailis have and a potential residential construction recovery may support a
moved. Tiffany & Co is expected to relocate in 2020, and at least ‘Household Goods’ sales turnaround. Population growth should also
one other tenant is expected to follow. A factor driving tenants underpin further growth in ‘Food’, ‘Café, restaurants etc.’, ‘Clothing
from the precinct is the lack of capacity for the character buildings and Soft Goods’, as well as ‘Other Goods’ retailing.
to accommodate large store footprints without the requirement for Additionally, the moderating CBD office vacancy combined with state
stairs. and local government initiatives to increase CBD visitation, could
Soft tenant demand and rising vacancy has resulted in average Perth deliver improved trading conditions for CBD retailers in 2020.
CBD malls rents moderating 3.5 per cent over the year to September
2019; they currently average $3,135/sqm per annum gross. Incentives
have also risen to an average of 15 per cent from 13.5 per cent a
year ago.
Retail supply update
After 2018’s strong supply year of 169,250sqm, Perth saw just
11,750sqm of space completed in 2019. The additions largely came
from new small neighbourhood centres and minor expansions, the
largest was Woolworths Applecross at 4,815sqm. The refurbishment
of ISPT’s Forrest Chase has also been completed.
Currently 68,131sqm is under construction and scheduled for delivery
in 2020. These projects include Costco’s facility at the Perth Airport,
retail space at the Kings Square redevelopment in Fremantle and
Karrinyup Shopping Centre’s expansion. 1 Barrack St, Perth, WA
Leased on behalf of Old Perth Port Pty Ltd
18RETAIL | Research & Forecast Report | H2 2019
NEW ZEALAND
OVERVIEW
Market Indicators - December 2019
Retail conditions remain challenging, however there is some uplift
AVERAGE NET FACE RENTS ($/m2)
in retail spending in the past year which is assisting retailers and
Prime providing a more confident outlook for the sector
L H
AUCKLAND
$1,185 $1,920 There has been a significant increase in the total floor area
consented for the retail sector in recent years, dominated by a few
AVERAGE YIELDS particular projects in Auckland. These are likely to complete in the
Prime next six months, providing many new opportunities for tenants. Not
L H all space is likely to reach full commitment upon completion.
4.60% 6.30%
Experienced retail property investors continue to favour the sector,
despite the challenging trading conditions. While investors are
AVERAGE NET FACE RENTS ($/m2)
typically focussing on prime assets in supportive catchments, some
Prime
investors are also re-evaluating the sector’s potentially higher
L H
yielding return opportunities in comparison to some other sectors.
WELLINGTON
$980 $1,410
However, with higher returns, typically comes higher risk, and
comprehensive due diligence is critical to the long-term successful
AVERAGE YIELDS outcome of these decisions.
Prime
L H
6.20% 7.20%
AVERAGE NET FACE RENTS ($/m2)
Prime
L H
CHRISTCHURCH
$400 $600
AVERAGE YIELDS
Prime
L H
6.0% 7.0%
Strip Retail Vacancy Rate (Overall) National Retail Building Consent Issuance
Auckland Wellington Canterbury Rest of North Island Rest of South Island
Auckland Wellington 4,000
13%
Consent Issuance (Cumulative Value) (Millions)
3,500
11%
3,000
Overall Vacancy Rate
9% 2,500
7% 2,000
1,500
5%
1,000
3%
500
1%
Dec-09
Jun-10
Jun-12
Jun-14
Jun-16
Jun-18
Jun-15
Jun-19
Jun-13
Jun-17
Dec-10
Dec-12
Dec-14
Dec-16
Dec-18
Dec-15
Dec-13
Jun-11
Dec-17
Dec-11
0
2000
2002
2004
2006
2008
2005
2009
2003
2007
2001
2010
2012
2014
2016
2018
2015
2019
2013
2017
1992
1994
1996
1998
1995
1999
1993
1997
2011
1991
Year Ending August
Source: Colliers International Source: Colliers International
19RETAIL | Research & Forecast Report | H2 2019
By Chris Dibble Given the rebuild activity, Canterbury building consent data shows
Director | Research & Communications that activity has dropped, with just under $100 million worth of retail
chris.dibble@colliers.com
property being consented in the year to August 2019, down from
Retail spending rising $140 million in the previous year. The highest retail consent issuance
recently was achieved in 2015 when $150 million worth of retail
A lift in retail spending was experienced across New Zealand, up
space was consented.
3.4 per cent in the year to June 2019. All categories experienced a
lift in spend over the past year. In the ‘bricks and mortar’ sectors, Outside of the main centres, activity has fallen slightly with $180
the largest percentage increases came from recreational goods million dollars’ worth of property being consented in the year to
and department store spending, up 10.2 per cent and 7.0 per cent August 2019, down 8 per cent from the year before. In contrast,
respectively. While competition in the food, grocery and beverage Gisborne, Hawke’s Bay and Nelson have experienced a significant lift
sectors limits the lift in spending, the sector continues to experience in building consent issuance.
higher trading volumes, pushing the sector to new heights. Rents edging up, yields edging down
Retailing demand Auckland net face rents have been steady, edging up slightly in the
Retail property located in catchments with strong fundamentals western suburbs which have experienced a strong rise in residential
continue to provide the best trading conditions for retailers. development. Average CBD prime rents have remained flat at $2,775
per sqm but are expected to rise upon the completion of Precinct
In the Auckland region, the latest vacancy survey showed varied Properties’ new Commercial Bay retail precinct.
conditions by location and sector. Strip vacancy in Auckland has
increased to 6.3 per cent in Q2 2019, up from 4.5 per cent a year Wellington CBD prime average gross face retail rents continue to
ago, reflecting challenging conditions for some small-to-medium increase modestly, reaching $1,349 per sqm in Q2 2019. Average
scale and local owned retailers. Demand for prime retail space within Lambton Quay rents are higher than these ranges and increased
the Auckland CBD remains buoyant, with an all-time low vacancy further, up an average five per cent over the past year.
of 1.4 per cent recorded in Q2 2019, representing just 1,600 sqm of Christchurch retail rents are also relatively flat with the central retail
available space. Shopping centre vacancy has risen to 3.3 per cent in precinct achieving rents typically ranging between $700 per sqm to
Q2 2019, up from 2.6 per cent a year ago. $1,250 per sqm.
In Wellington, high levels of tenant demand and a relatively static Rents outside of the main centres have remained relatively
supply pipeline have pushed vacancy rates down within the stable over the past year, with the largest increases in locations
Wellington region. The Golden Mile is experiencing a 9-year low with experiencing higher levels of tourism. Queenstown average prime
a vacancy rate of 4.1 per cent in Q2 2019. net face rents have rocketed to an average $2,000 per sqm in Q3
Demand in Christchurch continues to build as the retail sector 2019, up from $1,750 per sqm a year ago.
transitions into a more experienced-based retail destination. Vacancy There has been a wide variation in average prime retail yield
in the CBD has fallen to 15.1 per cent in 3Q 2019, down from 23.0 performance with investors focussed on quality assets. Average
per cent in 3Q 2018. Riverside, a boutique-style farmers’ market, has prime strip retail yields are achieving record low rates in some
recently been completed, bringing a range of high-end retailers to the hotspots, in some cases reaching sub-3%. However, outside
centre. destination hotspots, yields remain relatively flat, and in some cases
Supply pipeline mixed at a discount to other property sectors. This could start attracting
certain investors looking for higher-yielding returns.
The number of building consents issued for the retail sector that
covers new shops, restaurants and bars within New Zealand Transaction activity solid
decreased by 1.2 per cent in the year ending August 2019, while the Our analysis of commercial and industrial sales data shows
value of consents increased 7.0 per cent. purchasing interest remains strong for retail assets, with just under
In Auckland, we are tracking 255,400 sqm of space currently under 30 per cent of all 2019 transactions in the retail sector. This is similar
construction, as the region undergoes a lift in construction activity to previous years. Provisional data suggests $921 million dollars’
in progress. The supply pipeline will reduce next year due to the worth of assets have been transacted in 2019 so far. The recent
completion of several multi-million dollar developments such as marketing of the NZ$350 million plus portfolio of three prominent
Westfield Newmarket, Commercial Bay and Sylvia Park’s Fashion retail properties across New Zealand owned by Lend Lease could lift
Galleria. sales well into the billion dollar mark.
In Wellington CBD, several properties are undergoing seismic
strengthening and refurbishment programmes which will add to
retail stock shortly, however, significant new builds tend to be scarce.
With only 1,400 sqm of retail space currently under construction, we
expect activity to remain stable in upcoming years.
20You can also read