RETHINKING OFF-STREET - PARKING REGULATIONS AROUND STATION AREAS IN MUMBAI PROJECT REPORT
←
→
Page content transcription
If your browser does not render page correctly, please read the page content below
PROJECT REPORT

RETHINKING
OFF-STREET
PARKING
REGULATIONS
AROUND
STATION AREAS
IN MUMBAI
Inputs into the Mumbai Development
Plan 2014-34

                          Rethinking Off Street Parking Regulations Around Station Areas In Mumbai   1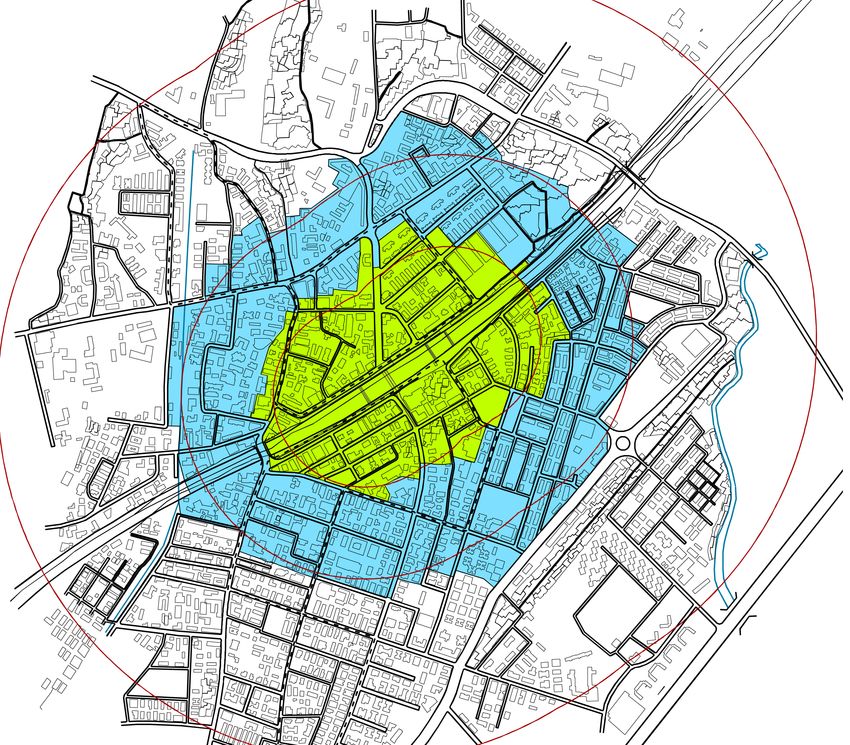
Authors
    Lubaina Rangwala,
    Senior Associate, Urban
    Development and Accessibility,
    EMBARQ India

    Sree Kumar K.,
    Managing Associate, Urban
    Development and Accessibility,
    EMBARQ India

    Pawan Mulukutla,
    Project Manager, Urban Transport,
    EMBARQ India

    Shalmali Kulkarni,
    Consultant, EMBARQ India

2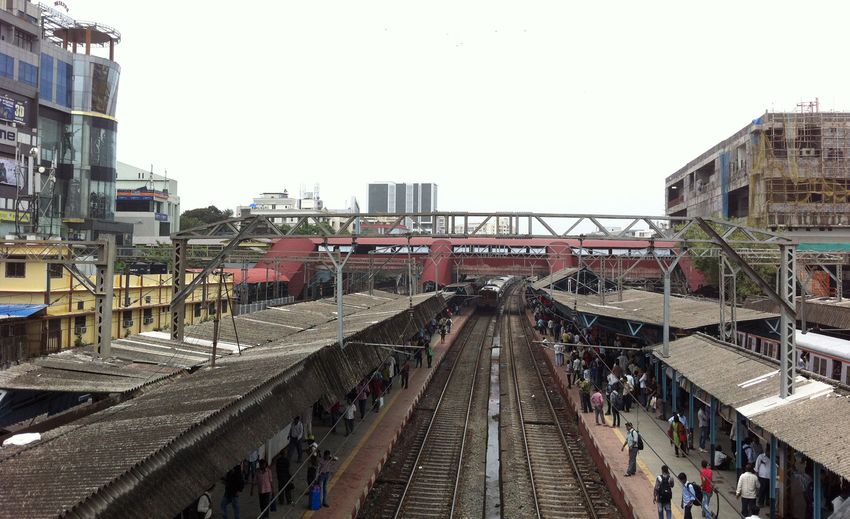
WRI India is a research organization with experts and
staff who work closely with leaders to turn big ideas
into action to sustain a healthy environment—the
foundation of economic opportunity and human
well-being. We envision an equitable and prosperous
planet driven by the wise management of natural
resources. We aspire to create a world where the actions
of government, business, and communities combine to
eliminate poverty and sustain the natural environment
for all people. WRI India works on a unique three-fold
approach highlighed below;

COUNT IT : We start with data. We conduct independent
research and draw on the latest technology to develop
new insights and recommendations. Our rigorous
analysis identifies risks, unveils opportunities, and
informs smart strategies.                                           EMBARQ India catalyzes and helps implement
                                                                    environmentally, socially and financially sustainable
CHANGE IT : We use our research to influence                        urban mobility and urban planning solutions to
government policies, business strategies and civil                  improve people’s quality of life in Indian cities. It is
society action. We test projects with communities,                  a part of the EMBARQ network, founded in 2002 as
companies, and government agencies to build a strong                a program of the World Resources Institute (WRI).
evidence base. Then, we work with partners to deliver               EMBARQ operates through a global network of centers
change on the ground that alleviates poverty and                    in Brazil, China, India, Mexico, Turkey, and the Andean
strengthens society. We hold ourselves accountable to               region.
ensure our outcomes will be bold and enduring.
                                                                    The EMBARQ network collaborates with local and
SCALE IT : We don’t think small. Once tested, we                    national authorities, businesses, academics and civil
work with partners to adopt and expand our efforts                  society to reduce pollution, improve public health,
regionally and globally. We engage with decision                    and create safe, accessible and attractive urban public
makers to carry out our ideas and elevate our impact.               spaces and integrated transport systems. EMBARQ
We measure success through government and business                  has built its global recognition on its local experience,
actions that improve peoples’ lives and sustain a healthy           and addressing national and international policies and
environment.                                                        finance.
www.wri-india.org                                                   www.embarq.org.

                                                         Rethinking Off Street Parking Regulations Around Station Areas In Mumbai   3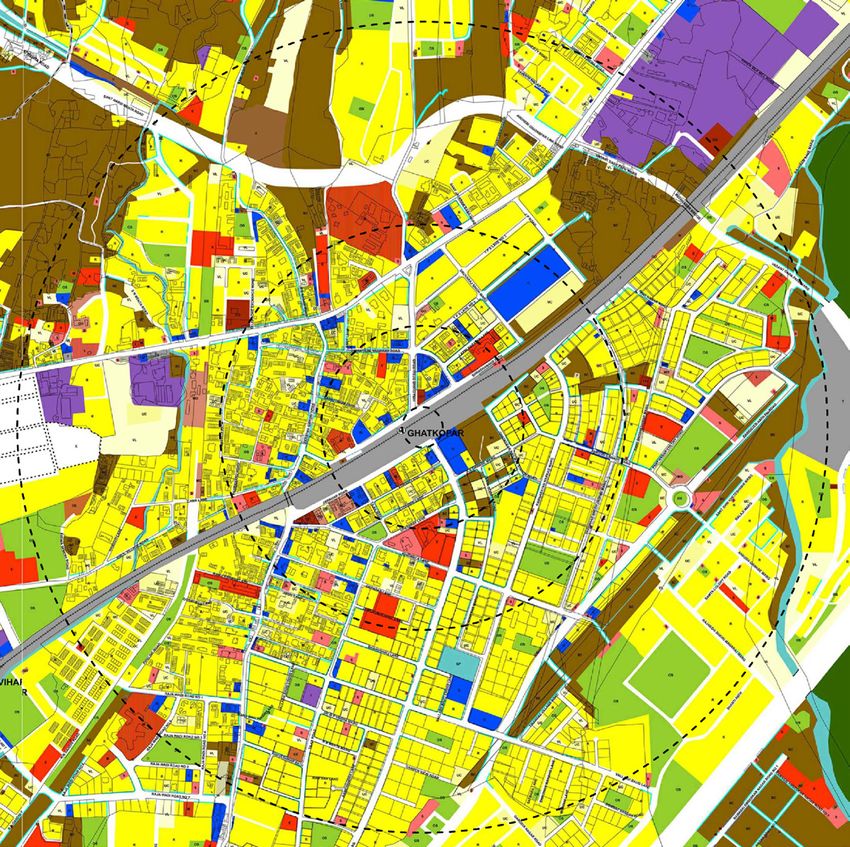
ACKNOWLEDGEMENTS
    The Project Report is an outcome of a yearlong              We would like to mention the time and effort of our
    engagement with the Municipal Corporation of Greater        external and internal reviewers:
    Mumbai (MCGM). We would like to acknowledge the
    support of the MCGM and EGIS India, Consultants to          Dr. Paul Barter, Parking expert and academic, Adjunct
    the MCGM DP Team. The need to rethink off-street            Professor at Lee Kew Yuan Yew School of
    parking norms for Transit Oriented Development (TOD)        Public Policy, Singapore, who served as the technical
    zones in the Mumbai Development Plan (DP) 2014-34           adviser on the project team and an external reviewer for
    was identified as a key issue during an initial meeting     the project report.
    with the Municipal Commissioner Shri. Sitarama Kunte,       Dr. Anjali Mahendra, Strategy Head, Research and
    MCGM on June 21st, 2013. We acknowledge the interest        Practice, EMBARQ India, and Rejeet Mathews,
    and time given by the Commissioner and Development          Project Manager, Urban Development and Accessibility,
    Plan team to encourage our study at the Ghatkopar           EMBARQ India, for their detailed reviews of the report.
    railway station.
                                                                The tireless efforts of the project team through duration
    In this regard, we would like to acknowledge the            of the study, and report compilation:
    following key members for their critical inputs, time and
    support through the study process:                          Lubaina Rangwala, Sree Kumar K., Pawan Mulukutla,
                                                                Rejeet Mathews, Sanjay Sridhar, Shalmali Kulkarni,
    Mr. V K Phatak, Expert Advisor to the Development Plan      Saritha Sudhakaran, and Lenin Sharma.
    (DP), Consultant, MCGM
    Mr. Kukunoor, Chief Engineer (DP), MCGM                     Finally, we want to acknowledgement the key technical
    Mr. Dinesh Naik, Chief Town Planning Officer, MCGM          inputs, support and special assistance of the following
    Ms. Anita Naik, MCGM                                        members from EMBARQ India:
    Mr. Hiren Daftardar, MCGM
    Ms. Champaka Rajagopal, Principal, EGIS India               Ramya Swayamprakash, Associate, Communications
    Mr. B.C. Khatua (I.A.S.Retd.), Chairman, Mumbai             and Marketing, EMBARQ India,
    Transformation Support Unit (MTSU)                          Surasti Puri, Consultant, EMBARQ India
    Ms. Sulakshana Mahajan, Urban Planning Consultant,          Madhav Pai, Director, EMBARQ India
    MTSU, and                                                   Amit Bhatt, Strategy Head, Integrated Urban Transport,
    Ms. Prachi Merchant, Programme Consultant (Housing),        EMBARQ India
    MTSU.                                                       Sonal Shah, Managing Associate, Urban Development &
                                                                Accessibility, EMBARQ India

4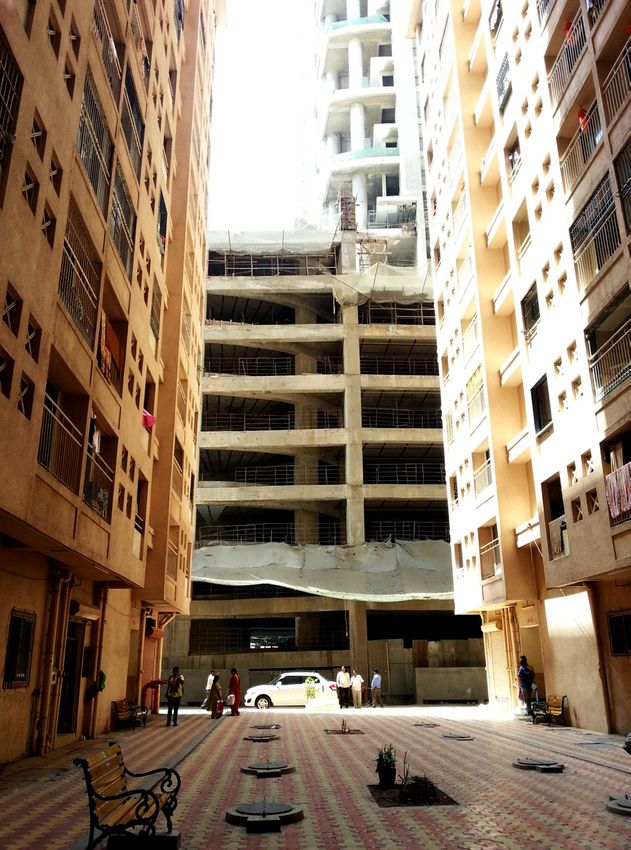
CONTENTS

  EXECUTIVE SUMMARY                                            6
  LIST OF FIGURES                                              9

I. INTRODUCTION                                              11
II. EXISTING SITUATION ANALYSIS                              19
III. REVIEW OF CURRENT DEVELOPMENT                           44
     CONTROL REGULATIONS
IV. APPROACH TO PARKING                                      47
V. FRAMING NEW REGULATIONS FOR TOD                           50
     AREAS IN MUMBAI
VI. TESTING AND ENGAGEMENTS                                  59
VII. CONCLUDING NOTES                                        61

  APPENDIX                                                   63
  REFERENCES                                                 68

                Rethinking Off Street Parking Regulations Around Station Areas In Mumbai   5
EXECUTIVE SUMMARY

    INVESTIGATING
    PARKING REFORMS
    WITHIN TOD ZONES
    IN MUMBAI
    Cities across the world are using parking as a tool to positively impact
    pedestrian and NMT accessibility, enhance public life, and reduce the reliance
    on cars within TOD zones.

    The Development Plan (DP) for Greater Mumbai is              (Rangwala, Mathews et al. 2014).
    currently under revision. It will provide direction
    towards the growth and development of the city for the       To promote safe and secure walking environments,
    next 20 years (2014-2034) (MCGM 2013). The Municipal         cities are drafting building bye laws that ensure
    Corporation of Greater Mumbai (MCGM) has adopted a           porous or no compound walls, active street fronts
    two-tiered planning process for Mumbai. The first tier       with ground retail spaces and adequate walking and
    looks at city level planning strategies and Land Use and     cycling infrastructure (UTTIPEC 2012), (ITDP 2013).
    Development Control Regulations (DCR). The second            However, as TOD areas develop they give rise to an
    tier of planning looks at the neighbourhood scale by         increase in property values, invariably replacing existing
    creating a process for Local Area Plans (LAP).               communities. Hence one of the biggest challenges
                                                                 faced by planners today is to orient existing and
    At the city level, Mumbai is adopting a comprehensive        proposed developments towards transit—thereby,
    Transit Oriented Development (TOD) strategy (MCGM            impacting better physical environments, improving
    2013). “Transit Oriented Development (TOD) refers            connectivity to transit using feeder networks, and
    to residential and Commercial Centers designed               reducing congestion around station areas—while
    to maximize access by transit and non-motorized              ensuring TOD areas are affordable to transit users.
    transportation, with other features to encourage
    transit ridership. A typical TOD has a rail or bus station   A comprehensive TOD strategy includes various
    at its center, surrounded by relatively high-density         elements,to—build compact developments around
    development, with progressively lower-density                stations, promote transit supportive land uses, build
    spreading outwards one-quarter to one-half mile,             complete streets, build more public spaces, treat
    which represents pedestrian scale distances” (VTPI           cultural landscapes sensitively, build integrated
    2014). However, the TOD discourse in India is focused        transport systems, and promote Travel Demand
    on the intensification of density around station areas,      Management (TDM) in TOD areas (EMBARQ India 2013).
    without addressing the need for better access to transit     Several cities across the world are introducing stringent
    and amenities                                                parking management regulations (to impact TDM), with
                                                                 intelligent pricing

6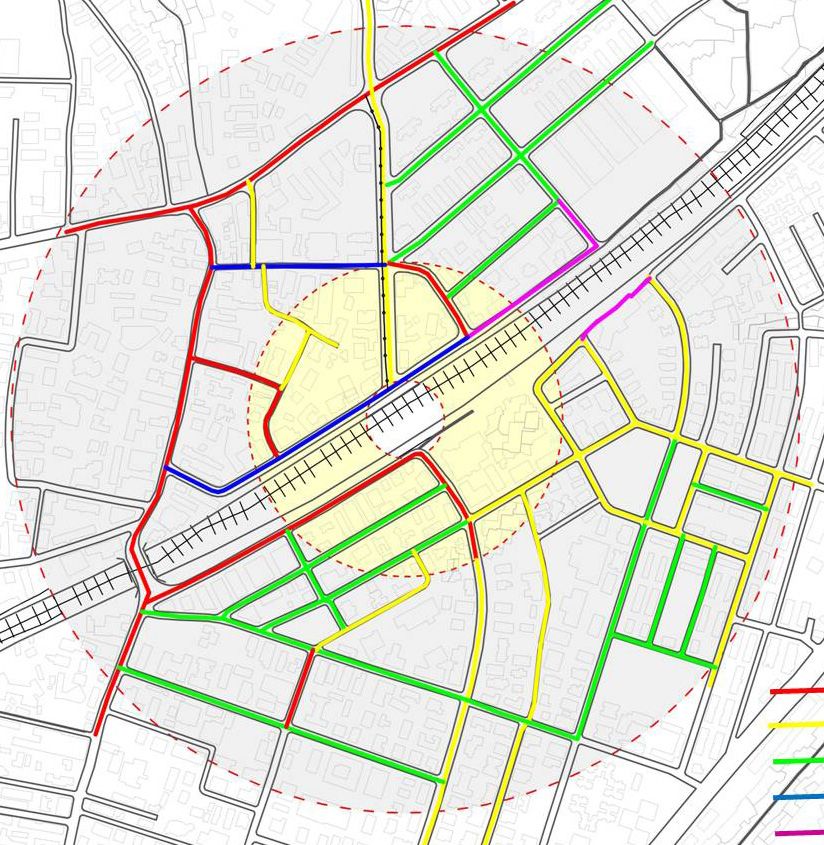
Literature Review Of Transit Oriented
Relevant By-Laws And Development Goals
Background Reports Empirical Surveys Of Ghatkopar
Working Parking Supply And Station Area Urban Design And Land
Assessment Of Best Sessions Occupancy In TOD Areas Analysis Use Objectives
Practices With Working
Dr. Paul Review Of Existing Sessions Innovative Startegies
Review Of Existing Barter Parking Norms (Walkable Park-Once
Parking Data And Neighbourhood, Shared
Surveys Parking, Unbundling Of
Parking)
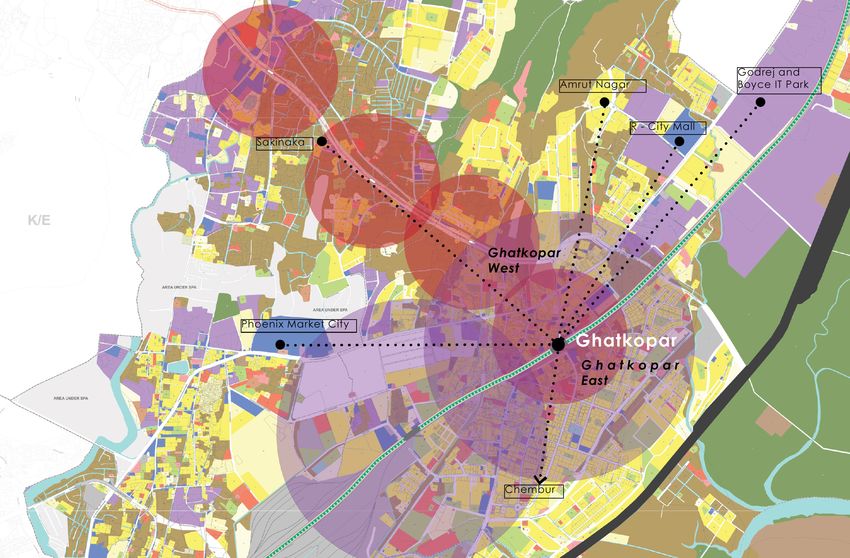
Figure 1: Framework for the TOD study report at Ghatkopar Station; Source: EMBARQ India
models within TOD areas to arrest reliance on car MCGM officials and the Consultants producing the
use and ownership (Barter 2013). Additionally, Cities Mumbai Development Plan 2014-34. The study aims
are also using reduced parking norms as a means to at positively influencing the Development Plan,
impact affordability within TOD areas (Barter 2013). An Mumbai, pushing for a drastic reduction in off-street
oversupply of parking not only increases congestion parking norms close to transit nodes. Regulatory
around station areas, thereby inhibiting pedestrian and tools developed in the report are based on a detailed
feeder system integration with MRT stations, but also, data collection and analysis process, with continuous
creates an inaccessible housing market in the city. This is engagement with parking expert, Dr. Paul Barter.
because; lower parking supply within TOD areas, in turn Regulatory tools are also tested by key stakeholders
increases housing supply, thereby decreasing property such as City officials, Developers, and architects through
values. the process. Finally, the regulatory tools are envisioned
as “living” regulations that will evolve as required, to
In Mumbai, public transit ridership is extremely high meet the challenges of diverse city contexts, changing
(up to 52 percent train users and 26 percent bus conditions, and evolving urban aspirations.
users), while car users are negligible (up to 6 percent),
considering all motorized trips. Car ownership in A framework for the study is developed as illustrated
Mumbai is fairly low (32 cars per 1000 persons) as in Figure 1. Inferences from the study can be scaled-
compared to other Asian cities with similar densities up across all suburban railway stations and upcoming
(LEA Associates 2008); however, parking provision MRT stations across the Mono and Metro Rail. The aim
is extremely high (2.17 parking spaces per 100 cars) of the study is to achieve a desired urban form, which
(MCGM n.d.). At the same time, data reveals that is compact yet porous with active street edges and
51 percent of all work-trips in Mumbai (including decongested station areas, using parking as a tool.
non-motorized modes) are conducted on foot (LEA Based on this framework the report is structured into
Associates 2008). Assessing existing parking norms to seven sections, summarized as follows:
restrict over provision of off-street parking spaces, is
one of the pressing planning issues in the city today.
EMBARQ India is undertaking an independent study at
the Ghatkopar Railway station area, as a pilot study to
re-think existing parking norms and develop options
for parking reduction within TOD areas in Mumbai.
The study has evolved over-time with continuous
engagement with
Rethinking Off Street Parking Regulations Around Station Areas In Mumbai 7
I. INTRODUCTION                                             facilitated by EMBARQ India and Dr. Paul Barter, an
    The introduction gives a detailed understanding of          expert in parking policy around the world; as well as
    what a Transit Oriented Development is, and why it is       relevant case examples and best practices nationally
    relevant in the Indian Context. The TOD discourse in        and internationally.
    India is in its formative stages, where several paradigms
    are directly adopted from Western cities. Mumbai,           V. PROPOSED PARKING REGULATIONS
    among other cities has adopted a TOD strategy in its        There are three parking policy options developed
    statutory Master Plan review, scheduled to come into        through this section. These are based on data
    effect by end of year 2014. Using Ghatkopar station as      collection, analyses at Ghatkopar station, and reduced
    a pilot demonstration study area, the report therefore,     parking norms explored in other cities. Inputs from Dr.
    presents analyses and evidence of how the TOD               Paul Barter, MCGM’s DP team, as well as stakeholder
    discourse can be shaped for the city of Mumbai.             workshops are integrated to further refine these
                                                                options. The three options are based on three different
    II. EXISTING SITUATION ANALYSIS                             parking approaches that are explored keeping in mind
    An Existing Situations Analysis is executed at the          the city context and growth patterns.
    Ghatkopar Railway and Metro station area. Ghatkopar
    station will serve as the end terminal for the Metro        VI. TESTING THE PARKING REGULATIONS
    line 1. This section presents the data collection           This section informs the decisive market response
    methodology and analysis, forecasting what may be           on the new approach to parking regulations. Inputs
    the impact at the neighbourhood level once Ghatkopar        from personal phone interviews with developers
    station becomes a major transit interchange hub. The        and architects, as well as a round-table workshop
    study is using Parking as a tool to change prevalent        are integrated in this section. Further, inputs from
    TOD trends by shifting the discourse around TOD in          engagements with city officials either as training
    India from a means of intensification of density, to        sessions, or working modules are also included
    providing—both physical and socio-economic—access.          here. The section also elaborates key discussion
                                                                points, suggestions and recommendations from the
    III. REVIEW OF EXISTING                                     developers’ workshop (including a web link to an
    PARKING DCRs                                                abridged video of the workshop proceedings).
    Existing parking norms in Mumbai are extremely high
    as compared to other Asian cities with comparable           VII. CONCLUSIONS
    people densities, and much higher car density ratios.       This section is a summary of the Ghatkopar Study
    This section presents a critical review of the existing     report, highlighting key learnings. After a yearlong
    parking norms, (DP 1991 and modifications till 2008),       engagement with the site, MCGM officials and the
    which currently follow a “conventional approach” of         consultants, there are frequent concerns and questions
    overprovision based on projected demand. The parking        that are registered. This section also provides a list of
    policy in Mumbai is a blanket policy that mandates          concerns and questions with explanations from the
    extremely high ‘minimum parking norms’ across               report, Dr. Paul Barter’s inputs, and from stakeholder
    the city. This is primarily done to reduce on-street        inputs.
    congestion due to parking; however, in effect it is
    encouraging car dependency and discouraging the use         The Ghatkopar Station area study and report intends
    of alternate, sustainable modes of transit.                 to inform and engage with various authorities, local
                                                                governments, developers, and citizens in a critical
    IV. APPROACH TO PARKING POLICY                              dialogue around the feasibility of parking norms close
    To develop a sustainable and realistic parking policy, it   to transit. It seeks to inform a broader rationalization
    is important to realize the “right” approach to parking     of parking solutions at the city level, that enhance the
    provision. This section elaborates key learnings from       attractiveness and quality of life around station areas,
    several capacity building sessions                          making them convenient for commuters, residents, and
                                                                business owners.

8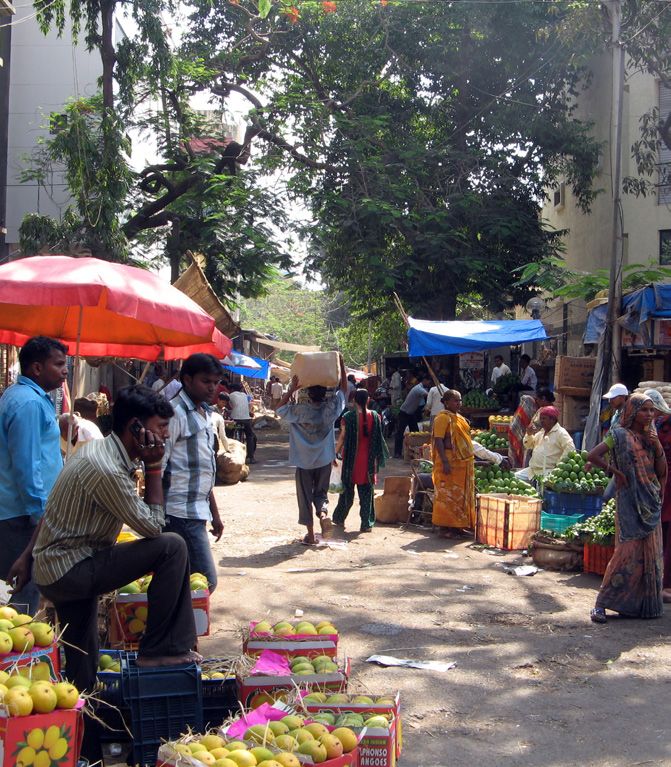
LIST OF FIGURES

Figure 1: Framework for the TOD study report at                  commuters conducting work-trips at Ghatkopar Station;
Ghatkopar Station; Source: EMBARQ India                          Source: EMBARQ India

Figure 2: Difference between the TOD strategy and the            Figure 13: Origin (a)-Destination (b) maps showing
resultant urban form in the Ahmedabad Master Plan                regional connectivity to and from Ghatkopar Station;
(left) and the Delhi Master Plan (right); Source: (AUDA          Source: EMBARQ India
2006-2012) (DDA n.d.)
                                                                 Figure 14: Mode shares at Ghatkopar east and west
Figure 3: Diagram representing the vicious automobile            respectively; Source: EMBARQ India
oriented planning circle; Source: EMBARQ India,
adapted from VTPI (Litman 2013).                                 Figure 15: (left) Map representing a ped-shed analysis
                                                                 of Ghatkopar Station area; Source: EMBARQ India;
Figure 4: Transit Map of Mumbai showing existing and             (right) Map representing the ease and safety of walking
proposed MRT systems; source: EMBARQ India                       within the TOD influence area. Ease measured from low
                                                                 to high, and safety measured as vibrant or alleyway;
Figure 5: Comparative table showing population                   Source: EMBARQ India
densities, car ownership (per 1000 people) and
corresponding parking supply (Equivalent Car Spaces              Figure 16: (top left) Existing Land Use Map; Source:
per 100 sq.m of built-up area); Source: Barter 2011, LEA         MCGM website; (top right) Graph showing land use
Associates 2008.                                                 distribution in the 4 study blocks across the TOD area;
                                                                 Source: EMBARQ India
Figure 6: Ghatkopar Station Terminal with Suburban and
Metro Rail showing Intermodal connectivity; Source:              Figure 17: (left) Map showing existing building heights
EMBARQ India.                                                    of the study area; (top right) Graph showing building
                                                                 height distribution across four blocks; Source: EMBARQ
Figure 7: Images showing Ghatkopar’s neighbourhood               India
character (from left)—urban village street (in the west),
neighbourhood market junction (in the east), 90 ft. road         Figure 18: Table showing the bulk FSI consumption
section (east); Source: EMBARQ India                             ratio as well as a comparison of FSI trends by regulation,
                                                                 land use and for redevelopments; Source: EMBARQ
Figure 8: Data collection process chart                          India

Figure 9: Diagram showing zone delineation at three              Figure 19: Map showing FSI consumption in the study
levels of data collection and analysis; Source: EMBARQ           area; (top right) Graph of average FSI consumption
India                                                            across the 4 blocks; Source: EMBARQ India

Figure 10: Image of Ghatkopar Station, Mumbai; Source:           Figure 20: (left) Map showing buildings with and
EMBARQ India                                                     without parking; (top right) Table showing number
                                                                 of parking spaces per 100 sq.m across the four blocks
Figure 11: Graph showing the passenger counts at                 by land use and distance to transit station; Source:
Ghatkopar station; Source: EMBARQ India                          EMBARQ India

Figure 12: Graph showing occupation profiles of                  Figure 21: Survey locations at three levels within the
                                                                 TOD zone; Source: EMBARQ India

                                                          Rethinking Off Street Parking Regulations Around Station Areas In Mumbai   9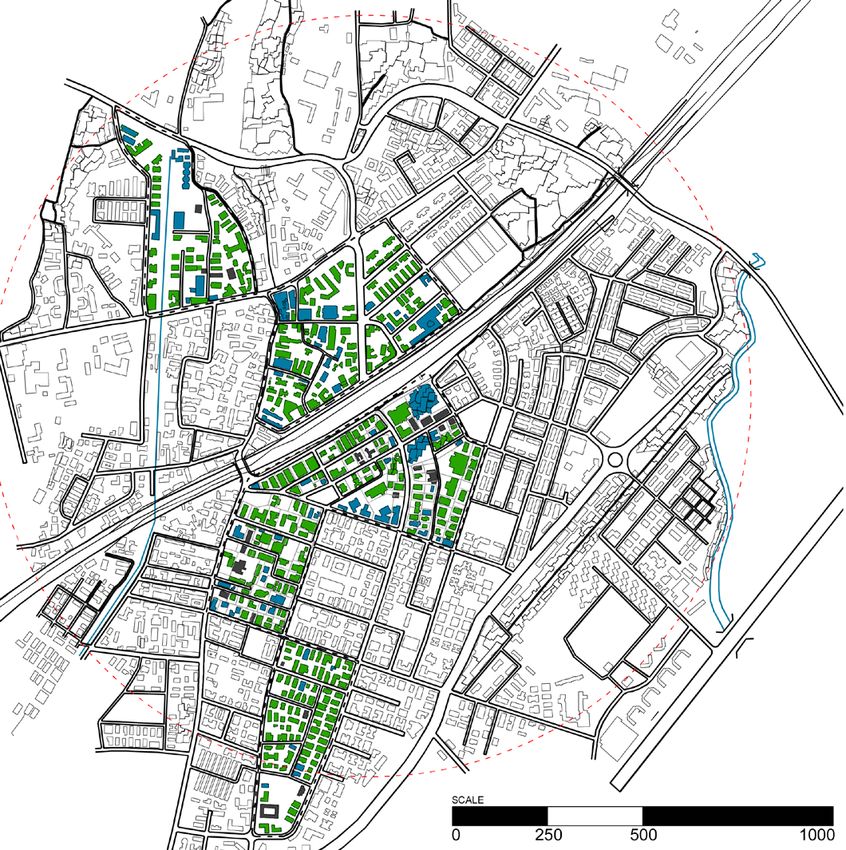
Figure 22: (left) Average traffic volumes and modal splits   ratio for different street types in Block 2; Source:
     at the two junctions; (right) Average traffic volumes        EMBARQ India
     across all internal streets at mid-block; Source: EMBARQ
     India                                                        Figure 35: Graph of parking supply in residential
                                                                  buildings to FSI consumed in residential buildings;
     Figure 23: Modal split across all four blocks in the TOD     Source: EMBARQ India
     zone; Source: EMBARQ India
                                                                  Figure 36: Mode priority within Transit Oriented
     Figure 24: (left) Map showing land use distribution in       Development precincts; Source: EMBARQ India
     Block 2; (right) Graph showing the land use distribution
     in Block 2; Source: EMBARQ India                             Figure 37: Development near Curry Road Station with
                                                                  10 floors of parking; Source: EMBARQ India
     Figure 25: (left) Map showing the building height
     distributions in Block 2; (top) Graph of building height     Figure 38: Delineation of parking zones based on
     distribution in Block 2; Source: EMBARQ India                distance from transit node; Source: EMBARQ India

     Figure 26: (top left) Graph and Map (right) showing          Figure 39: Table showing proposed parking regulation
     existing FSI consumption in Block 2; Source: EMBARQ          Option 1; Source: EMBARQ India
     India
                                                                  Figure 40: Representation of the Ghatkopar station area
     Figure 27: (left) Graph showing household income             after redevelopment based on current parking norms;
     within Block 2; (right) Graph showing the proportion of      Source: EMBARQ India
     household unit sizes; Source: EMBARQ India
                                                                  Figure 41: Representation of the Ghatkopar station area
     Figure 28: Vehicle ownership chart showing 50% car           after redevelopment with parking reforms applied;
     ownership; Source: EMBARQ India                              Source: EMBARQ India

     Figure 29: Paid on-street parking facilities in Block        Figure 42: Table showing proposed parking regulations
     2                                                            Option 2; Source: EMBARQ India

     Figure 30: Parking inventory for block 2; Source:            Figure 43: Table showing proposed regulations for
     EMBARQ India                                                 Option 3; Source: EMBARQ India

     Figure 31: Map (left) and graph (top right) showing          Figure 44: Existing building at Ghatkopar station.
     parking supply, and (bottom right) graph showing             Ground plot area and building set back spaces used for
     parking supply by distance from transit in Block 2;          on-plot parking; Source: EMBARQ India
     Source: EMBARQ India
                                                                  Figure 45: (left) Buidling after redevelopment based
     Figure 32: (left) Map showing parking occupancy              on current parking norms and (right) building after
     percentages in Block 2 and (top right) graph showing         redevelopment based on new norms incorporating
     parking occupancy percentages for block 2; Source:           shared parking across uses; Source: EMBARQ
     EMBARQ India                                                 India

     Figure 33: Modal splits at mid-block locations in Block 2;
     Source: EMBARQ India

     Figure 34: Map representing the Flow-Capacity

10
INTRODUCTION
EMPHASIZING
PARKING
MANAGEMENT
WITHIN THE TOD
DISCOURSE IN INDIA
The TOD discourse in India is in its formative stages, presenting opportunity for
cities to rethink and formulate context specific TOD policies addressing key challenges
in the Indian context.
WHAT IS TOD? facilitate more walk and non-motorized transit trips.
“Transit Oriented Development (TOD) refers to Cultural landscapes, including heritage structures, old
residential and Commercial Centers designed to markets, structures of religious or cultural significance,
maximize access by transit and non-motorized can be retained and assimilated in TOD planning and
transportation, and with other features to encourage design processes. The integration of multiple modes
transit ridership. A typical TOD has a rail or bus station of transit across Metro rails, suburban rails, light rails,
at its center, surrounded by relatively high-density feeder bus services, intermediate para-transit services
development, with progressively lower-density and NMT parking can be prioritized. Lastly, emphasizing
spreading outwards one-quarter to one-half mile, on a travel demand management approach that
which represents pedestrian scale distances” (VTPI introduces reduced parking norms within TOD areas,
2014). EMBARQ India has evolved a TOD framework for while developing other smaller measures to shift travel
Indian Cities based on the following elements: compact patterns towards sustainable modes.
development, transit supportive land uses, complete
streets, public spaces, cultural landscapes, integrated A TOD strategy within a Master Plan can be applied in
transport, and Travel Demand Management (TDM). one of three ways:
(EMBARQ India 2013).
1. Overlay Zone
Here, compact development refers to housing types In city master plans, overlay zones are delineated
that are minimal, with medium to high built densities, around MRT station catchment areas. An overlay zone
with sufficient open spaces that are shared across is a zoning tool that requires specific development
developments. Mixed land uses catering to a high and design regulations within the delineated area. The
commuter crowd would constitute as transit supportive overlay zone is used to either protect the existing assets
land uses. Complete streets with safe and secure and character of the area or to envision an enhanced
pedestrian infrastructure to urban character within
Rethinking Off Street Parking Regulations Around Station Areas In Mumbai 11Figure 2: Difference between the TOD strategy and the resultant urban form in the Ahmedabad Master Plan (left) and
the Delhi Master Plan (right); Source: (AUDA 2006-2012) (DDA n.d.)
the delineated zone. The Ahmedabad Master Plan is a
therefore its reach at regional, city, or ward level. For
good example of this (AUDA 2006-2012).
example, TODs along BRT Systems are often planned
2. Special Land Uses as corridors like in the Ahmedabad Master Plan; while,
City master plans can create a provision for a special for a Metro system network, TODs are radial in nature,
land-use category, applied within the MRTS influence as the distance between stations is quite far apart, like
zone. Special urban design codes are applicable in the Delhi Master Plan. The extent of a TOD zone may
within the TOD influence zone under the special land also vary based on peoples’ willingness to walk-to-
use category. These may include reduced block sizes, transit in different cities. All these factors combine, and
building typologies, building interfaces, permissible help define a clear methodology for TOD strategies for
and non-permissible uses and so on. This was done in different cities.
the Delhi Master
Plan (DDA n.d.).
TODs IN INDIA
3. Local Area Plans Ahmedabad and Delhi master plans in Figure 2 show
A detailed second-tier planning process is mandated two different methods of realizing TODs in the city. The
within City Master Plans to create Local Area Plans (LAP) Ahmedabad plan delineates a zone of 200m from the
at neighbourhood level. Cities are delineating special BRTS corridor on either side along the entire stretch of
topics or planning strategies to be prioritized in the LAP the system. This is an overlay zone, thereby mandating
process, TOD is one of them. Cities like Delhi are already special regulations and norms applicable within the
in the process of plan preparation, and Mumbai will extents of zone. In the Delhi Master Plan, TOD zones are
follow soon after the DP review process is completed. defined for 500m from each transit node. This presents a
radial plan, with overlaps between adjacent TOD zones.
TODs are planned within a delineated transit “Influence A special land use is applied within the zone,
Zone”, of a MRT system. The ‘influence zone’ is defined called a ‘white land use’ that mandates special
based on distance to the transit station by walk or standards and density allowances within the zone.
non-motorized transit (NMT) modes. The extent of the
zone is defined using a planning tool called ‘ped-shed While both Master Plans, especially the Delhi TOD
analysis’, which correlates the distance walked/ cycled strategy, prescribe detailed norms, allowances and
to transit from a destination, with the time taken to urban form guidelines that adhere to TOD principles,
reach it. Hence the extent of the influence defines a the question of affordability seems unanswered. The
TOD catchment area. These may vary based on the kind Delhi Master Plan defines a TOD as, “essentially any
of mode, the structure of the network, and development, macro or
12micro that is focused around a transit node, and Hall-Kitchen (BHK) flats) by car owning families
facilitates complete ease of access to the transit would reduce within TOD areas. This in turn creates
facility, thereby inducing people to prefer to walk and an opportunity for different typologies of affordable
use public transportation over personal modes of housing, like studio apartments, 1 and 2 BHK flats, as
transport”. However, the discourse around TODs in India well as rental housing, giving rise to compact, high
is more of an urban design and densification approach, density housing close to transit. Moreover, parking
which is necessary, but yet an incomplete conversation reforms can also enable retaining existing communities
for the Indian context. with low car ownership in TOD areas, by facilitating
access to affordable housing.
Most Indian cities are already very dense; people tend
to live as close to transit as far as possible. Most cities TOD AND TAD :
show a large percentage of users of public transit SIMILAR CONCEPTS, VERY
especially within the low income to economically weak DIFFERENT CITIES
sections. When a TOD strategy is primarily focused on Most Indian cites translate TOD as a means of
densification along the corridor, increase in building intensifying densities (and therefore increasing FSI, or
height due to extra FSI causes a corresponding increase Floor Space Index) along the transit corridor or within
in property value. This in turn attracts high to middle the TOD influence zone. This may result in what is
income home owners, and high-end retail and office commonly known as ‘Transit Adjacent Development’
enterprises, who are most likely car owners. Hence a (TAD). TAD signifies development that is in close
TOD strategy must be coupled with a stringent parking proximity to transit stations but promotes auto-oriented
policy to arrest the use of private vehicles either for planning such as sparse people densities, luxurious
work or non-work trips. A stringent parking policy also living environments, single or segregated land uses,
ensures a decrease in property values as the supply of and ample provision of parking (Newton 2010). Hence,
housing increases. a TAD is similar to TOD as both paradigms prioritize and
propagate development close to transit; however TAD
The Ahmedabad Master plan continues to mandate as an approach is just limited to that, often promoting
“parking minimums” (concept explained in Section III: auto-oriented planning concepts (refer Figure 3).
Review of Existing DCRs) and looks at a meagre 10%
reduction in parking for commercial uses along the TOD Adjacency to transit does not ensure a livable, walkable
corridor (AUDA 2006-2012). Additionally, a special tax and healthy neighborhood with increased quality of life;
called “betterment charge” is levied upon all property it merely ensures proximity to transit by capitalizing on
owners living within the BRTS influence zone of 200m high land values. This form of planning is not people-
(TOI 2013). These surcharges that may seem as positive oriented, but rather “auto”-oriented (i.e. planning that
externalities of development for the City, adversely facilitates car use). For example, current parking norms
affect the economically weaker sections, most often in Mumbai promote higher parking allowances with FSI
forcing them to move away from the corridor. The Delhi incentives for public parking lots within the first 500m
Master Plan mandates a detailed parking policy for TOD of a transit node (MCGM 1995). This approach results in
zones, however it considers parking minimums and an increase in vehicular traffic around station areas that
not parking maximums (refer Section III for definitions) are already heavily congested.
(DDA n.d.).
The Mumbai DP addresses inclusivity as an important
planning concept for the city (MCGM 2013). Using
parking reforms as a tool, MCGM can impact an
increase in housing supply thereby seeing a reduction
in property values. Due to reduced parking norms,
the demand for high-end residential apartments
(essentially, 3 or 4 Bedroom-
Rethinking Off Street Parking Regulations Around Station Areas In Mumbai 13Increased Vehicle Ownership
Decreased Dependency Automobile Oriented
on Public Transport Transport Planning
Poor Quality of Automobile Oriented Generous Parking
Public Transport Planning Supply
Alternative Modes Marginalised Automobile Oriented (or Segregated)
(Public Transport/Walking/NMT) Land Use Planning
Figure 3: Diagram representing the vicious automobile oriented planning circle; Source: EMBARQ India, adapted from
VTPI (Litman 2013).
A TOD STRATEGY FOR
MUMBAI: OPPORTUNITIES
AND CHALLENGES
The Mumbai Master Plan is in the review process,
for the next 20 years (2014-2034). It is scheduled to
come into effect by the end of 2014 where MCGM is
the implementing agency. External consultants are
hired to enable the process of plan preparation under
the directives of MCGM’s DP department. To enable a
“second-tier” planning process, the city is divided into
smaller ‘planning sectors’. These sectors cover an area
of 2-4 sq. kms. They are envisioned as self-sufficient
sectors that meet the need for amenities, housing and
employment for the given population. Sector level
plans will be prepared for some of the planning sectors
to demonstrate the process of planning, where TOD is
adopted as one of the major planning strategies (MCGM
2013).
Mumbai city is one of the most transit rich cities in
India. In the Metropolitan Region, a population of 10
million people makes 28.5 million one-way trips every
day, as stated in the 2008 CTS report (LEA Associates
2008). 53% of these trips are made on foot, and out
of the remaining 47% motorized trips, 78% are made
on public transit. This goes to show that Mumbai is
extremely transit dependent. Mumbai’s suburban Figure 4: Transit Map of Mumbai showing
railway system is one of the oldest in Asia. Historically, existing and proposed MRT systems; source: EMBARQ
the city developed along the railway line, with compact India
neighbourhoods
14CITY POPULATION DENSITY CAR DENSITY PARKING SUPPLY
1. Honk Kong 7.1 million 55 0.24
2. Singapore 4.6 million 112 1.30
3. Seoul 19.9 million 227 1.44
4. Beijing 14 million 103 0.52
5. Guangzhou 13.2 million 84 0.74
6. Ahmedabad 5.4 million 55 0.24
7. Mumbai 12 million 48 2.17
Figure 5: Comparative table showing population densities, car ownership (per 1000 people) and corresponding
parking supply (Equivalent Car Spaces per 100 sq.m of built-up area); Source: Barter 2011, LEA Associates 2008.
OPPORTUNITIES CHALLENGES
Mumbai DP is including a TOD strategy in their Master The TOD strategy in the public domain, has a strong
Plan review for 2014-34 density focus, not access (MCGM 2013)
Mumbai shows high reliance on public transit and Transit users are mostly captive users as the transit
walking experience is challenging and unsafe
Mumbai is looking at a two-tiered planning process, Stakeholders at the local level include developers,
thereby ensuring neighbourhood context can be business owners as well as residents; getting all key
integrated into the planning process stakeholders on a common ground is a key planning
challenge at the local level
Mumbai is positively influenced, towards reducing Market trends and acceptance of reduced parking norms
parking norms within station areas (Barter 2013). will further drive the political debate around parking in
Mumbai.
and villages that came up along the railways as it active streets and high land values that induce
extended to the eastern and western suburbs. The high densities when redeveloped. High footfalls of
2008 CTS report records a ridership of 7.24 million commuters, businesses and residents within TOD
commuters daily. influence zones lead to congested station areas with
low service provision.
Suburban railway commuters in Mumbai battle huge
footfalls of people during the morning and evening Like most Indian cities, Mumbai has witnessed rapid
peak periods. Additionally, due to poor ‘last mile motorization over the last decade and more. The
connectivity’ to their final destinations, everyday travel Comprehensive Transportation Study (CTS)
is often conducted in grueling and unsafe conditions. conducted by the Mumbai Metropolitan Regional
Intermodal connectivity at railway stations in Mumbai Development Authority (MMRDA) records an increase of
is a big challenge; drop-off or pick-up points from rail private vehicle ownership over a period between 1996
to intermediate public transit (IPT) like auto-rickshaws to 2005 for cars and two-wheelers per 1000 persons,
and taxis, and feeder bus services, is poorly planned. as 52 to 82 and 50 to 97, respectively (LEA Associates
Moreover, station areas are a characteristic of vibrant 2008). However, when compared to other Asian cities
markets, (like Honk Kong,
Rethinking Off Street Parking Regulations Around Station Areas In Mumbai 15Singapore and Delhi) with similar densities, Mumbai The MMRDA has proposed two new modes of mass
shows very low car ownership ratios but very high transit—the Mono and the Metro Rail (refer Figure 4).
off-street parking norms (as in Figure 5). Most middle This will further add to the city’s public transit mode
and high income housing comes with parking spaces share. While new modes are proposed in the city,
based on unit sizes (2, 3 or 4 Bedroom etc.). High regulations to direct development around MRT stations
parking norms, are drastically transforming pedestrian are not addressed significantly. Development within
oriented neighborhoods in the city, into unsafe walking these TOD zones along new MRT systems, may address
environments with inactive built edges dominated by the need for adequate open spaces, housing, and
vehicles and parking. amenity provisions, with mixed uses that promote more
walking trips. Integrating these objectives into the DP
In Mumbai, parking norms over the last decade bundled vision document, may enable planning and building a
with housing sales influenced an increase in car city that is more transit and people-oriented.
ownership, thereby increasing parking demand (Barter
2013). For each new car, there are typically two parking Using Ghatkopar Station as a case study, EMBARQ
spots required—at origin (residential) and destination India is conducting an independent study to influence
(office/ mall/ theater); invariably, increasing parking the Mumbai DP 2014-34. The study makes a case
provisions for all associated uses, to cater to an increase for rethinking existing off-street parking norms
in demand. For a city like Mumbai, where about 50% of within the first 500 meters of station areas, to reduce
its population lives in informal housing with very low vehicular congestion, improve safe and secure access,
infrastructure provision, using spaces for cars is simply and influence affordable and compact housing
irresponsible (Rangwala, Mathews et. al. 2014). developments.
TRANSPORT MODE CLASSIFICATIONS
Suburban Railway
Metro Line
Eastern Express Highway
500m Accessibility Radius
2Km Accessibility Radius
Figure 6: Ghatkopar Station Terminal with Suburban and Metro Rail showing Intermodal connectivity; Source:
EMBARQ India.
16GHATKOPAR STATION AREA There are two major arterial roads, the Lal Bahadur
CHARACTERISTICS Shashtri Marg (LBS Road) on the west and the 90 feet
Ghatkopar station is located along the central suburban Road on the east. They serve as both arterial roads and
railway line connecting South Mumbai to the Eastern collectors, carrying up to 50% of the through traffic
suburbs. It is an important transit point on the central crossing Ghatkopar. This includes a large proportion of
railway line as all trains stop at Ghatkopar, including heavy motor vehicles (HMVs).
some outstation trains. Additionally, Ghatkopar is
planned as the end terminal for the Mumbai Metro Line West Ghatkopar is very different from its eastern
1, as in Figure 6, making it a multi-modal interchange counterpart, which is well planned with a clear
terminal. People traveling on the north-south corridor hierarchy of road networks and accessible walking
by the suburban railway, can transfer to the east-west environments. The major neighborhoods in the area
corridor to use the Metro. Over the next decade the are Pantnagar on the east and Nityanand Nagar on the
Metro is expected to carry 30,550 people per hour west. Jhunjhunwala College and Sarvodaya hospital
(DMRCL 2012). are two large institutions within the study area, located
on the west side of the station. Although, Ghatkopar
EMBARQ India conducted a preliminary survey to east has no prominent city level institutions, it is well
understand travel behavior and mode shares within a provided with neighborhood and ward level schools,
1km radius around Ghatkopar station. Most commuters monuments of social and religious importance, open
use either non-motorized (NMT) modes (walking or public spaces and parks and community centers.
cycling) or feeder services such as BEST buses, autos
or taxis to access the station area. Only 3% of the Since Ghatkopar east provides a well-planned and
commuters use private modes like cars or two-wheelers legible street network pedestrians find it safer and
to access the station area (refer Figure 14 for more more accessible than the west, which is a traditionally
details). These figures are representative of most station hilly terrain with urban village clusters, organic street
areas in Mumbai. networks. However, these village streets serve as NMT
connectors to the station area and therefore see a
Ghatkopar station is used for work and non-work trips large commuter footfall of working class professionals
by people living, or working within a 3-6km radius walking to the station. Informal surveys conducted
around the station. There are five bus stops and four by EMBARQ staff in the villages reveal that most
auto-rickshaw stands within a 250m radius around the households walk to the station to board trains to their
station, on both east and west side. final place of work.
Figure 7: Images showing Ghatkopar’s neighbourhood character (from left)—urban village street (in the west),
neighbourhood market junction (in the east), 90 ft. road section (east); Source: EMBARQ India
Rethinking Off Street Parking Regulations Around Station Areas In Mumbai 17Hence living in close proximity to an MRT system
significantly reduces their travel costs.
The overall TOD area has a diverse range of affordable
housing types; these include old MHADA colonies,
police quarters, old four-storied walk-up apartment
buildings, urban villages and newer slum clusters. New
developments that are coming up within the first 500
meters of the station bring a new urban form of higher
built-up densities, large plot sizes with significant
on-plot parking provisions. These fail to retain some
of the traditional NMT streets that are used to access
the station area, making walking distances long and
cumbersome. Hence, a change in urban form due to
redevelopment is a significant concern for the precinct
at least within the first 500 meters.
Due to redevelopment, even though car dependency
that is, car ownership and ridership in the study area
are low, parking provision is significantly high. The
existing situation analysis for the Ghatkopar station area
further substantiates this hypothesis. Additionally, the
report presents commuter patterns, people densities,
and corresponding land use, built-form and parking
provisions compared to basic TOD principles for
the area.
18EXISTING SITUATION ANALYSIS
A STUDY OF THE
IMMEDIATE
GHATKOPAR STATION
AREA CONTEXT
Ghatkopar station is a multi-modal transit hub, with high density, low-rise built
forms, and a predominantly residential land use with significant buildings with mixed
land uses. The station is used for work and non-work trips by people living, or working
within a 3-6km radius around the station.
Ghatkopar station is projected as one of the major There are three zones identified within the study area of
transit hubs in Mumbai after the completion of Metro 1km as shown in Figure 9. Four blocks are delineated for
line 1. Parking is used as a tool to inform a sustainable the neighbourhood level study, of which all blocks are
planning framework around transit station of this either directly or indirectly accessed by the Mahatma
capacity in the city of Mumbai. The existing situation Gandhi Road, which is the main east-west connector, for
analysis (ESA) at Ghatkopar station investigates existing vehicular modes. MG Road is primarily commercial in
conditions (and attributes) of the built environment, nature, with several old retail markets along the street
in cognizance with travel behavior and resident/ edge.
employee and commuter profiles. Given the current
DCRs with regards to redevelopment and on-plot Two of four blocks are delineated within the first 500
parking provision, introducing parking reforms to m from the transit node. Once the Metro Line 1 is fully
inform a sustainable development of transit areas is an functional, these areas will witness a massive increase
implicit way forward. The Ghatkopar station area study in commuter footfall and subsequent developmental
serves as a case example to explore different options of pressures. The remaining two blocks are delineated in
parking reforms within TOD zones, which can be further the next 500 m (i.e. within the 500-1000 m of the transit
applied at city level. node). Urban characteristics in the east and west are
very different, as explained in the level 2 analysis.
METHODOLOGY Data collection was performed at each plot in the four
The study is conducted at three different levels based blocks for one weekday and one weekend day during
on the kind of data required. There are two main parts the day time (non-peak hour) and night time (peak
to the ESA—data collection and data analysis—that hour). The weekday data was collected at 3:30 p.m.
help extrapolate existing patterns. Figure 8 shows the and 7:30 p.m.to capture non-peak and peak parking
structure of the data collection process and the types of occupancy counts. While, weekend data was collected
data collected. To initiate the study the TOD “influence at 12:30 p.m. and 8:30 p.m. to capture weekend non-
zone” is delineated. peak and peak hour
Rethinking Off Street Parking Regulations Around Station Areas In Mumbai 19DATA COLLECTION PROCESS
Level 1: Analysis for Regional Level 2: Analysis for Level 3: Detailed Parking
Connectivity Physical Characteristics at Analysis
Neighbourhood Level
Mapping regional Four blocks (two on the To develop a case for off-street
connectivity, dependence on east and two on the west) parking strategies within
transit, and traffic movements were demarcated within transit rich precincts such
and counts across the TOD the 1km TOD influence as Ghatkopar Station area, a
influence zone of 1km zone. The four blocks are series of detailed surveys were
representative samples of conducted for one of the four
various neighbourhood blocks. The block on the east
Surveys conducted: characteristics, income side of the station in the 500m
• Commuter counts at station patterns and site conditions immediate zone (block 2) was
entry/exit locations; within the overall influence selected for detailed data
• Origin-Destination surveys zone. collection and case analyses.
at railway platforms to map
regional connectivity; Surveys conducted:
• Origin-destination surveys • Walkability analysis
outside the station within the • Existing Land use Surveys conducted:
1 km, TOD influence zone, to • Building Heights • Household Survey
map ward level connectivity • Floor Space Index Analysis • Parking Occupancy
to station area. • Off-street Parking counts
Figure 8: Data collection process chart
TOD INFLUENCE ZONE
TODs are planned within a delineated transit “Influence Zone”, of a MRT system. The ‘influence zone’ is defined
based on distance to the transit station by walk or non-motorized transit (NMT) modes. Based on modes used
to access a MRT station, the influence zone may vary. Since most public transit trips start and end as walk-trips,
walking is used as a means to define the influence zone. In Mumbai, people are willing to walk up to 0.91km
(Rastogi 2011); therefore, the TOD influence zone is delineated as 1km around the station. For the purpose of
the study the influence zone is further divided into three sub-zones; the Gateway zone—from 0 to 250m—
the Intermediate zone—from 250 to 500m—and the Outer zone—from 500 to 1000m. A ‘ped-shed analyses’
(explained further in the report) is used to delineate the influence zone based on distance and time.
20occupancy patterns. To map patterns of off-street
parking within the station area, a parking inventory
and parking occupancy survey was carried out. Further,
the household survey was done using an interview
schedule to map demographic data, along with
travel mode choices, vehicle ownership and resident/
employee perception surveys.
1 Km
Figure 9: Diagram showing zone delineation at three levels of data collection and analysis;
Source: EMBARQ India
Rethinking Off Street Parking Regulations Around Station Areas In Mumbai 21LEVEL 1: REGIONAL destination surveys were conducted at railway
CONNECTIVITY platforms as well as in the 1km TOD influence zone to
To map regional connectivity passenger counts and study regional networks and modes used to access the
profiles were assessed at all the 18 entry/exit locations station.
at the Ghatkopar railway station. Passenger counts were
collected over a 16 hour time period on a week day.
Additionally, origin-
Figure 10: Image of Ghatkopar Station, Mumbai; Source: EMBARQ India
4000
3500
3000
Consumer Counts
2500
2000
1500
1000
5000
0
08.00 09.00 10.00 11.00 12.00 13.00 14.00 15.00 16.00 17.00 18.00 19.00 20.00 21.00
- - - - - - - - - - - - - -
09.00 10.00 11.00 12.00 13.00 14.00 15.00 16.00 17.00 18.00 19.00 20.00 21.00 22.00
Entry 14381 21953 18584 15720 14554 12527 12007 10806 9426 10644 13749 13880 10573 8174
Exit 13000 13000 16952 15640 13199 11065 10499 10926 10953 14554 18451 19612 15969 9990
Total 27381 34953 35536 31360 27753 23592 22506 21732 20379 25198 32200 33492 26542 18164
Figure 11: Graph showing the passenger counts at Ghatkopar station; Source: EMBARQ India
22During the morning peak the average commuter count
10% Business goes up to 36,500 people/ per hour and during the
15% No Data evening peak it goes up to 34,000 people per hour.
Hence during the peak hours of the day this amounts
to approximately 4000-6000 commuters entering or
9% exiting the station every 15mins, Figure 11. Over the
Students 16hr survey period, approximately 381,190 commuters
are recorded entering or exiting the station on a week
66% Service Professionals day. It is noteworthy that passengers commuting
from the east are proportionately fewer than those
commuting from the west. With the onset of the new
Metro line these numbers are projected to increase
thereby increasing congestion levels at entry/ exit
Figure 12: Graph showing occupation profiles of locations on the west these numbers are projected to
commuters conducting work-trips at Ghatkopar Station; increase thereby increasing congestion levels at entry/
Source: EMBARQ India exit locations on the west.
Passenger Counts
On an average Ghatkopar station receives up to 27,000
commuters per hour per weekday.
a. Trips Originating at Ghatkopar Station b. Trips Terminating at Ghatkopar Station
Figure 13: Origin (a)-Destination (b) maps showing regional connectivity to and from Ghatkopar Station; Source:
EMBARQ India
Rethinking Off Street Parking Regulations Around Station Areas In Mumbai 23Passenger Profile A comparison of modes used to access the station
The average passenger travelling at Ghatkopar station on the east and west, as in Figure 14, show that close
falls in the age bracket of 25-30 years, within the income to 50% commuters either walk or use NMT modes
bracket of 400,000-500,000 INR per year, conducting to reach the st ation on either side. However, BEST
a work-based trip. Figure 12 shows that 66% of the bus connectivity is better on the east, while more
commuters conducting work-trips at Ghatkopar station commuters prefer using IPT modes to access the station
are service professionals. (Here work trips include on west. While private modes are completely absent on
education trips made by students). service professionals. the west, 5% of the commuters are seen using private
(Here work trips include education trips made by vehicles to access the station on the east. This could be
students). attributed to parking facilities for private vehicles right
outside the station on the east side.
Origin – Destination Survey
The origin-destination (OD) survey helps map
accessibility, connectivity and the importance of
Ghatkopar station at precinct, city and regional \level. Mode-share in Ghatkopar west
The survey is carried out at two locations. The first is on
station platforms to map commuters’ place of origin and
destination while coming in or going out of Ghatkopar
station respectively. The second is within the 1km TOD
zone (but outside the station) to map ease of access 33% BEST 48% Walk
and modes used to reach the station, or the final place
of destination from the station. Based on the OD survey
73% of the trips originate at Ghatkopar, while 27% of 1% Cycle
the trips terminate there. Figure 13a, shows that 43%
of the trips originating at Ghatkopar, terminate in the 18% IPT
Island city. While 27% terminate in the eastern suburbs
and 25% terminate in the extended eastern suburbs.
Only 4.4% trips are carried out to the western suburbs
from Ghatkopar station. Figure 13b, shows that 31%
of the trips terminating at Ghatkopar, originate in the Mode-share in Ghatkopar east
Island city. While 28% originate in the eastern suburbs
and 39% originate in the extended eastern suburbs. 2% Car
Only 2% of the trips that originate in the western
suburbs terminate at Ghatkopar station.
35% BEST 49% Walk
The OD survey executed outside the station within the
TOD influence zone show that 49% of the commuters 3% 2 Wheeler
access the station by walk. 1% use cycles and other
NMT modes. 34% of the commuters reach the station 1% Cycle
using BEST feeder bus services and 13% use IPT (either 10% IPT
auto-rickshaws or taxis). Private vehicles either cars or
two-wheelers are used by only 3% of the commuters.
This is fairly indicative of a good public transport system
where private modes are least preferred. Hence, park- Figure 14: Mode shares at Ghatkopar east and west
and-ride facilities seem highly irrelevant in this context. respectively; Source: EMBARQ India
24LEVEL 2: NEIGHBOURHOOD to access the station on the east. This could be
CHARACTERISTICS attributed to parking facilities for private vehicles right
Based on the OD survey 73% of the trips originate at outside the station on the east side.
Ghatkopar, while 27% of the trips terminate there.
Figure 13a, shows that 43% of the trips originating Walkability Analysis
at Ghatkopar, terminate in the Island city. While 27% An initial survey of the TOD influence zone revealed
terminate in the eastern suburbs and 25% terminate that there is a high pedestrian footfall for a 10-12 min
in the extended eastern suburbs. Only 4.4% trips are walking distance from the station. A ‘ped-shed’ analysis
carried out to the western suburbs from Ghatkopar conducted within the TOD influence area (shown
station. Figure 13b, shows that 31% of the trips in figure 15) reveals that only 45% of the area in the
terminating at Ghatkopar, originate in the Island city. immediate zone can be covered in 3-6 minutes on foot.
While 28% originate in the eastern suburbs and 39% This indicates that the neighborhood is fairly walkable
originate in the extended eastern suburbs. Only 2% but could definitely be made more accessible by
of the trips that originate in the western suburbs providing shorter pedestrian and NMT connectors.
terminate at Ghatkopar station.
A good target for a walkable catchment is to have 60%
The OD survey executed outside the station within the of the area within a five-minute walking distance, or
TOD influence zone that 49% of the commuters access within ten minutes in the case of major transit stops.
the station by walk. 1% use cycles and other NMT This takes into consideration the ability of pedestrians
modes. 34% of the commuters reach the station using to get to and from all major destinations in the TOD
BEST feeder bus services and 13% use IPT (either auto- influence, which helps determine the influence zone
rickshaws or taxis). Private vehicles either cars or two- of a transit station based on accessibility and not just
wheelers are used by only 3% of the commuters. This distance.
is fairly indicative of a good public transport system
where private modes are least preferred. Hence, park- To execute a ped-shed analysis, four EMBARQ staff
and-ride facilities seem highly irrelevant in this context. walked in four different directions from different
station entry exit points, first on the east and then on
A comparison of modes used to access the station the west, for distances covered in 3, 6 and 12 minutes
on the east and west, as in Figure 14, show that close each, on foot. Areas that were accessible based on the
to 50% commuters either walk or use NMT modes time taken to walk there were highlighted for each
to reach the station on either side. However, BEST distance-time bracket. Figure 15 (left) shows a visual
bus connectivity is better on the east, while more representation of a ped-shed model. LBS road on
commuters prefer using IPT modes to access the the west impairs accessibility for commuters walking
station on west. While private modes are completely towards destinations that are west of the major
absent on the west, 5% of the commuters are seen collector road. On the east due to a high vehicular
using private vehicles movement outside the station, accessibility is impaired.
WHAT IS A PED-SHED MODEL?
Ped-shed also known as a walkable catchment can be defined as a given area (or distance walked) either to or
from a neighborhood or destination within the time frame of 5mins. For the purpose of the study at Ghatkopar
station it was assumed that a distance of 500m can be covered within 5mins of walking time. However, in
Mumbai, average walking and bicycling trip lengths are much higher than those recorded for most other cities.
The average acceptable walking trip length has been recorded as 0.91 km and average cycling trip length is
recorded as 2.7 km (Rastogi 2011).
Rethinking Off Street Parking Regulations Around Station Areas In Mumbai 25You can also read