RETROSPECTIVE ANALYSIS OF THE IMPACT OF LIQUIDITY CONTRACTS ON THE FRENCH MARKET (DECEMBER 2019 - MAY 2020) AND POTENTIAL CHANGES IN ACCEPTED ...
←
→
Page content transcription
If your browser does not render page correctly, please read the page content below
APRIL 2021

RETROSPECTIVE ANALYSIS OF THE
IMPACT OF LIQUIDITY CONTRACTS
ON THE FRENCH MARKET
(DECEMBER 2019 - MAY 2020)
AND POTENTIAL CHANGES IN
ACCEPTED MARKET PRACTICE
KHEIRA BENHAMI
ANNE DEMARTINI
LAURENT SCHWAGER

 amf-france.org
This study was coordinated by the Analysis, Strategy and Risk Division and the Data and Markets Directorate. It is based on
sources that are considered to be reliable but whose comprehensiveness and accuracy cannot be guaranteed. The views
expressed in “Risk and Trend Mapping” are those of the authors; they do not necessarily reflect the position of the AMF.

Copying, distributing or reproducing this report, in full or in part, is subject to prior express written authorisation from the AMF.

 -2-
EXECUTIVE SUMMARY This study analyses the accepted market practice for liquidity contracts on the Paris stock exchange (Euronext and Euronext Growth) between December 2019 and May 2020, which is an instructive period as it included both normal market functioning and crisis conditions. The study was made possible by the implementation of a reporting system allowing identification of the transactions of liquidity providers under liquidity contracts from the second half of 2019 onwards. The main conclusions of the study are as follows: More than 440 French companies benefitted from a liquidity contract over the study period, i.e. around 70% of the market. About ten investment service providers (ISPs) were identified as offering this liquidity service. This market is, moreover, fairly concentrated in terms of market shares. This reflects a specialisation of ISPs depending on the size of the client companies. Although the ISPs' transactions in the framework of liquidity contracts were frequent and regular, the trading volumes were limited, amounting to €4.9 billion over six months, which represents less than 1% of the amounts traded on these stocks and less than 0.5% of the total amounts traded in the Paris marketplace (i.e. all listed shares). However, the transactions could be significant for stocks that are illiquid: 1 for one-quarter of the trading sessions during which the ISP performed transactions, the amounts traded represented more than 20% of the daily business. Indeed, for 3% of the sessions, the market-maker ISP transactions enabled the company to obtain a reference price during the day. These valuation transactions concerned 79 illiquid shares, mostly belonging to the C compartment of Euronext or Euronext Growth. Statistical and econometric analysis showed that liquidity contracts can improve the quoted spreads and the price impact of the transactions for all stocks (illiquid, liquid and highly liquid). It can be noted, moreover, that liquidity contracts narrow the quoted spreads for liquid and highly liquid stocks in periods of market stress. The assessment was less clear-cut regarding effective spreads, with a positive effect only for liquid stocks, which did not persist during the crisis. The observed impact on market depth was insignificant. The transactions performed under liquidity contracts can fall within the framework of an accepted market practice provided that they comply with the conditions of volume, price and allocated financial resources. These conditions are variable depending on the degree of liquidity of the shares. They were specified by ESMA in 2017 and the AMF considered it necessary to ease certain conditions. Failure to comply with these conditions entails application of the ordinary provisions of law through the loss of the safe harbour conferred by an accepted market practice (AMP). Regarding volume conditions (cap on daily volumes traded after deducting an exemption of €20k): The limits were breached a small number of times, and for small amounts: there were 420 breaches over the six months studied, or less than 0.5% of the observations (out of more than 85,000 observations), representing just €12m (or 0.2% of the amounts traded under liquidity contracts). These breaches concerned only a minority of issuers (one-third of companies concerned) and remained very episodic. Simulations were performed in which the current criteria concerning the exemption and volume limits were varied with a view to their possibly being changed. They showed that a slight increase in the 1 Three categories of shares were considered: (i) highly liquid shares (liquid shares within the meaning of MiFID forming part of the composition of the CAC 40 Index; (ii) liquid shares (liquid shares within the meaning of MiFID not forming part of the composition of the CAC 40 Index; and (iii) illiquid shares (other shares). Pursuant to Delegated Regulation 2017/567 (Article 1), a share traded each day is considered as having a liquid market if all the following conditions are met: a) The free float of that share: i) is at least €100m, for shares admitted to trading on a regulated market, ii) and is at least €200m, for shares which are traded only on multilateral trading facilities (MTFs); b) The average number of daily transactions on the share is at least 250; c) The average daily trading volume concerning that share is at least €1m. -3-
exemption from €20k to €25k together with an increase in the ESMA limit as a percentage of turnover from 25% to 30% would make it possible to capture two-thirds of the breaches on illiquid shares. A 5% increase in the limit relating to liquid shares (i.e. raising it to 20%) would make it possible to capture 80% of the observed breaches. As regards the limit reserved for highly liquid shares, the benefit of raising the limit seems less obvious. The breaches of price limits, approximated by the narrowing of spreads, represented about one-quarter of the amounts traded. However, it appears that the narrowing of such spreads mostly corresponds to passive or partially passive orders (i.e. contributing to the liquidity of the order book). Aggressive orders (i.e. orders consuming liquidity) represented no more than 7% of the amounts traded for illiquid shares and less than 2% for liquid and highly liquid shares. Regarding the conditions for resources allocated by the issuer to the liquidity contracts (cap on the absolute amounts and relative amounts, as a percentage of capitalisation and as a percentage of turnover), it can be observed that: For illiquid shares, 90% of the contracts had an allocation not exceeding €1m and 95% of the contracts had an allocation not exceeding 1% of the issuer's market capitalisation (for a maximum limit set at 1% by ESMA and 1.5% by the AMF). The study also showed that the turnover limit was apparently not relevant for this category of shares; For liquid shares, 95% of the contracts had an allocation not exceeding €20m (i.e. the limit set by ESMA, whereas the limit set by the AMF is €30m). Moreover, 90% of the contracts had an allocation not exceeding the authorised maximum average turnover; 30% of the contracts on highly liquid shares had an allocation reaching the cap on resources (€50m) and 70% of the contracts had an allowance representing around 70% of the average turnover observed in 2020. -4-
1. INTRODUCTION
The Market Abuse Regulation (MAR) 2 provides a harmonised framework for the prohibition of market
manipulation in the European Union, but provides for the possibility of derogations if the observed
behaviour took place for legitimate reasons and in accordance with a market practice accepted by a
competent national authority ("accepted market practice" or AMP).

Accordingly, the AMF has established liquidity contracts on shares as an accepted market practice. The
liquidity contract is concluded between an issuer and an investment service provider and aims to foster
market liquidity and ensure the regularity of quotations for the issuer's shares. To this end, the
investment service provider performs transactions in the market on behalf of the issuer, using a shares
and cash allocation entrusted to it by the latter.

In April 2017, ESMA specified in an Opinion on "points of convergence" the conditions that seemed to it
necessary to harmonise accepted market practice relating to liquidity contracts, notably by setting
transaction limits in terms of price and volume, variable depending on the degree of liquidity of the
shares. 3 After consulting the marketplace, the AMF considered it necessary to ease some of these
conditions.

Due to the small number of countries in which this market practice exists and the small quantity of data
available, very few academic studies have been published on the subject. They cover the French market
(Venkataraman and Waisburd, 2007) and the Swedish market (Anand, Tanggaard and Weaver, 2009).
Anand et al. showed, in particular, that the signature of a liquidity contract contributes to a reduction in
quoted spreads and an increase in the depth of the order book, as well as a reduction in volatility and
an increase in the size of transactions. For their part, Menkveld and Wang (2013) analysed the impact of
the liquidity providers designated by Euronext for the least liquid stocks and showed, in particular, that
their transactions result in an improvement in the liquidity of the stocks in question.

This note analyses the accepted market practice for liquidity contracts on the Paris stock exchange
(Euronext and Euronext Growth) between December 2019 and May 2020. To the best of the AMF's
knowledge, no comparable study has been performed in the past, since it was made possible only by the
introduction of a reporting system from the second half of 2019, allowing identification of the
transactions of liquidity providers within the framework of liquidity contracts.4 Note the relevance of
the study period, which covers highly diverse market conditions, including both periods of normal
market functioning and the episode of substantial stock market turmoil at the start of the health crisis.

2
 Regulation (EU) No. 596/2014 of the European Parliament and of the Council of 16 April 2014.
3 In this note, three categories of shares are considered:
- highly liquid shares: liquid shares within the meaning of MiFID included in the composition of the underlying basket of the CAC 40 Index;
- liquid shares: liquid shares within the meaning of MiFID not included in the composition of the underlying basket of the CAC 40 Index;
- illiquid shares: other shares.
Pursuant to Delegated Regulation 2017/567 (Article 1), a share traded each day is considered as having a liquid market if all the following
conditions are met:
a) The free float of that share: i) is at least €100 million, for shares admitted to trading on a regulated market, ii) and is at least €200 million, for
shares which are traded only on multilateral trading facilities (MTFs);
b) The average number of daily transactions on the share is at least 250 ;
c) The average daily trading volume concerning that share is at least €1 million.
4 Following discussions between Euronext, the AMAFI and the AMF, the market operator put in place a specific flag allowing liquidity contract

managers to report to the AMF information making it possible to identify orders coming within the implementation of a liquidity contract in
the Euronext order book.

 -5-
Figure 1: CAC 40 performance and implied volatility Source: Refinitiv The study endeavoured first to identify the companies using a liquidity contract and the investment service providers (ISPs) providing this service, and then to measure the ISPs' activity within the framework of the liquidity contracts and their impact on the liquidity of the shares concerned. The final section is devoted to an analysis of compliance with the criteria of ESMA and the AMF, and possible changes therein. 2. PRESENTATION OF THE SAMPLE 2.1. CHARACTERISTICS OF ISSUERS USING LIQUIDITY CONTRACTS Between 1 December 2019 and 30 May 2020, 442 French companies whose shares were admitted to trading on Euronext and Euronext Growth used the services of an ISP within the framework of a liquidity contract, over all or part of the period. 5 Of these, six companies changed liquidity provider during the study period. This practice is therefore most prevalent in France, because it concerns around 70% of listed companies, including companies whose shares are considered liquid. Thus, while three-quarters of the shares with a liquidity contract are considered illiquid within the meaning of MiFID, conversely, more than half of the CAC40 French companies have signed a liquidity contract. Table 1: Breakdown of the sample companies according to the criterion of the share's liquidity and comparison with the stock exchange as at 30/06/2020 Sample Paris stock exchange as at 30/06/2020 Degree of liquidity of the Without Companies with LC Number % With LC % % Total % shares LC as % of total market Illiquid 339 77% 333 76% 155 81% 488 78% 68% Liquid 81 18% 82 19% 23 12% 105 17% 78% Highly liquid (CAC 40) 22 5% 22 5% 14 7% 36 6% 61% Total 442 100% 437 100% 192 100% 629 100% 69% Source: ESMA/Euronext, AMF calculations 5 Of these, six companies changed liquidity provider during the study period. -6-
An analysis of the breakdown of companies by market segment depending on whether or not they have
signed a liquidity contract nevertheless shows that companies that have not subscribed to a liquidity
contract are over-represented in the small-cap segments (Euronext C and Euronext Growth). One
explanation could be the fact that some of these small issuers, whose shares are not liquid, would not
have sufficient financial resources to allocate capital to a liquidity contract.

 Figure 2: Breakdown of companies listed in Paris that have or have not signed a liquidity contract by market
 segment (as at 30 June 2020)

 100%

 90%
 33% 30% 31%
 80%

 70%

 60% 24%
 26%
 50% 33%

 40%
 24%
 30% 22%
 15%
 20%

 10% 19% 22% 21%

 0%
 No LC LC Total
 Euronext A Euronext B Euronext C Euronext Growth
 Source: Euronext, AMF calculations

 2.2. LIQUIDITY PROVIDERS

Of the ten liquidity providers identified, three share over half of the market between them, in terms of
companies covered. On the other hand, in terms of trading volumes, half of the liquidity providers have
almost total market share, with one market participant by itself representing one-third of the market.

 -7-
Figure 3: Market shares Figure 4: Market shares
 (number of companies covered) (trading volumes)
 PSI 10 PSI 8
 0% 1%
 PSI 10 PSI 8
 PSI 1 5% 5% PSI 2
 6% 7%
 PSI 1 PSI 2
 PSI 7 PSI 7
 16% 18%
 9% 1%

 PSI 6 PSI 6
 20% 5% PSI 5
 0%

 PSI 4 PSI 4
 21% 35%
 PSI 5
 PSI 3
 4%
 24%

 PSI 9 PSI 3
 9% 14%
 PSI 9
 0%

Source: Euronext, AMF calculations

This difference between market shares according to the number of companies followed and according
to the volume of transactions executed under liquidity contracts partly reflects the incomplete nature
of the market participants' reports, although there has been a noticeable improvement since the
establishment of the reporting system at the end of 2019. For example, over the entire study period,
one market participant reported to the regulator no data to identify the orders placed and transactions
executed within the framework of liquidity contracts.

The difference also reflects a relative specialisation of market participants according to the size of the
issuers. The liquidity providers with the largest market shares in volume terms are also those that have
signed a contract with the companies present in the A and B compartments of Euronext. Conversely,
some ISPs are mostly positioned on very small caps, especially on Euronext Growth.

 Figure 5: Breakdown of companies with a liquidity contract by market segment and liquidity provider

 PSI 1 78% 22%

 PSI 2 58% 35% 6%

 PSI 3 35% 30% 21% 14%

 PSI 4 33% 34% 22% 12%

 PSI 5 11% 5% 32% 53%

 PSI 6 4% 20% 32% 43%

 PSI 7 3% 15% 30% 53%

 PSI 8 42% 33% 25%

 PSI 9 13% 31% 56%

 PSI 10 5% 25% 70%

 Euronext A Euronext B Euronext C Euronext Growth

 Source: Euronext, AMF calculations, investment service providers

 -8-
3. MARKET ANALYSIS: ACTIVITY WITHIN THE FRAMEWORK OF LIQUIDITY
 CONTRACTS APPEARS LIMITED ON THE WHOLE, BUT SIGNIFICANT FOR
 ILLIQUID SHARES

Between the start of December 2019 and the end of May 2020, €4.9 billion was traded under liquidity
contracts. Overall, this amount represents hardly 0.8% of the total amounts traded in these shares (and
0.4% of the total amounts traded on the Paris stock exchange as a whole).

 Table 2: Amounts traded within the framework of a liquidity contract

 Liquidity contracts: Amounts Total amounts traded
 %
 traded (Buy & Sell, €bn) (single count, €bn)
 Illiquid 0.4 10.6 2.0%
 Liquid 2.4 90.1 1.3%
 Highly liquid 2.1 221.8 0.5%
 Grand total 4.9 322.6 0.8%
 Source: Euronext, AMF calculations

Moreover, the amounts traded under liquidity contracts decreased sharply after the onset of the Covid-
19 crisis (falling by half between March and April). This began in March, while the total amounts traded
on the same shares peaked during this period.

 Figure 6: Amounts and stocks traded under a Figure 7: Amounts and stocks traded in Paris
 liquidity contract (EUR million) (EUR billion)

 1 200 4 200
 Millions €

 Milliards

 3 180
 1 000
 3 160
 3 140
 800
 3 120
 600 3 100
 3
 80
 400
 3
 60
 3
 200 40
 3
 20
 - 3
 Dec-19 Jan-20 Feb-20 Mar-20 Apr-20 May-20 -
 Dec-19 Jan-20 Feb-20 Mar-20 Apr-20 May-20
 Amount (€M) Number of securities traded (right-hand scale)
 Securities with LC contracts securities without contracts

Source: transaction reporting, AMF calculations

This decline in trading cannot be attributed to official suspensions of liquidity contracts since the onset
of the Covid-19 crisis. Indeed, only two notifications were received by the AMF in March 2020
(concerning Accor and Antalis shares), and three over the whole study period (December 2019–
May 2020). By comparison, seven suspensions of liquidity contracts had been recorded in the first half
of 2019. Note, however, that in practice certain ISPs halted their transactions completely in March and
early April. Indeed, market-maker ISPs greatly increased the weight of trading performed outside of the
liquidity contract, going from less than half at the start of the period to almost two-thirds of trading in
May 2020.

 -9-
Figure 8: Amounts traded by market-maker ISPs in shares with a liquidity contract (EUR million)

 33,000
 000 60%

 Millions 54% 53%
 52%
 22,500
 500 50%

 22,000
 000 40%
 35% 37%

 11,500
 500 33% 30%

 1 000
 1,000 20%

 500 10%

 0 0%
 déc.-19 janv.-20 févr.-20 mars-20 avr.-20 mai-20
 Within the liquidity contract Outside the liquidity contract Within the liquidity contract (%)

 Source: transaction reporting, AMF calculations

It should also be noted that three ISPs reported a total absence of transactions outside of the liquidity
contract. Regarding this, it would seem that, for these transactions, these ISPs prefer to go through
another market member providing them with direct market access (DMA), due to lower costs. 6

In general, the frequency of trading by ISPs within the framework of liquidity contracts is high,
irrespective of the liquidity level. For half of the liquid or illiquid shares, the ISPs perform transactions,
with few exceptions, during each trading session (left-hand graph). However, the weight of the volumes
traded under liquidity contracts relative to daily volumes is especially significant when the level of
liquidity of the shares is low. On illiquid shares, for one-quarter of the trading sessions during which the
ISP performed transactions, the amounts traded within the framework of liquidity contracts represented
more than 20% of the daily business, or even 40% in 10% of cases (right-hand graph).

 Figure 9: Frequency of ISP trading under liquidity Figure 10: Weight of volumes traded under LCs by
 contracts (% of the total number of trading sessions comparison with total volumes (daily data, as a %)
 per security)

 100

 80

 60

 40

 20

 N = 299 N = 78 N = 21
 0
 Not Liquid Liquid Very Liquid
 P5 P10 Q1 Q2 Q3 P90 P95
Source: transaction reporting, AMF calculations

6
 Liquidity contract managers are obliged to intervene as a market member for transactions coming under the liquidity contract. This provision
had been adopted in accepted market practice to improve the traceability of the transactions concerned.

 - 10 -
The average amount traded under liquidity contracts was very small, not exceeding €10,000 for a
majority of issuers.

Table 3: Distribution of the average amounts traded by issuer and by trading session under a liquidity contract
 (EUR thousand)

 No. P5 P10 Q1 Median Q3 P90 P95
 Illiquid 299 0.6 1.0 2.6 5.7 13.2 25.8 34.4
 Liquid 78 21.0 40.5 71.2 193.3 407.0 694.9 907.9
 Highly liquid 21 276.6 321.5 451.5 898.5 1,358.1 2,157.1 2,181.0
 Total 398 0.6 1.2 3.7 10.4 40.5 399.8 708.1
 Source: transaction reporting, AMF calculations

For 3% of the sessions, the market-maker ISP transactions enabled the company to obtain a reference
price during the day. These "valuation transactions" (in which the liquidity provider is on both the buy
side and sell side for a single share traded 7 during the day) concerned 79 illiquid shares, mostly belonging
to the C compartment of Euronext or Euronext Growth. They represented more than a quarter of the
companies in these market segments with a liquidity contract.

 Table 4: Shares with liquidity contract for which there has at least once been a valuation transaction during a
 trading session

 Euronext B Euronext C Euronext Growth Total
 Number 17 29 33 79
 % 16% 28% 26% 18%
 Source: transaction reporting, AMF calculations

For some of these stocks, these valuation transactions were highly frequent: they concerned almost half
of the trading sessions for about ten companies.

 Table 5: Frequency of valuation transactions by issuer (relative to all trading sessions)

 Number of stocks
 Average Q1 Median Q3 perc90 perc95 perc99
 concerned
 79 15.5 2.0 7.3 19.3 54.2 75.2 96.7
 NB: For 25% of the stocks for which there has at least once been a valuation transaction under a liquidity contract, this single
 valuation transaction allowed a price to be quoted for close to 20% of trading days during the study period.
 Source: transaction reporting, AMF calculations

7
 "Valuation transactions" form part of a mechanism established by Euronext to be able to quote an indicative price without generating a
transaction.

 - 11 -
For the least liquid shares, the existence of a liquidity contract therefore significantly improves the quotation rate: nearly all these shares with a liquidity contract and present throughout the study period quoted a price during each trading session. Conversely, one-quarter of the shares without a liquidity contract quoted a price in less than 37% of trading sessions. Table 6: Frequency of quotation of illiquid shares (days quoted/number of sessions over the period, as a %) Number Average P10 Q1 Q2 Q3 No LC 144 66 16 37 77 100 With LC 304 99 100 100 100 100 NB: 25% (Q1) of the shares without a liquidity quote a price on less than 37% of trading days. Source: transaction reporting, AMF calculations 4. CAN LIQUIDITY CONTRACTS IMPROVE THE LIQUIDITY OF STOCKS? 4.1. DESCRIPTION OF THE VARIABLES AND DESCRIPTIVE STATISTICS In order to measure the potential supply of liquidity resulting from liquidity contracts, four standard metrics were analysed one after the other: 8 quoted spread is the difference between the ask price and the bid price appearing in the order book. It is expressed in basis points (i.e. relative to the mid-point of the corresponding spread). The larger the spread, the higher will be the cost of execution of an order and the lower will be the liquidity; effective spread, for its part, corresponds to the indirect transaction cost effectively paid by an investor when trading: it is defined as the difference between the trading price and the mid- point of the spread observed at the time of the transaction (in basis points, i.e. relative to the mid-point of the spread). An effective spread which increases reflects a deterioration of liquidity; market depth corresponds to the amounts available at the best limits (i.e. expressed in euros). The greater the depth, the better the liquidity; Amihud illiquidity indicator, 9 which is a measure of market impact, aims to measure price sensitivity versus trading volumes. It compares the absolute value of the price variation between two transactions with the associated volume. It can be interpreted as the price response associated with one euro of trading volume. The Amihud indicator is negatively correlated with the liquidity of a security. The more liquid the security, the larger will be the trading volume required to cause movements in the security's price. 8 For a review of the liquidity metrics, refer, in particular, to Fong, Holden and Trzcinka (2017). 9 See Amihud (2002). - 12 -
Table 7: Descriptive statistics for all stocks, by liquidity class

 Panel A - Securities not benefiting from a liquidity Panel B - Securities benefiting from liquidity
 contract contract
 (1) Illiquid shares
 Mean Median Min Max Mean Median Min Max
Quoted spread (Bps) 179.26 136.4 18.01 599.72 125.03 97.87 1.14 599.88
Depth at the best price limts 2 194 489 1 19 962 715 265 1 19 609
Depth at the ten best price limits 29 819 5 769 8 421 549 9 901 3 403 22 493 336
Effective spread (Bps) 77.15 51.37 0,00 593.26 59.65 40.55 0,00 589.26
Amihud (x100) 0.0194 0.0013 0,0000 0.771 0.0061 0.0009 0,0000 0.778
Market cap (millions €) 475 113 1 4 546 382 162 5 4 269
Daily volumes (€) 223 284 39 759 6 15 659 983 215 435 58 376 3 35 204 613

 (2) Liquid shares
 Mean Median Min Max Mean Median Min Max
Quoted spread (Bps) 30.58 21.05 3.23 333.27 24.49 19.68 3.19 302.39
Depth at the best price limts 922 406 9 11 171 660 361 34 19 854
Depth at the ten best price limits 17 965 7 148 194 158 962 13 016 7 198 742 438 111
Effective spread (Bps) 12.19 6.47 0.65 344.45 8.56 5.42 0.54 269.93
Amihud (x100) 0.0003 0.0001 0,0000 0.0121 0.0002 0.0001 0,0000 0.264
Market cap (millions €) 3 253 1 665 207 10 465 4 239 2 597 160 31 091
Daily volumes (€) 10 390 084 4 444 250 22 885 122 553 214 9 998 428 4 918 829 14 825 437 316 488

 (3) Highly liquid shares
 Mean Median Min Max Mean Median Min Max
Quoted spread (Bps) 5.4 4.28 1.57 24.98 6.8 4.85 1.54 32.68
Depth at the best price limts 944,0 612 108,0 5 530,0 980,0 416 23,0 10 572,0
Depth at the ten best price limits 19 679,0 13254 1 635,0 91 199,0 19 665,0 8188 273,0 161 909,0
Effective spread (Bps) 2.59 1.75 0.44 351.74 2.74 1.85 0.44 363.72
Amihud (x100) 0,0000 0,0000 0,0000 0.0002 0,0000 0,0000 0,0000 0.0001
Market cap (millions €) 51 044 43 548 7 564 161 310 35 659 18 856 6 583 212 427
Daily volumes (€) 147 698 645 110 121 141 5 872 449 1 048 924 515 86 919 479 60 496 609 3 285 201 949 779 842

 Source: transaction reporting, AMF calculations

 - 13 -
4.1.1. Analysis of spreads

In the case of illiquid shares, shares with a liquidity contract showed smaller quoted and effective
spreads than those of other shares. This difference was far less obvious for liquid shares. For the most
liquid shares, the quoted spreads seemed even wider for shares with liquidity contract, which is probably
due to a composition bias, because the CAC 40 stocks with liquidity contracts are on average less liquid
than those without such contracts. 10 Note that during the market correction phase, the existence of the
liquidity contract seems to limit the impact on spreads for the liquid shares and, to a lesser extent, for
illiquid shares.

 Figure 11: Evolution of quoted and effective spreads according to the security's degree of liquidity (December
 2019-May 2020)
The spreads are expressed in basis points, i.e. the price difference is compared with the prevalent mid-point of the spread.
The blue curves (red curves respectively) correspond to the values observed for shares with a liquidity contract (without a
liquidity contract, respectively). The vertical bar shows the start of the market correction phase related to the health crisis
(18/02/2020).

 Quoted spreads Effective spreads
 A) Illiquid stocks

 B) Liquid stocks

10 Cf. descriptive statistics (Table 5).

 - 14 -
C) Highly liquid stocks

Source: transaction reporting, AMF calculations

 4.1.2. Market depth

The quantities offered at the best limit appeared larger for liquid shares without a liquidity contract,
especially in normal market conditions. Regarding the highly liquid and illiquid shares, there was
apparently no difference between shares with a liquidity contract and those without one.

 Figure 12: Evolution of amounts available at the best limit according to the security's degree of liquidity
 (December 2019-May 2020)

The depth is expressed in euros. The blue curves (red curves respectively) correspond to the values observed for shares with a
liquidity contract (without a liquidity contract, respectively). The vertical bar shows the start of the market correction phase
related to the health crisis (18/02/2020).

 A) Illiquid stocks B) Liquid stocks C) Highly liquid stocks

Source: transaction reporting, AMF calculations

 - 15 -
4.1.3. Price impact

Analysis of the Amihud price impact indicator showed that, in the case of illiquid stocks, liquidity was
improved for shares with a liquidity contract. For liquid shares, the contribution of the liquidity contracts
was noticeable especially after the start of the market correction. However, it seemed relatively
insignificant for highly liquid shares, over the whole study period.

 Figure 13: Evolution of the illiquidity indicator according to the security's degree of liquidity (December 2019-
 May 2020)

The Amihud indicator is interpreted as the price response associated with one euro of trading volume. The blue curves (red
curves respectively) correspond to the values observed for shares with a liquidity contract (without a liquidity contract,
respectively). The vertical bar shows the start of the market correction phase related to the health crisis (18/02/2020).

 A) Illiquid stocks B) Liquid stocks C) Highly liquid stocks

Source: transaction reporting, AMF calculations

The trends observed via these indicators must undergo more thorough analysis. This is because, as
mentioned earlier and as shown by the descriptive statistics, composition biases may exist. Thus,
amongst the highly liquid shares, it is undoubtedly the least liquid shares of these which use liquidity
contracts. Likewise, of the least liquid shares, only those which have the means to allocate resources to
a liquidity contract use one. The following econometric analysis allows us to take into account these
variabilities and capture the effect of liquidity contracts on the shares’ degree of liquidity.

 4.2. ECONOMETRIC ANALYSIS
 4.2.1. Description of the model

The proposed analysis aimed to test the null hypothesis according to which liquidity contracts can
improve stocks’ liquidity. The interest of the study period in question (December 2019-May 2020) lay in
the fact that this liquidity could also be assessed in stressed market conditions.

To do so we considered the following model:
 = ∝ + 1 + 2 _ + 2 + β + + + εit

where is the average liquidity indicator observed at time t for security i, i.e. the quoted spread, the
effective spread, the depth at the best limit (logdepth) and the Amihud price impact indicator (multiplied
by 1000).
The variable is a dummy variable which takes the value 1 when the share has a liquidity contract.
However, the fact of having a liquidity contract does not mean that the market maker performs

 - 16 -
transactions on the security. Moreover, this variable will also reflect the biases outlined in the preceding
section. That is why, in order to capture the real contribution of the market maker, we considered the
proportion of the trading volume within the framework of the liquidity contract ( ).
Accordingly, if our null hypothesis is verified, the coefficient associated with the variable should be
significant and negative for variables measuring the spreads and price impact, and positive for the
variable measuring the market depth.

The impact of the stressed market conditions was captured by the variable, which is a dummy
equal to 1 during the period covering the Covid-19 health crisis (from March 2020 to May 2020). In order
to determine whether the activity related to liquidity contracts was beneficial for the stocks in question,
we crossed it with another dummy variable which takes the value 1 when the market maker is active
during the day in question ( _ ). This variable made it possible to allow for the fact
that, even though theoretically certain shares continued to benefit from the liquidity contract, some
service providers halted their transactions in March and April (cf. Part 1). A coefficient that is significant
and less than that associated with will denote a liquidity contribution by these contracts in periods
of stress.

Lastly, corresponds to a matrix bringing together all the control variables calculated each day for
each security (market capitalisation, trading volumes, price level, volatility of the security, market
volatility). and represent the fixed effects related to the stocks and the period respectively.

 4.2.2. Results

The following table shows the results obtained for each category of shares 11.

As regards the quoted spreads, all else being equal, they seem tighter for illiquid shares with a liquidity
contract. Conversely, the quoted spreads for liquid and highly liquid stocks prove to be wider.

The results also show that the active presence of the market maker improved the quoted spreads for all
stocks, illiquid, liquid and highly liquid: the spreads decreased by 3.7 bb, 4 bp and 1.37 bp respectively
when the activity related to liquidity contracts increased by 10%.

The results were less clear-cut for effective spreads: while they narrowed with liquidity-contract activity
for liquid stocks (-1.33 bp for a 10% increase in activity), they increased for illiquid stocks (+1 pb) and
varied non-significantly for highly liquid stocks.

The presence of the market maker in the crisis period was also able to densify the order book of liquid
and highly liquid stocks and limit the impact on quoted spreads (which show coefficients associated with
the variable _ that are significant and less than those associated with ). We did
not observe this densification for illiquid stocks. Likewise, we found no significant impact of market
making on effective spreads during the crisis.
As regards market depth, while the coefficients associated with the market share of liquidity contracts
were significant and negative for illiquid and liquid stocks, the associated impact appeared insignificant
and even non-significant for highly liquid stocks. This finding did not change during the crisis period.

11 Augmented Dickey Fuller and KPSS tests were run to check for the stationarity of the variables over the period. Moreover, separate

regressions over the two sub-periods gave similar qualitative results. Considering the entire period allows capturing the effect of liquidity
contracts during the crisis.

 - 17 -
Lastly, concerning the price impact, the use of a liquidity contract reduced the price impact of
transactions for all the stocks. This reduction was more pronounced for illiquid stocks. However, this was
no longer the case during the crisis period.

 Table 8: Impact of liquidity contracts on stocks’ liquidity

 Illiquid shares Liquid shares Highly liquid shares
 Quoted Effective Quoted Effective Quoted Effective
 Logdepth Amihud Logdepth Amihud Logdepth Amihud
 spread spread spread spread spread spread
 (1) (2) (3) (4) (1) (2) (3) (4) (1) (2) (3) (4)

 *** ** *** *** *** ** ** ** *** **
Prop_LC -37.4185 10.1601 -0.2258 -0.0556 -40.0883 -13.3635 -0.1788 -0.0048 -13.7336 27.8124 0.1157 -0.0005
 (5.2870) (4.4888) (0.0203) (0.0176) (5.4334) (5.4136) (0.0717) (0.0022) (3.9962) (21.7960) (0.3179) (0.0002)
 ** *** ***
LC_active x crise -2.1687 2.2734 -0.0109 0.0150 -1.6567 -0.4504 -0.0417 -0.0002 0.6871*** -0.1424 0.0040 0.00001***
 (1.8206) (1.5457) (0.0070) (0.0060) (0.3424) (0.3412) (0.0045) (0.0001) (0.0866) (0.4726) (0.0069) (0.000004)
LC -223.3099*** -48.7765*** 0.3950*** -0.0988** 27.8795*** 10.9236** 0.1448** 0.0059*** 18.2139*** 1.8923 0.2474
 **
 0.0009
 ***

 (12.5946) (10.6932) (0.0484) (0.0418) (4.3607) (4.3449) (0.0576) (0.0018) (1.2118) (6.6094) (0.0964) (0.0001)
Crise 56.3638 62.1145 0.1693 -0.1812 1.6630 6.1317 0.5758*** -0.0036 -5.6897 49.8808** -0.1307 -0.0003
 (70.7894) (60.1024) (0.2721) (0.2352) (15.7319) (15.6747) (0.2077) (0.0065) (4.1011) (22.3681) (0.3262) (0.0002)
Price Level -59.0723*** -8.8899 -0.4013*** -0.0041 -12.0676*** -6.3604*** -0.5703*** -0.0072*** -4.8539*** -2.6439 -0.7894
 ***
 -0.0008***
 (6.8113) (5.7830) (0.0262) (0.0226) (1.5162) (1.5107) (0.0200) (0.0006) (0.5286) (2.8828) (0.0420) (0.00003)
Log capi 6.3180 10.1274 -0.7656*** -0.2085*** -27.2199*** -8.6579 -0.2363*** -0.0052* -40.7075*** -8.8939 0.5241** -0.0026***
 (19.7141) (16.7379) (0.0758) (0.0655) (6.5520) (6.5281) (0.0865) (0.0027) (2.8816) (15.7165) (0.2292) (0.0001)
 *** *** *** ***
Log volumes -21.0657 -11.2522 0.1365 -0.0664 -8.2738*** -1.1210** 0.1962*** -0.0025*** -4.4035*** -0.3864 0.1683*** -0.0002***
 (1.0281) (0.8729) (0.0040) (0.0034) (0.4862) (0.4844) (0.0064) (0.0002) (0.2195) (1.1970) (0.0175) (0.00001)
 466.1572** 104.2921
 **
Volatility 720.3944*** * -0.8933*** 0.5172*** * 62.9366*** -0.5107*** 0.0073
 ***
 32.7456
 ***
 10.2185 -0.6609
 ***
 0.0007***

 (13.8530) (11.7616) (0.0532) (0.0460) (4.0491) (4.0344) (0.0535) (0.0017) (1.7027) (9.2868) (0.1354) (0.0001)
 *** *
Vcac -3.1325 -4.5283 -0.0151 0.0129 0.4640 -0.2438 -0.0476 0.0003 0.4915 -3.3171** -0.0117 0.00002
 (4.9530) (4.2052) (0.0190) (0.0165) (1.1013) (1.0972) (0.0145) (0.0005) (0.2872) (1.5663) (0.0228) (0.00001)

 *** 230.2005** *** ** 152.5629** * *** *** 196.2428**
Constant 492.3774 * 3.6037 0.5746 * 46.2579 3.7567 0.0377 *
 94.6521 0.6896 0.0129***

 (80.4391) (68.2952) (0.3092) (0.2672) (26.8550) (26.7573) (0.3546) (0.0110) (12.3188) (67.1881) (0.9799) (0.0006)

 Observations 23 450 23 450 23 450 23 450 11 856 11 856 11 856 11 856 4 458 4 458 4 458 4 458
 2
R 0.6096 0.3303 0.8445 0.2326 0.8108 0.4500 0.9038 0.4687 0.8675 0.0511 0.9391 0.7625
Note: significance level: ***p-value < 0.001, **p-value < 0.01, *p-value < 0.05, . p-value< 0.1

Source: transaction reporting, AMF calculations

Thus, the liquidity contracts improved the quoted spreads and price impact of transactions for all the
stocks. We noted, moreover, for the quoted spreads, a densification of the order book of liquid and
highly liquid stocks during the crisis. The results were less clear-cut for effective spreads and insignificant
concerning market depth.

 - 18 -
5. ANALYSIS OF BREACHES OF LIMITS AND GUIDANCE CONCERNING CHANGES
IN MARKET PRACTICE
To benefit from the safe harbour, the transactions of financial intermediaries must comply with the
trading limits in terms of volume (5.1) and price (5.2), and issuers may allocate resources to the liquidity
contract within certain limits (5.3). These limits differ depending on the shares’ liquidity.
5.1. ANALYSIS OF VOLUME BREACHES
5.1.1. Recap of the rules on volumes
To be able to benefit from the safe harbour provided for by the AMF's accepted market practice, the
liquidity contract manager must comply with daily trading limits on volumes depending on the share's
liquidity segment. These limits apply whenever the ISP's cumulative buy and sell transactions under the
liquidity contract represent more than €20k ("the exemption").
Thus, the daily liquidity-contract transactions adjusted for the exemption must not represent, on both
the buy side and sell side, more than a certain percentage of the average amounts traded during the 30
previous trading sessions, this percentage being defined according to the security's degree of liquidity.
These limits, as defined in an ESMA position paper, amount to 25%, 15% and 5% respectively for illiquid,
liquid and highly liquid shares. In 2018, the AMF considered that an easing of these limits was justified
for illiquid and liquid shares, and therefore increased them to 50% and 25% respectively. 12 However, this
easing came with a condition: when the limits defined by ESMA are not complied with, the market maker
must be able to justify the breaches. Above the limit defined by the AMF, the ordinary provisions of law
apply: the issuer and the intermediary do not benefit from the legal protection provided by accepted
market practice.
Table 9: Volume limits stipulated by ESMA and the AMF (as a percentage of the average turnover of the 30
preceding trading sessions)
Segment "ESMA limit" "AMF limit"
Illiquid shares 25% 50%
Liquid shares 15% 25%
Highly liquid shares 5% 5%
Sources: ESMA, AMF
5.1.2. Results
Breaches of the volume limits stipulated by ESMA and the AMF concerned only a minority of
issuers and remain very episodic
Two-thirds of the stocks with a liquidity contract experienced no breach of the ESMA limits during the
period under review. For nearly all the stocks that experienced at least one breach, this remained
occasional, occurring less than about once a month (one out of twenty trading sessions). Only 3% of the
companies whose shares are illiquid (i.e. less than 10 companies) recorded more frequent breaches.
12 AMF decision No. 2018-01 of 2 July 2018 on the establishment of liquidity contracts on shares as part of accepted market practice
- 19 -A minority of issuers, representing less than 10% of the sample, breached the limits stipulated by the AMF at least once. What is significant is that very few illiquid and liquid shares were concerned and, when they were, here again, the frequency of breaches was low (less than 5% of trading sessions). Figure 14: Frequency of breaches of the ESMA limits according to shares’ degree of liquidity (as a % of trading sessions) 100% 2% 4% 1% 3% 4% 5% 3% 5% 5% 14% 5% 90% 19% 17% 80% 18% 14% 14% 8% 13% 70% 60% 50% 92% 92% 91% 40% 69% 71% 64% 66% 30% 20% 10% 0% ESMA AMF ESMA AMF ESMA/AMF ESMA AMF Not liquid Liquid Very liquid Total N=299 N=78 N=21 N=398 0
Figure 15: Number of volume limit breaches Figure 16: Amounts of volume limit breaches (€ million)

Source: transaction reporting, AMF calculations

 Of these 420 observations, slightly less than 366, for a trading volume of €7.5 million, breached the ESMA
 limit, whereas they were still considered by the AMF as theoretically benefitting from the safe harbour.
 54 breaches, for a total amount of €4.5 million, took place beyond the limits stipulated by the AMF (so-
 called "level-2 breaches").

 It also appears that, for liquid and highly liquid shares, the breaches were mostly related to sell
 transactions. This preponderance of breaches on the sell side for liquid and highly liquid shares could be
 explained by a rebalancing of resources between cash and shares on the liquidity account, with liquidity
 providers wanting to be able to cope with possible future selling pressure.

 In any case, given the total amounts traded under liquidity contracts, the amounts of the breaches seem
 very small, no matter the shares' degree of liquidity. For illiquid shares, the exemption represented more
 than 60% of the trading volumes, reflecting the small amounts traded on these shares under liquidity
 contracts. On the other hand, this proportion was smaller for more liquid shares.

 Figure 17: Breakdown of amounts traded under liquidity contracts by degree of liquidity

 Source: transaction reporting, AMF calculations

 - 21 -
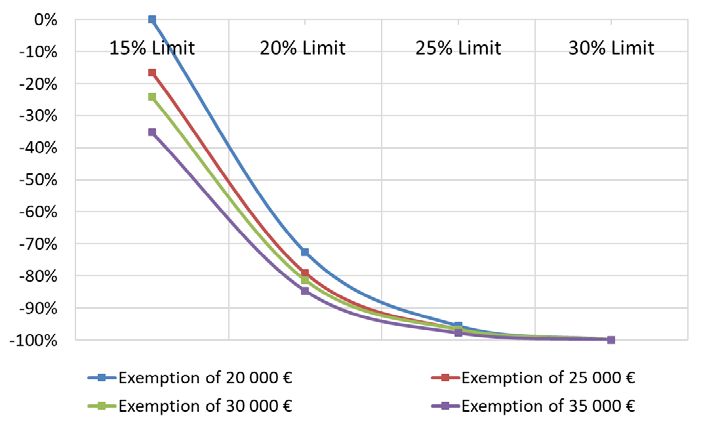
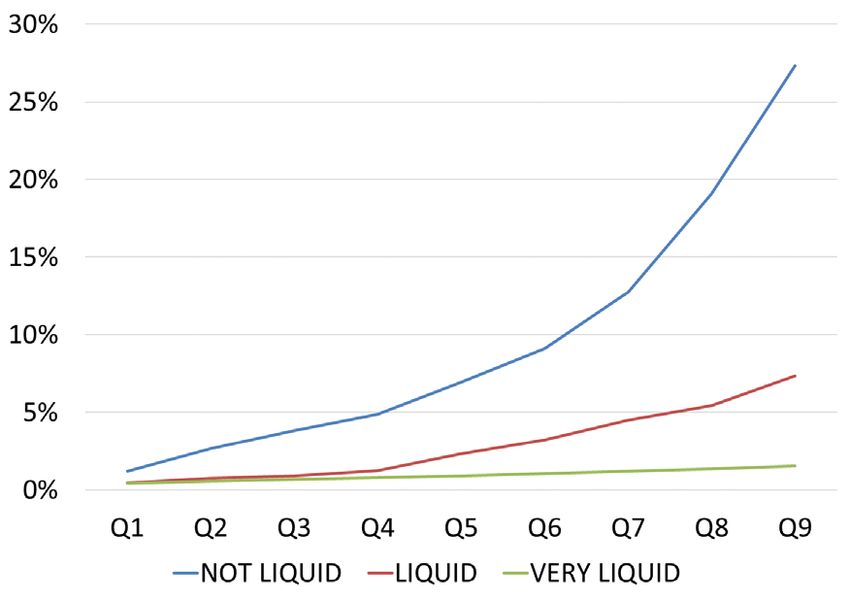
Potential changes in volume thresholds Regarding the volume limits, there are two potential solutions: a change in the exemption, or a change in the limits. Impact of a variation in the exemption on the proportion of amounts currently breaching the "ESMA limits" (level 1) or "AMF limits" (level 2) Figure 18: Change in the number of limit breaches according to the exemption amount (Base 0 = current exemption of €20,000) NB: an increase in the exemption to €25,000 could reduce the number of breaches by 41% for illiquid stocks, 16% for liquid stocks and 8% for highly liquid stocks Source: transaction reporting, AMF calculations Impact of a change in the volume limits on the number of breaches of the "ESMA limits" (level 1) Figure 19: Distribution of deviations from the ESMA Figure 20: Distribution of deviations from the volume limit – buy side (% of amounts traded) ESMA volume limit – sell side (% of amounts traded) Degré de Liquidité Q1 Q2 Q3 Q4 Q5 Q6 Q7 Q8 Q9 Liquidity_status Q1 Q2 Q3 Q4 Q5 Q6 Q7 Q8 Q9 NOT LIQUID 1,2% 2,7% 3,8% 4,9% 6,9% 9,1% 12,7% 19,1% 27,3% NOT LIQUID 1,1% 2,4% 4,3% 5,4% 7,3% 9,8% 13,5% 18,6% 27,8% LIQUID 0,4% 0,8% 0,9% 1,2% 2,3% 3,2% 4,5% 5,4% 7,4% LIQUID 0,1% 0,5% 1,1% 1,8% 2,6% 3,0% 4,7% 6,7% 9,0% VERY LIQUID 0,4% 0,6% 0,7% 0,8% 0,9% 1,1% 1,2% 1,4% 1,5% VERY LIQUID 0,0% 0,0% 0,0% 0,1% 0,3% 0,4% 1,0% 2,1% 3,0% NB: an increase in the ESMA limit by 15 percentage points for illiquid stocks (i.e. a volume limit increased to 40%) could reduce the breaches concerning amounts traded by 75% for these stocks. Source: transaction reporting, AMF calculations - 22 -
Figures 21 - 22 - 23: Impact of a change in exemption combined with a change in volume limits on the number
 of breaches of the "ESMA limits" (level 1) by liquidity segment (illiquid – liquid – highly liquid)

NB: an increase in the exemption to €25,000 combined with an increase in the ESMA limit to 30% for illiquid stocks could reduce the number of
breaches by 64%.
Source: transaction reporting, AMF calculations

The study showed that the volume trading limits as stipulated in the Decision currently in force have not
hindered the implementation of liquidity contracts concerning shares in the liquid and highly liquid
segments. However, an increase of 5 percentage points (from 15% to 20%) in the lower limit relating
to liquid shares could capture 80% of the observed breaches. As regards the limit reserved for highly
liquid shares, the benefit of raising this limit does not seem obvious.

On the other hand, the study's findings regarding breaches on illiquid shares are very different, since the
25% limit would have to be increased to 50% to capture 80% of the observed breaches. It was also noted
that the exemption had a significant impact on the shares of this segment by "absorbing" more than 60%
of trading volumes (the impact of the exemption on liquid and highly liquid shares being far less
significant).

A slight increase in the exemption from €20,000 to €25,000 together with an increase in the limit as a
percentage of turnover from 25% to 30% would make it possible to capture two-thirds of the breaches
for illiquid stocks.

 - 23 -
5.2. ANALYSIS OF PRICE BREACHES

 5.2.1. Recap of the rules on prices

In addition to the conditions concerning trading volumes, AMF Decision 2018-01 also provided for
restrictions in terms of the price limit on orders to benefit from the "safe harbour". When they concern
a buy order, these conditions are similar to those governing the transactions of an issuer implementing
a buyback programme. The price limit of buy orders should not be greater than the highest of the
following two values: the price of the last independent transaction or the highest current independent
purchase offer. A similar reasoning is applicable to sell orders.

Basically, here is what it means when an independent market participant issues a "market" sell order for
30 shares when the market configuration is as follows: 14

 Buy Sell
 Buyer Quantity Price limit Price limit Quantity Seller
 Market maker 20 99 100 20 Market maker
 Independent 10 96 Independent
 Independent 50 92 Independent

The sell order (30 shares sold at an average price of €98) is matched with the market maker's buy order
for 20 shares at €99, then with the buy order of another (independent) market participant for 10 shares
at €96. As a consequence, the last independent transaction was executed at €96 and the best
independent limit on the buy side becomes €92. Accordingly, the market maker can reposition a buy
order at €96 and the range of best limits would become 96-100.

Beyond what ESMA recommended in its points of convergence, the AMF eased this rule by providing for
the possibility for the market maker to narrow the spread, except for highly liquid shares: The price limit
may be more competitive than the limit mentioned in the preceding paragraph provided that the
corresponding order is positioned between the bid price and the ask price. Accordingly, the market
maker can reposition a buy order with a price limit exceeding €96 and strictly less than €100 if it can
provide evidence of why it considered that this possibility had to be used for implementation of the
contract and did not adversely affect the market's functioning.

Lastly, it should be stressed that it is extremely complicated to single out solely those orders whose price
limit narrowed the spread while being equal to the price of the last independent transaction. This would
require a reconstitution of the order book at the time of the inclusion of each liquidity-contract order
that narrowed the spread, in order to determine whether its price limit is or is not equal to the price of
the last independent transaction. As a consequence, the analysis considered all the orders placed by the
market maker which narrowed the spread, as stipulated by AMF market practice.

14 To simplify the presentation, we assume that there is no circuit-breaker mechanism and that the tick size is equal to €1.

 - 24 -
5.2.2. Results In order to analyse breaches of the price limits, the study covered orders positioned during the continuous market phase between the bid price and the ask price, and their impact on the market. An order entered in the order book can result in instantaneous execution, in which case the order is said to be aggressive, because it consumes liquidity. Conversely, a passive order does not result in execution at the time of its inclusion in the order book and it therefore increases the liquidity available in the order book. Figure 24: Breaches of price limits according to shares’ degree of liquidity (proportion of amounts traded) Source: transaction reporting, AMF calculations The breaches of the price limits were fairly stable irrespective of the liquidity segment, and represented 27% of the amounts traded: one-quarter for liquid stocks, one-third for illiquid stocks and 28% for highly liquid stocks. In this analysis, we should allow for the fact that the service provider may, however, in good faith, have introduced an order, passive when it was entered (i.e. providing liquidity for the order book), but which, due to a price divergence occurring in the meantime, 15 proved aggressive (i.e. consumes liquidity) once it reached the order book. We therefore classified orders in the following categories: Aggressive: when the order is completely aggressive and therefore consumes liquidity while being fully executed at the time of its inclusion in the central order book; Aggressive-passive: when it is partly aggressive but the remainder is entered in the queue of unexecuted orders in the central order book; Passive: when the order is entirely passive and provides liquidity in the order book. Moreover, some orders may also be executed partly or fully at the fixing. This effect is captured via the following categories: fixing, aggressive-fixing, 16 passive-fixing, aggressive-passive-fixing. 15 Between the time of issue of the order by the liquidity provider and the time of the order's inclusion in the central order book by the market operator. 16 Note, however, that the "aggressive-fixing" category is practically null whether or not the activity related to liquidity contracts is considered. - 25 -
In fact, regarding liquid and illiquid stocks, about 60% of the breaches of amount limits concerned wholly
passive orders, i.e. orders providing liquidity for the order book. The liquid stocks were also characterised
by a significant proportion of partially aggressive orders (aggressive-passive). In all, purely aggressive
orders, which consume liquidity, represented an amount of less than 20% of breaches of the limits for
illiquid stocks and less than 10% for liquid stocks. Compared with the total amounts of orders placed
under liquidity contracts, for illiquid stocks (less than 2%) this proportion even becomes insignificant.

Regarding highly liquid stocks, slightly more than half of the breaches resulted from partially aggressive
orders (53%) and, for 39%, purely passive orders. Note that the proportion of aggressive orders was
similar to that for liquid stocks but, by comparison with the total amounts traded under liquidity
contracts, it appeared insignificant (approximately 2%). Therefore, it seems likely that, for highly liquid
stocks, the orders placed beyond the limit were placed with the intention of improving the quoted
spreads rather than obtaining immediate execution.

 Figure 25: Breaches of price limits observed within Figure 26: Breaches of price limits observed within
 the framework of liquidity contracts (as a proportion the framework of liquidity contracts (as a
 of amounts breaching the limit) proportion of the total amounts traded under the
 liquidity contract)

Source: transaction reporting, AMF calculations

By comparison, the weight of aggressive orders in the volumes breaching the limit of the liquidity
contract appeared far higher: it varied between 40% and 50% of the amount of observed breaches of
the limit and between 30% and 40% of the total amounts traded depending on the liquidity class in
question.
 Figure 27: Breaches of price limits observed outside Figure 28: Breaches of the price limits: Breakdown
 of liquidity contracts (as a proportion of the amounts of orders not under a liquidity contract
 breaching the limits) (as a proportion of the amounts traded)

Source: transaction reporting, AMF calculations

 - 26 -
5.3. ANALYSIS OF RESOURCES

Firstly, the following analysis is based on the valuation of the portfolio of liquidity accounts (cash and
shares) as at 31 December of 2019 and 2020. Accordingly, this estimated valuation does not, strictly
speaking, reflect the amount allocated by the issuers at the time of the allocation because, on the one
hand, the transactions of the liquidity contract manager generated capital gains or losses and, on the
other hand, the value of the portfolio is closely linked to the price of the stocks held as inventory. As a
consequence, the amount of resources as established by the data provided by the investment service
providers may sometimes exceed the maximum amount of resources stipulated by the AMF's Decision,
whereas the issuers, in conjunction with the service providers, had taken the necessary measures to
allocate an initial amount complying with the AMF's Decision.
In this regard, the AMF Decision provides that the resource limits are assessed on the basis of the market
data on the date of contract signature and are re-examined at the date of the contract's expiry and its
extension. When the resources have to be reduced, the readjustment can be performed within a time
limit not exceeding six months following the extension of the contract.
It is to be noted that, based on informal discussions with the contract managers, the resource limits
stipulated by the AMF Decision were not binding to the extent of hindering satisfactory implementation
of the contracts. However, one firm stated that the stipulated absolute value cap could sometimes be
rather restrictive when the contract concerns one of the most liquid shares in the illiquid share segment.
Moreover, it was noted that the illiquid share segment was much more heterogeneous than the liquid
and highly liquid share segments. For example, the ratio between the largest and smallest market
capitalisations for shares in the illiquid segment as at 31 December 2019 was about 1,700 versus 97 for
shares in the liquid segment and 25 for those in the highly liquid segment. In terms of the average
turnover calculated over the 30 trading sessions before 31 December 2019, the difference was even
more pronounced, because the corresponding ratios were about 8 100, 98 and 8.5 respectively.
Lastly, it should be mentioned that the revision of the classification of shares in the liquid and illiquid
segments was based on the market data for year n-1 and is published only in April of year n.

 5.3.1. Illiquid share segment

As a reminder, the Decision in force stipulates that the resources allocated by an issuer in the illiquid
segment to a liquidity contract may not exceed:

 Variable "Relative" cap "Absolute" cap
 Average turnover in 30 Between 500% and 750%
 750% In any case, the amount of resources must
 trading sessions, or verified and documented
 not exceed €3m
 Between 1% and 1.5% When it is between €1m and €3m, it is
 Market capitalisation 1.50% verified and documented
 verified and documented

Based on the data collected from the 10 investment service providers managing liquidity contracts
concerning illiquid shares (283 contracts), statistical analysis of the assets booked on the issuers' liquidity
account 17 showed as follows:

17This is the sum of the exchange value of the securities booked on the liquidity account following the trading session of
31 December and the cash available on the cash account linked to the securities account.

 - 27 -
You can also read