Revelstoke 2020 COMMUNITY PROFILE REPORT - State of the Basin
←
→
Page content transcription
If your browser does not render page correctly, please read the page content below
2020 COMMUNITY PROFILE REPORT

Revelstoke
CONTENTS
Introduction .................................................................................................................................................. 1
Location ......................................................................................................................................................... 2
Demographics ............................................................................................................................................... 2
       Total Population .................................................................................................................................... 2
       Population Density ................................................................................................................................ 3
       Population Pyramid............................................................................................................................... 3
       Labour Force Population Pyramid ........................................................................................................ 3
       Population Projections .......................................................................................................................... 4
       Average Age .......................................................................................................................................... 4
Families & Households .................................................................................................................................. 5
       Family Characteristics ........................................................................................................................... 5
       Marital Status ........................................................................................................................................ 6
Mobility ......................................................................................................................................................... 6
Cultural Characteristics ................................................................................................................................. 7
       Ethnic Origin .......................................................................................................................................... 7
       Aboriginal Identity ................................................................................................................................ 7
       Language Spoken Most Often at Home ................................................................................................ 8
Infrastructure ................................................................................................................................................ 8
       Water Services ...................................................................................................................................... 8
       Sewer Services ...................................................................................................................................... 8
       Service Providers ................................................................................................................................... 8
       Landfill & Waste Management ............................................................................................................. 8
       Traffic Volumes ..................................................................................................................................... 9
       BC Transit .............................................................................................................................................. 9
Housing ....................................................................................................................................................... 10
       Dwelling Characteristics ...................................................................................................................... 10
       Residential Property Values ................................................................................................................ 11
       Household Characteristics .................................................................................................................. 11
       Housing Affordability .......................................................................................................................... 12
       Vacancy Rates ..................................................................................................................................... 12
Income ........................................................................................................................................................ 13

                                                                                                                                                                   i
Individual Income ................................................................................................................................ 13
       Source of Income ................................................................................................................................ 14
       Low Income Measure .......................................................................................................................... 15
Labour Force ............................................................................................................................................... 16
       Class of Worker & Occupations .......................................................................................................... 16
       Labour Force by Industry .................................................................................................................... 18
       Place of Work ...................................................................................................................................... 19
       Commute to Work .............................................................................................................................. 19
       Unemployment ................................................................................................................................... 19
       Labour Force Replacement Rate ......................................................................................................... 20
Education .................................................................................................................................................... 20
       Early Development Instrument ........................................................................................................... 20
       Public School Enrollment .................................................................................................................... 21
       High School Completion ...................................................................................................................... 21
       Educational Attainment ...................................................................................................................... 22
Quality of Life & Civic Engagement ............................................................................................................. 22
       Life Expectancy.................................................................................................................................... 22
       Voter Turnout ..................................................................................................................................... 22
       Crime Severity Index ........................................................................................................................... 23
       Charitable Donations .......................................................................................................................... 23
       Public Library Usage ............................................................................................................................ 24
Business ...................................................................................................................................................... 25
       Business Counts .................................................................................................................................. 25
       Business Formations ........................................................................................................................... 25
       Building Permits .................................................................................................................................. 26
       Visitor Centre Statistics ....................................................................................................................... 26
Local Government ....................................................................................................................................... 27
       Municipal Revenue and Expenses ....................................................................................................... 27
       Taxes & Charges on a Representative House ..................................................................................... 28
Environment ............................................................................................................................................... 28
       Parks & Protected Areas ..................................................................................................................... 28
       Weather & Climate ............................................................................................................................. 29
       Frost-Free Dates .................................................................................................................................. 29
       Modeled Climate Data – History & Projections .................................................................................. 30
                                                                                                                                                                ii
Gaps and Further Research ......................................................................................................................... 31
Vacancy Rates ..................................................................................................................................... 31
Public Library Usage ............................................................................................................................ 31
2021 Census ........................................................................................................................................ 31
References .................................................................................................................................................. 32
Appendix A: Data Notes .............................................................................................................................. 36
Publication Details:
Contributors: Mark Trueman, Leeza Perehudoff, Tara Howse, Robert MacQuarrie, Jayme Jones, Hannah
Dueck, Mara Mannaerts, Justin Robinson
Publication Date: May 2021
Recommended Reference: Columbia Basin Rural Development Institute. (2021). 2020 Community profile
report: Revelstoke. https://stateofthebasin.ca/reports-resources/community-profiles
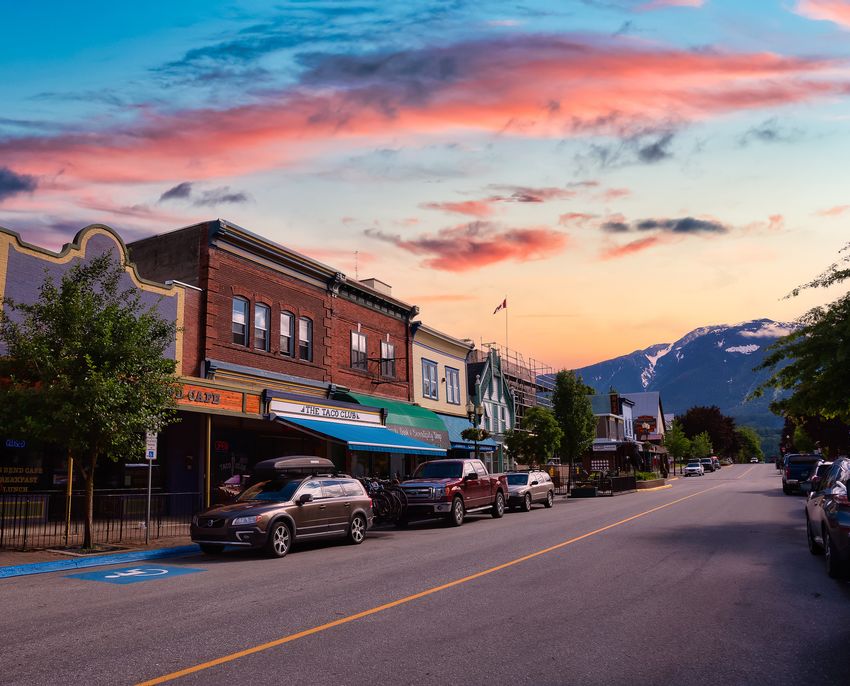
iiiIntroduction
As part of the State of the Basin program, the Columbia Basin Rural Development Institute (RDI) at Selkirk College
has developed Community Profiles for municipalities and electoral areas within the Columbia Basin-Boundary
region. The Columbia Basin-Boundary region is located in the southeast corner of British Columbia (BC) and includes
the entire Regional Districts of East Kootenay (RDEK), Central Kootenay (RDCK), Kootenay Boundary (RDKB), as well
as Golden, Revelstoke, Valemount, Columbia Shuswap Regional District (CSRD) Areas A and B, and a portion of
Regional District of Fraser-Fort George (RDFFG) Area H (see map, below). This report covers the City of Revelstoke.
The primary goal of the State of the
Basin reporting is to provide easily
accessible and relevant data to help
inform decisions that lead to greater
community and regional well-being.
State of the Basin research draws on
available data from a variety of sources
including federal, provincial, and local
governments, crown corporations, and
non-profit initiatives. Both open access
sources and custom data requests are
used.
Community profiles are intended to
share area-specific data with local
governments and other organizations
to help build a better understanding of
local conditions and trends and assist
in making evidence-based planning and
management decisions. These reports
may also be useful for supporting
communications with current
residents, prospective residents, and
for business and workforce attraction.
Indicators in this report are quantitative, and while quantitative indicators help establish foundational knowledge of
well-being, they only tell part of the story. Qualitative information, including the RDI’s subjective well-being
research, can further contribute to the understanding of our communities and region. In order to describe
geographic trends in indicators, this report compares community data with regional, provincial, and national data
where appropriate. The geographic divisions used vary by indicator and depend on the topic being measured and
the available data. For additional community and regional comparisons for indicators in this report, please see the
State of the Basin website. Further community profiles (including electoral area profiles) can be found here.
Statistics Canada also offers a suite of data sets through their Census Program, where it is possible to search by
place name and topic, and Census Mapper provides these data in mapped format. Interior Health has also
developed Community Health Profiles for municipalities across BC. The Columbia Basin Climate Source website has
area-specific climate data, including projections. BC Stats and Local Government Statistics are other online sources
of community- and area-specific statistics.
If you have questions or feedback on this Community Profile, please contact the RDI.
1Location
The City of Revelstoke1 is located on the Columbia River between the spectacular Monashee and Selkirk mountain
ranges. Heritage homes, the Victorian ambience of downtown, museums, cultural attractions, and numerous
outdoor recreation opportunities combine to make Revelstoke an unspoiled treasure in a mountain paradise. With
its rich heritage and spectacular scenery, Revelstoke has a diverse economy, including transportation, forestry, and
an ever-expanding tourism sector. See www.revelstoke.ca for more information.
Revelstoke
Regional District Columbia Shuswap
Longitude is 118°11'41"W
Coordinates
Latitude is 50°59'57"N
Elevation 480 meters
Area (km2) 41.1 km2
Demographics
Population characteristics help planners and local decision makers to evaluate current and future community needs,
particularly with respect to service delivery and potential impacts to the local economy. i,ii,iii
TOTAL POPULATION
Population (Census)3,4 2006 2011 2016 Percent change
2006 to 2016
Revelstoke 7,230 7139 7547 4.4%
Columbia Shuswap Regional District 50,141 50512 51366 2.4%
British Columbia 4,113,487 4,400,057 4,648,055 13.0%
Population Estimate5 2018 2019 2020
Revelstoke 8,164 8,471 8,744
i Please see Appendix A-1 for an important note regarding the use of random rounding in population and other demographic
data sourced from Statistics Canada.
ii The RDI recognizes that gender identity is not a binary of male and female and that some transgender, non-binary, two spirit,
and intersex populations may not be correctly represented by the data in this report. Databases that this report draws from,
such as the 2016 census, limit responses to male or female. Canada's 2021 census will include more nuanced questions on sex,
sexual orientation, and gender identity to better represent LGBTQ2IA+ populations.
iii Population estimates are usually higher than Census counts for the same year. This is due to adjustments made to reflect
those who were missed in the Census. In 2016 in BC, the population estimate was 4.1% higher than the Census count.2
2POPULATION DENSITY
Revelstoke (2016)3 Columbia-Shuswap (2016)3 British Columbia (2016)3
People per square-
183.5 1.8 5.0
kilometer
POPULATION PYRAMID
Population pyramids illustrate the age and sex structure of a population. As of 2016, 14% of the population in
Revelstoke was 65 or above, and 21% of the population was 19 or younger.3
100+
95-99
90-94
85-89
80-84
75-79 14%
70-74
65-69
60-64
55-59
50-54
45-49
40-44 65%
35-39
30-34
25-29
20-24
15-19
10-14
5-9
21%
0-4
6% 5% 4% 3% 2% 1% 0% 1% 2% 3% 4% 5%
Male Female
LABOUR FORCE POPULATION PYRAMID
The chart below shows the age range distribution of children, emerging labour force, primary labour force, and
seniors within the Revelstoke population.3
Children (0-14) 7.8% 7.9%
Emerging labour force (15-24) 5.3% 4.5%
Primary labour force (25-64) 30.9% 29.3%
Seniors (65+) 6.6% 7.4%
Male Female
3POPULATION PROJECTIONS
Population projections are available for each Local Health Area within the Columbia Basin-Boundary.6 Revelstoke is
covered by the Revelstoke Local Health Area.iv
Revelstoke Local Health Area British Columbia
Percent change in population
7% 23%
projected 2020 to 2040
AVERAGE AGE
Revelstoke (2016)3 British Columbia (2016)3
Total Male Female Total Male Female
Total population 7,545 3,830 3,715 4,648,055 2,278,245 2,369,815
Average age of population (yrs) 40.2 39.9 40.6 42.3 41.5 43.1
iv The Revelstoke Local Health Area covers the City of Revelstoke and CSRD-B.
4Families & Households
Family characteristics such as size and composition of families can help inform social, economic, health, and
education programming, as well as planning and development around infrastructure needs.3
FAMILY CHARACTERISTICS
Revelstoke (2016) Columbia-Shuswap British Columbia
(2016) (2016)
Average household size 2.3 2.2 2.4
Total number of families in private households 2,120 15,650 1,311,345
Total couple families 1,860 13,870 1,113,405
Couples without children 1,080 9,110 577,790
Couples with children 775 4,755 535,610
One child 325 2,010 221,065
Two children 355 1,960 230,705
Three or more children 95 780 83,840
Total lone-parent families 265 1,785 197,940
Female parent 190 1,365 155,670
Male parent 75 420 42,265
One child 160 1,115 125,890
Two children 80 495 54,900
Three or more children 20 170 17,145
Total persons not in census familiesv in private
1,715 9,395 882,895
households (singles)
v A “census family” is a married or common law couple (regardless of sex) and the children of either/both spouse (if any), or a
lone parent with a minimum of one child living in the same household. All members of a census family must live in the same
dwelling to be considered a census family. Children are not limited by age so long as they are living in the same household and
do not themselves have a spouse, common-law partner, or child in the same dwelling.7
5MARITAL STATUS
The chart below shows males and females who are married, living common law, single, separated, divorced or
widowed as a percent of the total Revelstoke population aged 15 years and older.3
Married 21% 21%
Living common law 8% 8%
Single (never married) 16% 11%
Separated 1% 1%
Divorced 3% 4%
Widowed 1% 4%
Male Female
Mobility
This indicator measures the movement of people into and out of the community with respect to where they lived
five years prior. Non-movers are those who have not moved. Non-migrants are people who have moved within the
same region. Migrants include those who moved within the province (intra-provincial), those who moved to or from
another province (inter-provincial), and those who moved to Canada from another country (external migrants).3
Revelstoke (2016) Columbia-Shuswap (2016) British Columbia (2016)
Non-movers 59.4% 62.4% 57.4%
Movers non-migrants 19.9% 15.0% 21.7%
Intra-provincial migrants 7.9% 13.2% 11.6%
Inter-provincial migrants 9.5% 7.8% 3.9%
External migrants 3.3% 1.5% 5.4%
6Cultural Characteristics
Cultural characteristics can enhance our understanding of a community and provide important context for other
indicators. Language, ethnic origin, and Aboriginal identityvi are a few indicators that provide insight into a region’s
cultural diversity.3
ETHNIC ORIGIN
1.2%
Oceania origins 0.8%
0.9%
4.6%
Asian origins 3.3%
28.8%
0.3%
African origins 0.6%
1.3%
0.5%
Latin; Central and South American origins 0.6%
1.5%
0.1%
Caribbean origins 0.1%
0.5%
82.4%
European origins 84.5%
62.7%
27.9%
Other North American origins 26.6%
20.2%
7.3%
North American Aboriginal origins 8.6%
6.6%
Percentage of Residents
Revelstoke Columbia-Shuswap British Columbia
ABORIGINAL IDENTITY
7.3%
5.9%
5.5%
3.8% 3.7%
3.3% 3.3%
2.1%
2.0%
0.1% 0.1% 0.0% 0.1% 0.2% 0.1%
Aboriginal identity First Nations Métis Inuk (Inuit) Multiple Aboriginal
Revelstoke Columbia-Shuswap British Columbia
vi
Calculations performed using the published estimated total population. The sum of the ethnic groups is greater than the total
because a person may report more than one ethnic origin in the census. For additional information, refer to Ethnic Origin
Reference Guide, Census of Population, 2016
7LANGUAGE SPOKEN MOST OFTEN AT HOME
Revelstoke (2016) Columbia-Shuswap (2016) British Columbia (2016)
English 95.9% 97.6% 83.2%
French 1.6% 0.6% 0.4%
Non-official languages 2.5% 1.8% 16.4%
Infrastructure
Infrastructure is the physical foundation for community well-being. Water, sewer, utilities, roads, and waste
management are all critical for a functioning healthy municipality.
WATER SERVICES
Provider City of Revelstoke
Average per capita demand (2015)8 706 L/capita/day *
Annual residential water flat rate (excluding Big Eddy)(2020)9 $490
* For comparison, average per capita demand for BC is 503 liters (2017)10
SEWER SERVICES
Provider City of Revelstoke
Type of treatment Secondary
Annual sewer flat rate (2020) (residential)11 $345
Annual sewer flat rate (2020) (industrial/commercial/institutional)11 varies by type
SERVICE PROVIDERS
Electric power12 BC Hydro
Natural gas13 N/A
Telecommunications14 Telus, Xplornet, Bell, Rogers, Shaw
LANDFILL & WASTE MANAGEMENT
Landfill location(s)15 Revelstoke Transfer Station
Regional District municipal solid waste disposal rate (2018)16 730 kg/person/year*
Type of service17 Curbside garbage and recycling
pick-up
* For comparison, average per capita waste disposal rate for BC is 505 kg/person/year (2018)18
8TRAFFIC VOLUMES
Traffic volume data are taken from traffic count stations within, or routes that directly enter, the municipality.
Permanent count stations are reported when available. When permanent count stations are not available, numbers
from short count stations are reported.vii,19
Station location Annual Average Annual Average Monthly Average Monthly Average
Daily Traffic Daily Traffic Daily Traffic Daily Traffic
(2019) (2018-10-23) (2019) (2019)
(number of (number of January July
vehicles) vehicles)
Twin Slides, Route 1, approx.
47 km east of Revelstoke (P- 5,612 N/A 3,213 N/A
37-4EW) (Permanent)
Route 1, 500 metres east of
Route 23 North, Revelstoke N/A 5,505 N/A N/A
(38-011EW) (Short Count)
BC TRANSIT
Revelstoke is serviced by BC Transit’s Revelstoke Transit System. This system includes four fixed-routes. In addition,
there is door to door handyDART service to assist people with permanent or temporary disabilities. Two Health
Connection routes connect Revelstoke—Kamloops, and Revelstoke—Kelowna to provide transportation to non-
emergency medical appointments. These routes are offered through a partnership between Interior Health
Authority, the City of Revelstoke, and BC Transit. For more information on how Revelstoke is serviced by the BC
transit system, visit https://www.bctransit.com/revelstoke/home
vii
Traffic volumes are monitored continuously at permanent count stations, and over a minimum of 48-hour period every three years at short
count stations.
9Housing
Housing stock, diversity, availability, and costs are an important basic foundation of functioning and affordable
communities. Several indicators related to housing are included in this community profile.
DWELLING CHARACTERISTICS
Dwellings by Structure3 Revelstoke (2016) Columbia-Shuswap British Columbia
(2016) (2016)
Total number of occupied private dwellings 3250 22,455 1,881,970
Single-detached house 2045 15,880 830,660
Apartment in a building that has 5 or more
5 20 177,830
storeys
Other attached dwelling 720 4,170 824,190
Semi-detached house 140 590 57,395
Row house 105 875 147,830
Apartment or flat in duplex 75 920 230,075
Apartment in a building that has fewer
395 1,680 385,140
than 5 storeys
Other single-attached house 10 100 3,755
Movable dwelling 480 2,390 49,290
Dwellings by Period of Construction3 Revelstoke (2016) Columbia-Shuswap British Columbia
(2016) (2016)
Total number of occupied private dwellings 3,250 22,455 1,881,970
1960 or before 840 2,700 267,560
1961 to 1980 1,430 7,980 559,485
1981 to 1990 305 2,810 289,565
1991 to 2000 285 4,405 331,865
2001 to 2005 60 1,345 125,335
2006 to 2010 165 2,060 171,945
2011 to 2016 170 1,145 136,210
Private dwellings in need of major repairs 7.5% 7.0% 6.3%
10RESIDENTIAL PROPERTY VALUES
Revelstoke Single- 2020 2021 % Change Columbia Basin-
Family Residential Boundary (2021)
Property Value20
Median assessed
$533,000 $575,000 8% $352,100
valueviii
% of Single-Family Residential Revelstoke Columbia Basin-Boundary (2021)
Dwellings in Different Value Categories (2021)
Number of single-family dwellings 2,537 57,830
$0 to $99,999 0.2% 4.1%
$100,000 to $199,999 0.5% 11.3%
$200,000 to $299,999 3.4% 21.1%
$300,000 to $399,999 9.8% 23.7%
$400,000 to $499,999 18.2% 16.3%
$500,000 to $599,999 24.2% 9.8%
$600,000 and over 43.8% 13.7%
HOUSEHOLD CHARACTERISTICS
Household Occupation3 Revelstoke Columbia-Shuswap British Columbia
(2016) (2016) (2016)
Total private dwellings 3,531 29,798 2,063,417
Private dwellings occupied by usual
92.1% 75.4% 91.2%
residents
*“Private dwelling occupied by usual residents” refers to a private dwelling in which a person or a group of persons is permanently residing.
Private Households by Tenure3 Revelstoke Columbia-Shuswap British Columbia
(2016) (2016) (2016)
Private households who are owners 73.1% 79.7% 68.0%
Private households who are renters 26.7% 20.2% 31.8%
Private households in band housing 0.0% 0.2% 0.2%
viii Assessed value as of the July 1 of the previous year. Ex: 2020 assessed value as of July 1, 2019.
11HOUSING AFFORDABILITY
Housing is considered unaffordable when more than 30% of a household’s income is spent on shelter costs. Shelter
costs include electricity, oil, gas, wood, or other fuels, water and other municipal services, mortgage payments,
property taxes, condominium fees, and rent.ix, 3
43% 43%
41%
Percentage of residents in
unaffordable housing
21%
17% 16%
Owners Tenants
Revelstoke Columbia-Shuswap British Columbia
VACANCY RATES
Vacancy rates are an important indicator of the availability of affordable housing. A balanced vacancy rate is 3%.21, x
1.4% 1.4%
1.3%
Vacancy rate (%)
0.4% 0.4% 0.4%
2016 2017 2018
Revelstoke British Columbia
ix Please see Appendix A-2 for limitations of Statistics Canada’s shelter-cost-to-income ratio calculations.
x CMHC is no longer collecting data for small municipalities; current data are only available for Nelson and Cranbrook.
12Income
Income is a substantial determinant of personal well-being and income levels reflect economic opportunity.
INDIVIDUAL INCOME
After-tax individual Revelstoke Columbia-Shuswap British Columbia
income22,23
(2018)xi (2018) (2018)
Number Percent Number Percent Number Percent
Under $5,000 390 5.4% 2,340 5.3% 273,160 7.2%
$5,000 to $9,999 340 4.7% 2,290 5.2% 210,040 5.5%
$10,000 to $14,999 490 6.7% 3,530 8.1% 300,860 7.9%
$15,000 to $19,999 570 7.9% 4,170 9.5% 342,760 9.0%
$20,000 to $24,999 650 9.0% 4,530 10.3% 333,430 8.8%
$25,000 to $34,999 1,220 16.8% 7,450 17.0% 541,660 14.2%
$35,000 to $49,999 1,440 19.8% 8,050 18.4% 680,440 17.9%
$50,000 to $74,999 1,320 18.2% 7,320 16.7% 647,200 17.0%
$75,000 to $99,999 570 7.9% 2,660 6.1% 274,600 7.2%
$100,000 to $149,999 240 3.3% 1,200 2.7% 142,420 3.7%
$150,000 to $199,000 x x 180 0.4% 32,590 0.9%
$200,000 to $249,999 x x 60 0.1% 11,480 0.3%
$250,000 and over x x 60 0.1% 15,680 0.4%
Median $38,300 $34,170 $36,100
Average $66,897 $48,196 $50,016
xiNote: ‘x’ designates that for reliability or confidentiality purposes, data is not published
13SOURCE OF INCOME
Source of income data can provide insight into the general income structure of a population.24
Source of Income (2018) Revelstoke Columbia-Shuswap British Columbia
(% tax filers) (% tax filers) (% tax filers)
Employment income 80.0% 69.6% 73.6%
Self-employment income 12.6% 13.7% 12.7%
Investment income 29.9% 34.4% 34.2%
Employment insurance 13.1% 10.4% 6.5%
Old Age Security / Net Federal Supplement 15.9% 29.1% 22.1%
Canada Pension Plan/Quebec Pension Plan 21.7% 36.7% 26.7%
Canada Child Tax Benefit 12.0% 11.0% 11.8%
GST/HST credit 31.9% 32.6% 34.3%
Workers compensation 3.3% 3.2% 2.6%
Social assistance 2.5% 3.8% 5.1%
Provincial Refundable Tax Credits/Family Benefits 35.2% 35.8% 37.2%
Other Government Transfers 7.9% 6.4% 6.3%
Private pensions 14.1% 22.7% 16.9%
RRSP 1.4% 2.3% 1.7%
Other income 18.9% 22.2% 22.3%
14LOW INCOME MEASURE
The Low Income Measure (LIM) is a commonly used, internationally comparable measure of low income. The LIM
threshold is 50% of median national adjusted after tax-income, where 'adjusted' means household size is taken into
account. A person is considered to be in low income when their after-tax income is below the LIM threshold for their
household size.xii,25
The table and chart below provide a comparison by age bracket and year-to-year total population of persons with
low-income in Revelstoke, regional district, and BC.26,27,28,29,30
Percent of Individuals with Low Income Revelstoke Columbia-Shuswap British Columbia
(2018) (2018) (2018)
0-17 years old 11.1% 17.9% 18.5%
18-64 years old 13.0% 15.4% 18.0%
65+ years old 10.3% 11.9% 18.2%
All Ages 12.3% 15.0% 18.1%
25%
Percent low income individuals
20%
15%
10%
5%
0%
2014 2015 2016 2017 2018
Revelstoke Columbia-Shuswap British Columbia
xii In 2018, Statistics Canada introduced a new methodology for calculating the LIM threshold, which allows for individual
economic well-being to be analyzed (in comparison, previous calculations considered the entire household as a single unit with
the assumption of an equitable distribution of resources).25 Data represented here uses the new methodology, and for that
reason, cannot be compared with previous State of the Basin analyses of Low Income Measure.
15Labour Force
CLASS OF WORKER & OCCUPATIONS
This indicator gives an overview of the make-up of the local workforce and industries.3 The pie charts show the
percentage of the employed labour force who are self-employed versus those who are employed by others. The
tables provide numbers and percentages of the labour force in specific occupations for Revelstoke, the regional
district, and BC.xiii
Revelstoke (2016)
% Self-employed v. % Employees Occupation Number of Percent
persons
Sales and services 1,085 24.6%
Self- Trades, transport and equipment
1,015 23.0%
employed operators and related
12%
Business, finance and admin 430 9.7%
Management 415 9.4%
Education, law and social, community
360 8.2%
and government
Employee Health 245 5.5%
88%
Natural and applied sciences 320 7.2%
Natural resources, agriculture and
185 4.2%
related production
Manufacturing and utilities 195 4.4%
Art, culture, recreation and sport 135 3.1%
xiii
The labour force includes persons aged 15 and older, employed or unemployed.31 Occupation is determined by the kind of
work done and descriptions of the main activities in the job.32
16Columbia-Shuswap (2016)
% Self-employed v. % Employees Occupation Number of Percent
persons
Sales and services 6,325 24.9%
Trades, transport and equipment
Self- 5,180 20.4%
operators and related
employed
18% Business, finance and admin 2,790 11.0%
Management 2,910 11.5%
Education, law and social, community
2,030 8.0%
and government
Employee
82% Health 1,525 6.0%
Natural and applied sciences 1,275 5.0%
Natural resources, agriculture and
1,320 5.2%
related production
Manufacturing and utilities 1,115 4.4%
Art, culture, recreation and sport 640 2.5%
British Columbia (2016)
% Self-employed v. % Employees Occupation Number of Percent
persons
Sales and services 595,225 24.1%
Trades, transport and equipment
Self- 360,970 14.6%
employed operators and related
14% Business, finance and admin 368,940 14.9%
Management 275,000 11.1%
Education, law and social, community
269,255 10.9%
and government
Employees
86% Health 162,865 6.6%
Natural and applied sciences 161,520 6.5%
Natural resources, agriculture and
64,235 2.6%
related production
Manufacturing and utilities 76,745 3.1%
Art, culture, recreation and sport 93,100 3.8%
17LABOUR FORCE BY INDUSTRY
Industry3 Revelstoke Columbia-Shuswap British Columbia
(2016) (2016) (2016)
Accommodation and food services 15.1% 10.0% 8.4%
Construction 9.6% 11.1% 8.1%
Health care and social assistance 9.3% 9.3% 11.0%
Transportation and warehousing 9.2% 5.7% 5.2%
Retail trade 8.8% 12.3% 11.5%
Manufacturing 7.8% 8.8% 6.4%
Arts; entertainment and recreation 7.8% 4.3% 2.3%
Educational services 5.8% 5.3% 7.0%
Professional; scientific and technical services 4.4% 4.4% 8.0%
Public administration 4.3% 3.6% 5.1%
Other services (except public administration) 3.9% 4.6% 4.5%
Agriculture; forestry; fishing and hunting 3.3% 5.5% 2.6%
Administrative and support; waste
3.2% 4.4% 4.4%
management and remediation services
Finance and insurance 1.8% 2.3% 3.8%
Utilities 1.4% 0.6% 0.5%
Mining; quarrying; and oil and gas extraction 1.1% 2.0% 1.0%
Real estate and rental and leasing 1.1% 2.3% 2.2%
Information and cultural industries 0.9% 1.0% 2.7%
Wholesale trade 0.6% 1.6% 3.3%
Management of companies and enterprises 0.0% 0.0% 0.2%
18PLACE OF WORK
Place3 Revelstoke Columbia-Shuswap British Columbia
(2016) (2016) (2016)
Number Percent Number Percent Number Percent
Worked at home 240 6.0% 2,280 9.9% 196,510 8.5%
Worked outside Canada 0 0.0% 45 0.2% 16,040 0.7%
No fixed workplace address 680 16.9% 4,010 17.4% 326,180 14.1%
Worked at usual placexiv 3,110 77.2% 16,780 72.6% 1,766,965 76.6%
COMMUTE TO WORK
Commute Duration xv,3 Revelstoke Columbia-Shuswap British Columbia
(2016) (2016) (2016)
Less than 15 minutes 75.2% 55.7% 28.8%
15 to 29 minutes 13.6% 23.6% 32.9%
30 to 44 minutes 3.4% 9.8% 20.3%
45 to 59 minutes 1.6% 3.5% 8.8%
60 minutes or more 6.2% 7.4% 9.1%
UNEMPLOYMENT
Unemployment rates are a strong indicator of economic health. Unemployment rates based on the 2016 Census are
shown.3 Labour Force Survey data at the economic development region level are updated more frequently and can
be found in the State of the Basin Unemployment indicator.
Unemployment Rate Revelstoke Columbia-Shuswap British Columbia
(2016) (2016) (2016)
Total 8.5% 9.0% 6.7%
Male 9.9% 10.6% 7.1%
Female 7.1% 7.2% 6.3%
xiv“Usual place” means working at a specific address and reporting to the same workplace location at the beginning of each
shift.33
xv Total used in calculations is the employed labour force aged 15 years and over in private households with a usual place of
work or no fixed workplace.34
19LABOUR FORCE REPLACEMENT RATE
The Labour Force Replacement Rate is a measure of the number of people who will be entering vs. leaving the
workforce in the next 15 years. For the purpose of this measurement, those considered to be entering the
workforce are members of the population aged 0-14, and those leaving are those aged 50-64. A rate of 1.0 means
the child and retiree populations are the same. A rate of less than 1.0 means an area is likely unable to maintain the
current labour force with local replacement workers.3
Revelstoke Columbia-Shuswap British Columbia
(2016) (2016) (2016)
Labour Force Replacement Rate 0.74 0.52 0.67
Education
EARLY DEVELOPMENT INSTRUMENT
The early years are crucial in influencing a range of health and social outcomes. Research shows that many
challenges in adults, including mental health and criminality, have their roots in early childhood. The Early
Development Instrument (EDI) assesses the developmental readiness of children in five core areas. These are:
physical health and well-being, social competence, emotional maturity, language and cognitive development, and
communication skills and general knowledge.xvi The EDI is used to assess the percentages of vulnerable children in
each core area. Children are categorized as “vulnerable” when it is believed that they will need additional support in
order to avoid future challenges in school and society. Data are available at the school district or neighbourhood
level.
The chart below shows the percentage of children vulnerable in each core area, as well as the percentage of
children vulnerable in one or more core areas, for the Revelstoke neighbourhood.xvii Percentages for the province as
a whole are shown for comparison. These data are from the most recent wave (Wave 8) of data collection, which
took place in 2019/20.35
Vulnerable children (%)
33.4%
25.3%
17.7%
15.8% 15.4% 16.1% 14.3%
11.6% 10.6%
9.5% 8.4%
7.4%
Physical Social Emotional Language Communication One or More
Core Area
Revelstoke British Columbia
xvi For more information on what is measured within each core area, see Appendix A-3.
xvii The Revelstoke neighbourhood covers the City of Revelstoke.
20The chart below shows the trend over EDI collection periods for the Revelstoke neighbourhood.
25.3%
Vunerable children (%)
12.0% 10.1% 10.9% 12.6%
6.7% 9.2%
Wave 2 Wave 3 Wave 4 Wave 5 Wave 6 Wave 7 Wave 8 Yr 1
(2004-2007) (2007-2009) (2009-2011) (2011-2013) (2013-2016) (2016-2019) (2019-2020)
Core Area: One or More
Revelstoke
PUBLIC SCHOOL ENROLLMENT
Revelstoke falls within the Revelstoke School District (#19).xviii Student enrollment measures the number of all
school-age persons and adults who are enrolled in public schools and working towards high school graduation.
Enrollment trends provide information about changes in the school-age population and is valuable for forecasting
and planning.xix 36
Revelstoke (SD 19) 2016/17 2017/18 2018/19 2019/20 2020/21
Total student enrollment 974 987 1045 1020 1015
Elementary student enrollment 591 602 646 623 635
Secondary school enrollment 383 385 399 397 380
Indigenous students 161 155 148 115 116
English language learners 26 27 44 37 48
French immersion Mask Mask Mask Mask Mask
Non-residents 20 21 22 25 Mask
* Differences between total and elementary and secondary enrollments are due to a small number of enrolled adults
HIGH SCHOOL COMPLETION
High school completion rates indicate how successful our families, schools, and communities are in supporting
youth in achieving graduation. This indicator measures the proportion of students who graduate high school within
six years of the first time they enroll in grade 8.37 High school graduation is generally a minimum education level for
most employment and a foundation for positive workplace conditions and future employment success.
2015/2016 2016/2017 2017/2018 2018/2019 2019/2020
Revelstoke (SD 19) 89.6% 98.7% 84.4% 85.7% 95.1%
All BC Public Schools 86.8% 87.3% 88.5% 88.8% 89.6%
xviiiTheRevelstoke school district covers multiple municipalities and electoral areas, therefore numbers reported reflect the full
school district and are not limited to Revelstoke.
xix Due to revisions in 2020 to the Ministry of Education's Protection of Personal Information when Reporting on Small
Populations policy, data masking occurs when any cells have fewer than 10 observations, even if the summed total for a
category exceeds 10. This impacts reporting enrollment past the 2019/20 school year on categories with lower numbers such as
French immersion.
21EDUCATIONAL ATTAINMENT
Education levels are highly correlated with social determinants of health such as income, employment security, and
socio-economic opportunity. This indicator measures the highest level of attainment of people aged 25 to 64 years
(2016).3
University certificate; diploma or degree at bachelor level or 21.8%
15.5%
above 29.9%
3.9%
University certificate or diploma below bachelor level 3.6%
3.9%
College; CEGEP or other non-university certificate or 21.3%
23.7%
diploma 20.9%
17.0%
Apprenticeship or trades certificate or diploma 15.4%
9.1%
64.0%
Postsecondary certificate; diploma or degree 58.3%
63.9%
26.7%
Secondary (high) school diploma or equivalency certificate 29.9%
26.5%
9.3%
No certificate; diploma or degree 11.8%
9.6%
Revelstoke CSRD British Columbia
Quality of Life & Civic Engagement
LIFE EXPECTANCY
Life expectancy is a widely used indicator of population health. This indicator reports on the number of years a
person is expected to live based on mortality statistics for a Local Health Area (LHA).38 Revelstoke is covered by the
Revelstoke Local Health Area.
Life Expectancy
2015-2019 Average
Revelstoke Local Health Area 83.3
British Columbia 82.7
VOTER TURNOUT
Voter turnout is an indicator of resident involvement in politics and can be seen as a reflection of civic mindedness
and citizen engagement. This indicator measures the percentage of eligible voters who voted in local elections.39
2008 2011 2014 2018
Revelstoke 48.0% 35.4% 56.2% 45.3%
Columbia Basin-Boundary average 41.5% 36.7% 44.5% 44.0%
22CRIME SEVERITY INDEX
Crime rates are a common indicator of public safety. The police reported Crime Severity Index (CSI)40 includes all
Criminal Code violations including traffic, as well as drug violations and all Federal Statutes. It measures the volume
and severity of police-reported crime.xx
120
100
Crime Severity Index
80
60
40
20
0
2010 2011 2012 2013 2014 2015 2016 2017 2018 2019
Revelstoke (municipal) British Columbia
CHARITABLE DONATIONS
Charitable donations play a role in improving well-being by providing support to a variety of initiatives. Charitable
giving reflects a capacity to give, and is tied to the economy, in that people may give more or less depending on
their financial situation and the state of the economy.41
Revelstoke Columbia-Shuswap British Columbia Canada
(2018) (2018) (2018) (2018)
Total # of tax-filers 7,010 42,670 3,702,970 27,394,970
Total charitable donors 1,010 7,040 683,150 5,324,280
Percent charitable donors 14.4% 16.5% 18.4% 19.4%
Total charitable donations ($’000) $1,345 $12,105 $1,758,810 $9,952,505
Median donation $380 $430 $470 $310
Median income $58,490 $53,280 $62,360 $61,940
xxDue to the small population in rural communities, the CSI can change dramatically from year to year due to a small amount of
crime. Data for police services with populations less than 5,000 should be used with caution.
23PUBLIC LIBRARY USAGE
Libraries play an important role in the vibrancy of a community, as libraries are often a gathering place for residents
where a diversity of programs and services are offered. Library statistics are useful for providing an indication of the
health and capacity of these facilities in serving community needs and interests.42,43
Revelstoke Public Average all libraries in
Library Columbia Basin-Boundary
(2019)* (2019)*
Population served N/A 7,489
Total active cardholders as % of population served N/A 35.9%
Attendance at children’s and young adult programs N/A 3,004
Total full-time equivalent employees (FTE) N/A 3.8
Volunteer hours worked N/A 1144.2
Number of in-person visits 73,922 47,324
Total visits per capita N/A 9.9
Average hours open per week N/A 40.3
Total local government support N/A 265,314
Local government support per capita N/A 36.4
Total other revenue N/A 48,960
*Columbia Basin-Boundary averages do not include the Golden or Revelstoke libraries, as these branches are part of the Okanagan Regional
Library and comprehensive data by branch are not available. See Gaps and Further Research for more information.
24Business
BUSINESS COUNTS
Trends in the number of businesses within a region is an indicator of economic health.44 In the chart below, “total”
refers to total number of businesses both with and without employees, and “with employees” refers only to those
businesses that have employees other than the owner.
2,500
2010-2020 Change
Total 38.3%
2,000
Business counts (#)
With employees 17.9%
1,500
2015-2020 Change
1,000 Total 8.6%
500 With employees 12.3%
0
2019-2020 Change
2008 2009 2010 2011 2012 2013 2014 2015 2016 2017 2018 2019 2020 Total 1.0%
Total With Employees With employees 0.6%
BUSINESS FORMATIONS
The number of business incorporations is an indicator of the overall business climate, providing a sense of an
expanding or contracting economy.45
Year Revelstoke Columbia-Shuswap British Columbia
2016 46 264 43,556
2017 70 289 46,247
2018 73 295 46,245
2019 66 285 44,657
2020 87 315 47,789
25BUILDING PERMITS
This indicator measures the building permit construction value issued annually by a defined region. Building permits
are a well-accepted indicator of economic performance. Values below are reported in thousands.xxi
Year Revelstoke46 Columbia-Shuswap 47 British Columbia46
($’000) ($’000) ($’000)
2015 $15,042 $6,932 $12,971,649
2016 N/A $8,203 $12,492,196
2017 $30,300 $7,609 $14,668,692
2018 $19,902 $16,946 $18,361,550
2019 $56,561 $40,336 $23,044,653
VISITOR CENTRE STATISTICS
Visitor Centre Statistics are a common indicator of tourism, an economic sector for many regions. Numbers for the
Revelstoke Visitor Center have been provided below.48
Year Total Visitors Change from previous year Change for all visitor centres in
Revelstoke Visitor Centre Revelstoke BC
2016 53,039 20.3% 0.6%
2017 57,626 8.6% -2.6%
2018 60,831 5.6% -8.2%
2019 60,338 -0.8% 10.6%
2020 18,744 -68.9% -70.1%
xxi Building permit data source has shifted from BC Stats to Local Government Statistics based on data availability, so caution
should be used when comparing results from this community profile to previous profiles. Regional district totals do not include
municipalities with their own building inspection services. For the Columbia Shuswap Regional District, these municipalities are:
Revelstoke and Sicamous.
26Local Government
Local governments are required to submit data annually to the BC Ministry of Municipal Affairs and Housing,
including annual reports and financial statements. Municipal revenues and expenses and taxes on a representative
housexxii provide an indication of a local government’s capacity, financial needs and priorities, and costs to residents.
MUNICIPAL REVENUE AND EXPENSES
Municipal Revenue49 Revelstoke (2019) Percent of Total Revenue
Total Own Purpose Taxation and Grants in Lieu $16,234,424 54.8%
Sale of Services $6,285,472 21.2%
Transfers from Federal Governments $0 0.0%
Transfers from Provincial Governments $3,990,051 13.5%
Transfers from Regional and Other Governments $1,774,396 6.0%
Investment Income $1,143,429 3.9%
Income from Government Business Enterprise -$47,735 -0.2%
Developer Contributions $218,785 0.7%
Disposition of Assets $0 0.0%
Other Revenue $0 0.0%
Total Revenue $29,598,822
Municipal Expenses50 Revelstoke (2019) Percent of Total Expenses
General Government $2,266,136 9.8%
Protective Services $4,185,340 18.0%
Solid Waste Management and Recycling $388,517 1.7%
Health, Social Services and Housing $625,560 2.7%
Development Services $841,839 3.6%
Transportation and Transit $5,453,280 23.5%
Parks, Recreation and Culture $3,370,599 14.5%
Water Services $1,261,457 5.4%
Sewer Services $698,877 3.0%
Other Services $1,738,602 7.5%
Amortization $2,360,738 10.2%
Other Adjustments $0 0.0%
Total Expenses $23,190,945
xxii
A representative house is based on the assessment and occurrence of single-family residential properties, and does not
include vacant properties, multi-family, strata, etc.
27TAXES & CHARGES ON A REPRESENTATIVE HOUSE
Representative House51 Revelstoke (2020)
House value $495,477
School $816
General Municipal Total $1,836
Regional District $129
Hospital $177
BCA, MFA, and other $21
Total Residential Variable Rate Taxes $2,979
Total Residential Parcel Taxes $150
Total Residential User Fees $957
Total Residential Property Taxes and Charges $4,086
Environment
The environment is a foundation for many aspects of well-being. Parks and protected areas help to safeguard wild
spaces and species and provide opportunity for residents and visitors to recreate and connect with nature. Weather
and climate conditions and trends help us understand the context in which a community operates, and climate
projections can help with forecasting and adaptive planning.
PARKS & PROTECTED AREAS
Revelstoke has 2 national parks as well as 5 provincial parks and protected areas within a 40-kilometer radius of the
municipality. It also has at least 11 local parks and greenspaces which intersect its boundaries.52
Revelstoke
National & provincial parks and Mount Revelstoke National Park English Lake Park
protected areas Glacier National Park Martha Creek Park
Blanket Creek Park Monashee Park
Greenbush Lake Protected Area
Local greenspaces Beruschi Park Moberly Manor Park
Big Eddy Park Moose Park
Centennial Park Queen Elizabeth Park
Farwell Park Williamson's Lake Campground
Greenbelt Park Woodenhead Park
Kovach Park
28WEATHER & CLIMATE
Weather and climate data are based on the Government of Canada’s 1981-2010 Climate Normals and Averages.xxiii
The numbers presented below are from the Revelstoke Airport weather station.54xxiv
January (Year of Occurrence) July (Year of Occurrence)
Daily average (°C) -5.3 18.2
Daily maximum (°C) -2.2 25.3
Daily minimum (°C) -8.2 11.1
Extreme maximum (°C) 11.7 (1974) 37.2 (1994)
Extreme minimum (°C) -29.4 (1970) 3.9 (1972)
Rainfall monthly average (mm) 17.9 65
Snowfall monthly average (cm) 123.7 0
Extreme daily rainfall (mm) 30.2 (1971) 37.8 (1983)
Extreme daily snowfall (cm) 52.3 (1972) 0
Extreme snow depth (cm) 150 (1972) 0
FROST-FREE DATES
Frost-free dates are based on data fromRevelstoke.55,xxv,
Average Date of Last Average Date of First Fall Average Length of Frost-
Spring Frost Frost Free Period
Frost-free dates May 03 October 01 148 Days
xxiiiThe terms “climate normals” and “climate averages” are interchangeable, and refer to numbers based on observed climate
values for a specific location over a specific time frame.53
xxiv Climate normals for Revelstoke Airport are based on data from 1970-2000. All other community profiles use data from 1981-
2010. Caution should be used when comparing Revelstoke climate normals with other community profiles.
xxv Caution should be used when comparing frost free dates between community profiles. Cranbrook, Radium Hot Springs,
Invermere, Fernie, Revelstoke, and Valemount data is taken from Climate Atlas of Canada56 which calculates frost free dates
based on data from 1976-2005. All other profiles use data from The Government of Canada climate normals and averages54
which calculate frost free dates based on data from 1981-2010.
29MODELED CLIMATE DATA – HISTORY & PROJECTIONS
Climate data were modeled across the Columbia Basin-Boundary on a scale consisting of a 10x10 km grid. The
figures below show median values from the results of 12 climate models for each time period and for low carbon
and high carbon emission scenarios for the grid closest to Revelstoke.57 Low carbon scenarios assume global
greenhouse gas emissions will be drastically reduced from current levels, while high carbon scenarios assume
greenhouse gas emissions will continue increasing at current rates. For more area-specific climate data, visit the
Columbia Basin Climate Source website.
Variable Recent Past Near Future Far Future
(1951 - 1980) (2021 - 2050) (2051 - 2080)
Low Carbon High Carbon Low Carbon High Carbon
Annual
6.6 °C 8.3 °C 8.8 °C 9.5 °C 10.6 °C
mean temperature
Annual
871 mm 929 mm 921 mm 935 mm 954 mm
total precipitation
30Gaps and Further Research
During the compilation of data for these community profiles, a number of gaps and opportunities for further
research were identified. These are discussed below.
VACANCY RATES
These results come from the Canada Mortgage and Housing Corporation’s (CMHC) annual Rental Market Surveys.
As some communities have very small rental markets, information for some municipalities is suppressed for
confidentiality reasons. CMHC is no longer collecting data for small municipalities; therefore, current data are only
available for Nelson and Cranbrook.
PUBLIC LIBRARY USAGE
The Okanagan Regional Library (ORL) system does not provide individualized data by branch with the exception of in
person visits and circulation. The Town of Golden and City of Revelstoke branches are part of the ORL and have not
been included in the Columbia Basin-Boundary averages.
2021 CENSUS
The 2021 Census of Population occurs in May 2021. The information collected during the census is vital for rural
community development and planning. Data is collected about demographics, and well as social and economic well-
being.58 Beginning May 3, 2021, Canadians can complete the census questionnaire online, and doing so follows
COVID-19 restrictions while fulfilling the obligation of completing the census.
31References
1. City of Revelstoke. (n.d.). Home. https://revelstoke.ca/
2. BC Ministry of Citizens’ Services. (2020). About population estimates.
https://www2.gov.bc.ca/gov/content/data/statistics/people-population-
community/population/population-estimates/about-population-estimates
3. Statistics Canada. (2020). Census Profile, 2016 Census. https://www12.statcan.gc.ca/census-
recensement/2016/dp-pd/prof/index.cfm?Lang=E
4. Statistics Canada. (2016). Census Profile, 2006 Census. https://www12.statcan.gc.ca/census-
recensement/2006/dp-pd/index-eng.cfm
5. BC Ministry of Citizens’ Services. (n.d.). Population estimates.
https://www2.gov.bc.ca/gov/content/data/statistics/people-population-
community/population/population-estimates
6. BC Ministry of Citizens’ Services. (n.d.). Population projections.
https://www2.gov.bc.ca/gov/content/data/statistics/people-population-
community/population/population-projections
7. Statistics Canada. (2019). Census Family. https://www23.statcan.gc.ca/imdb/p3Var.pl?Function=Unit&Id=32746
8. Columbia Basin Water Smart Program. (2016). Water Smart 2015 [custom data request].
9. City of Revelstoke. (2020). City of Revelstoke Fees and Charges Bylaw Shedules 2020- Water.
http://revelstoke.ca/DocumentCenter/View/6374/2020-Fees--Charges-Bylaw-Schedules---Water?bidId=
10. Statistics Canada. (2021). Potable water use by sector and average daily use.
https://www150.statcan.gc.ca/t1/tbl1/en/tv.action?pid=3810027101
11. City of Revelstoke. (2020). City of Revelstoke Fees and Charges Bylaw Shedules 2020- Sewer.
http://revelstoke.ca/DocumentCenter/View/6373/2020-Fees--Charges-Bylaw-Schedules---Sewer?bidId=
12. BC Hydro. (n.d.). Our Service Areas. https://www.bchydro.com/content/dam/BCHydro/customer-
portal/documents/corporate/safety/bchydro-service-area-map.pdf
13. FortisBC. (n.d.). Our service areas. https://www.fortisbc.com/about-us/corporate-information/our-service-
areas
14. Government of Canada. (2021). National broadband internet service availability map.
https://www.ic.gc.ca/app/sitt/bbmap/hm.html
15. Columbia Shuswap Regional District. (2021). Landfill Sites and Transfer Stations.
https://www.csrd.bc.ca/services/solid-waste-recycling/landfill-sites-hours-fees
16. BC Ministry of Environment and Climate Change Strategy. (2020). BC municipal solid waste disposal rates [data
set]. https://catalogue.data.gov.bc.ca/dataset/bc-municipal-solid-waste-disposal-rates
17. City of Revelstoke. (n.d.). Garbage (Solid Waste) and Recycling. https://bc-
revelstoke2.civicplus.com/302/Garbage-Solid-Waste-and-Recycling
18. BC Ministry of Environment and Climate Change Strategy. (2020). Municipal solid waste disposal in B.C. (1990-
2018). http://www.env.gov.bc.ca/soe/indicators/sustainability/municipal-solid-waste.html
19. BC Ministry of Transportation and Infrastructure. (2016). Traffic data program. https://prdoas6.pub-
apps.th.gov.bc.ca/tsg/
32You can also read