Review and analysis of electric vehicle supply and demand constraints - Resource Economics - EECA
←
→
Page content transcription
If your browser does not render page correctly, please read the page content below
Resource Economics

     Review and analysis
     of electric vehicle
     supply and demand
     constraints

     24th March 2021

Report prepared for
Energy Efficiency and Conservation Authority
Authorship
 Tim Denne

 tim.denne@resoe.co.nz

 © Resource Economics Ltd, 2021. All rights reserved.

Disclaimer
Although every effort has been made to ensure the accuracy of the material and the integrity
of the analysis presented herein, Resource Economics Ltd accepts no liability for any actions
taken on the basis of its contents.
This paper has been independently prepared for the Energy Efficiency and Conservation
Authority (EECA) and, as such, does not represent the views of EECA or Government policy.
Contents
Summary                                             i
    Background                                      i
    Findings                                        i

1     Introduction                                 1
    1.1    Background                               1
    1.2    Types of EV                              1
    1.3    Numbers of EVs in New Zealand            2
    1.4    Policy to Encourage Electric Vehicles    3
    1.5    Approach and Structure                   3

2     EV Supply                                    5
    2.1    New Vehicle Supply Limits                5
    2.2    Battery Supply Limits                   14
    2.3    Alternative Technologies                18
    2.4    Used EV Supply Limits                   20
    2.5    Insights from Supply Analysis           23

3     Demand Drivers                               25
    3.1    Drivers of Demand                       25
    3.2    Relative Costs of EVs                   25
    3.3    Relative Usability of EVs               31
    3.4    Disadvantages of EVs                    37
    3.5    EV Advantages                           38
    3.6    Characteristics of Early Adopters       38
    3.7    Insights from Demand Analysis           38

4     Conclusions                                  40
    4.1    Supply Issues                           40
    4.2    Demand Issues                           40

Glossary                                           43

References                                         44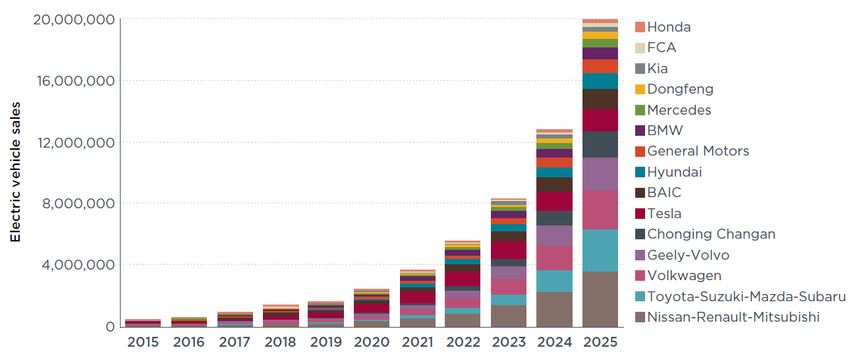
Summary
Background
The New Zealand Government has set a goal of achieving net zero emissions of long-lived
greenhouse gases (GHGs), including CO2, by 2050. In response, the Climate Change Commission
(CCC) has produced a draft consultation document which sets out an “achievable, affordable
and socially acceptable” path to achieving this goal.1 Because road transportation is a large and
growing source of CO2 emissions, the CCC includes ambitious reductions in transport emissions
in its path. This includes accelerated adoption of electric vehicles (EVs) in the light fleet,
including cars, vans and utility vehicles (‘utes’), with no further internal combustion engine (ICE)
light vehicles imported after 2032. The CCC suggests this would mean over 50% of all light
vehicle travel would be in EVs by 2035 and 40% of the light vehicle fleet would be EVs by 2035.
Their suggested path shows slow initial growth in registrations and rapid growth from 2025 to
2030.

This report examines whether there are practical constraints to such an ambitious pathway for
EVs, from limits either to supply or demand. We examine constraints in the short run, to 2025,
and the longer run, from 2030.

Findings
This report describes the results of a rapid examination of supply and demand constraints for
EVs, including battery electric vehicles (BEVs) and plug-in hybrid electric vehicles (PHEVs). We
also consider supplies of hybrid electric vehicles (HEVs). The supply issues discussed include
those that affect available models and volumes. Demand issues include prices of EVs relative to
internal combustion engine vehicles (ICEVs), developments in kilometre range limitation for
BEVs and the positive performance attributes of EVs relative to ICEVs.

The report is based on a combination of a review of relevant literature, including published
studies, company and other websites, along with information obtained from interviews with
industry, industry organisations and others. It was completed in a short timeframe, such that
some areas of the report have not been fully researched and the information provided is
intended to be a synopsis of insights for a general overview only.

Supply Issues
In the short run, up to 2025, there are expected to be some supply constraints for new EVs
because of limited EV production capacity which is initially focussed on providing supplies to
markets with more stringent CO2 policy requirements. In addition, there will be a limited
number of vehicle categories available as EVs, which limits the extent to which anticipated
demand can be met across all market segments. By 2030, BEV production is expected to have
increased significantly such that New Zealand can expect few, if any, constraints to supply of
new EVs.

Because of the significance of used vehicles to total vehicle supply, and because Japan is the
primary source of supply, EV sales in Japan are critical to the short-run supply of used EVs to

1   Climate Change Commission (2021)

                                                                                                       i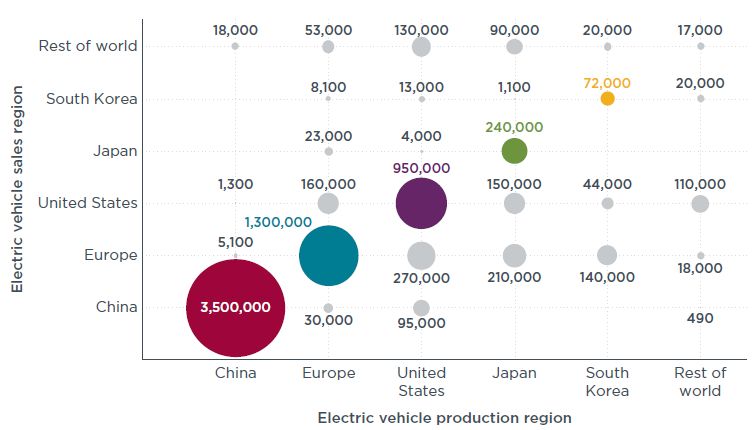
New Zealand. Finite sales of BEVs in Japan limit how many are available for supply in the period
to 2025. EV sales in Japan are expected to continue to increase, although increased competition
for supplies from Australia is expected after legislative changes to liberalise import markets.
Current emerging markets are likely to become more important if New Zealand is to increase EV
imports significantly. China is a major producer and consumer of EVs, although it is not a major
exporter currently. It could become a significant source of EVs for New Zealand, and potentially
an alternative low-cost supplier to replace used imports. However, it is unlikely that they will be
a major source of supplies to New Zealand until closer to 2030.
Demand Issues
Demand for BEVs is currently constrained by issues relating to relative costs and usability issues,
including kilometre range constraints.
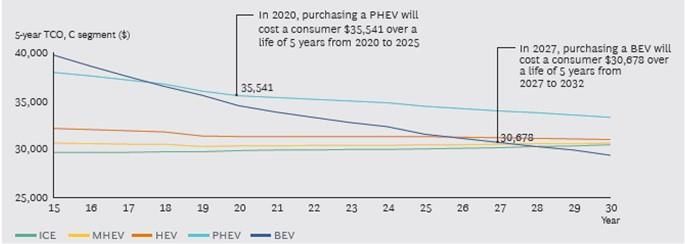
BEVs are expected to be cost competitive with ICEVs by 2030, including purchase price parity by
2030 and total cost of ownership (TCO) parity much earlier. Purchase price differences between
BEVs and ICEVs may persist longest for smaller, lower-cost vehicle categories, ie those
competing with ICEVs selling for less than $35,000.
Range anxiety continues to be a concern for many BEV buyers, especially of low-cost, small-
battery vehicles in the used vehicle market where Nissan Leafs have dominated sales. This will
improve over time as battery prices fall and achievable vehicle ranges increase above 350km.
Range anxiety will continue to be a barrier to 2025, especially for BEVs purchased as primary
household vehicles, but it is not expected to be significant by 2030.
There are some concerns over end-of life management of batteries, but these will reduce if
effective product stewardship schemes develop, as currently being addressed by Battery
Industry Group (BIG).
EVs, and BEVs are expected to become a dominant part of the future New Zealand vehicle fleet,
but such a significant change to the fleet will take time to achieve effectively and efficiently. By
2030, EVs are likely to be readily available for import across all vehicle categories at a price
(even in the absence of policy incentives) that is competitive with ICEVs.
Table ES1 summarises the main issues discussed in this report and the conclusions reached.
Table ES1 Summary of Commentary on Potential EV Supply and Demand Constraints
Issues To 2025 By 2030
Supply Constraints
Are there limits to New vehicles: There will be limits to New vehicles: There are unlikely to be
how many EVs can what can be imported to New Zealand supply constraints for imports of new
be imported? because of limited production capacity, EVs.
focussed on supplies to more stringent
policy-led markets.
Used vehicles: There are finite sales of Used vehicles: More available supplies
EVs in Japan, particularly of BEVs for as EV sales increase, although with the
which there is a risk of fewer Leafs risk of increasing competition.
entering the market.
Increased competition is expected from
Australia, which will reduce potentially
iiavailable supplies to New Zealand
and/or increase their costs.
Can vehicles be Some vehicle types, and utes in EVs available in most, if not all, vehicle
imported across all particular, may not be widely available categories.
categories of in BEV form for several years. This
demand? issue is most pronounced for used
vehicles (where utes are not available
as ICEVs either).
Will battery costs Battery costs for vehicles may not fall Greater vertical integration is expected
continue to fall? immediately as a result of increasing to result in falling production costs.
battery sizes (to increase vehicle Battery costs expected to fall to
range) and some supply interruptions relatively low levels and new battery
(from Covid and short-run limits in raw technology (eg solid-state) expected to
materials while new technologies be widely available.
develop).
Battery costs are expected to fall most
for vertically-integrated producers. This
includes Tesla and manufacturers in
China, Japan and Korea.
Will alternative Ongoing R&D on alternative vehicle Mix of vehicles available, but with no
technologies technologies (eg FCEVs, e-fuel) may significant constraints to EV supply to
displace BEVs in the still lead to significant market New Zealand.
supply market? penetration, particularly in Japan.
However, commitment of other
countries to EVs suggests it is unlikely
that these technologies will displace
BEVs for the foreseeable future.
Will there be low- Not in significant numbers in the short China is expected to become a
cost Chinese run. significant producer and exporter of
vehicles available? EVs.
Demand constraints
Will BEVs continue BEVs, in general, have higher purchase Purchase price differentials are
to have higher prices than ICEV equivalents, and this expected to narrow, so that there is
purchase prices is most pronounced for lower-cost widespread price parity by 2030 or
than ICEVs? vehicles for which battery costs are a earlier.
higher percentage of total costs.
Parity in TCO is expected to be TCO parity expected to be widespread.
widespread across vehicle categories,
but not all purchasers of vehicles
consider full TCOs.
How long will range Range anxiety will limit sales of many Range anxiety is expected to be much
anxiety be a BEVs, affected by a combination of reduced with continual improvement in
demand constraint? limited vehicle range capability and kilometre range.
perceptions of low public charger
availability.
Range anxiety reductions depend on
This may limit sales (particularly of the roll-out of charging infrastructure,
low-cost, small-battery vehicles) to with open and interoperable
second household vehicles or to users technologies and smart charging
with small typical trip lengths. capability.
Will BEVs There are higher depreciation rates for With improvements in battery
depreciate in value those BEVs with more rapid battery technologies, factors affecting higher
more than ICEVs? degradation. This is made worse by the depreciation rates are likely to
absence in New Zealand of reasonably- disappear.
priced battery replacement services for
used vehicles.
Are end-of-life Development of product stewardship schemes are expected to allay most
batteries an concerns over end-of-life management of batteries from EVs.
emerging
environmental
problem for New
Zealand?
iii1 Introduction
1.1 Background
The New Zealand Government has set a goal of achieving net zero emissions of long-lived
greenhouse gases (GHGs), including CO2, by 2050. In response, the Climate Change Commission
(CCC) has produced a draft consultation document which sets out an “achievable, affordable
and socially acceptable” path to achieving this goal.2 Because road transportation is a large and
growing source of CO2 emissions, the CCC includes ambitious reductions in transport emissions
in its path. This includes accelerated adoption of electric vehicles (EVs) in the light fleet,
including cars, vans and utility vehicles (‘utes’), with no further internal combustion engine (ICE)
light vehicles imported after 2032. The CCC suggests this would mean over 50% of all light
vehicle travel would be in EVs by 2035 and 40% of the light vehicle fleet would be EVs by 2035.
Their suggested path to these targets is shown in Figure 1. It shows slow initial growth in
registrations and rapid growth from 2025 to 2030.
Figure 1 Uptake of electric vehicles in the Climate Change Commissions draft suggested path
Source: Climate Change Commission (2021), p58.
This report examines whether there are practical constraints to such an ambitious pathway for
EVs, from limits either to supply or demand. We examine constraints in the short run, to 2025,
and the longer run, from 2030.
1.2 Types of EV
Different vehicle types and technologies can be classified as EVs. These include the following.
• Battery electric vehicles (BEVs) which use electricity as the only source of power. They
have rechargeable batteries and no gasoline engine.
• Plug-in hybrid electric vehicles (PHEVs) have both an electric motor and an ICE. PHEVs
generally have smaller batteries than BEVs which they can recharge through both
2 Climate Change Commission (2021)
1regenerative braking and “plugging in” to an external source of electrical power.3 They
can drive for a limited distance using electricity before switching to the ICE.
• Hybrid electric vehicles (HEVs) also have both an electric motor and an ICE. The battery
is charged only by regenerative braking or from an ICE as there is no plug-in capability.
They may only use electricity during initial acceleration, but generally electricity assists
the ICE. HEVs include mild hybrid electric vehicles (MHEVs) which have a very small
battery and an electric motor which only ever assists the ICE.
Additional technologies being proposed or launched include hydrogen in a fuel cell electric
vehicle (FCEV) and e-fuel, a hydro-carbon fuel produced from hydrogen and CO2.4
EVs are defined in legislation in New Zealand to mean “a motor vehicle with motive power
wholly or partly derived from an external source of electricity”,5 ie BEVs and PHEVs. We use this
definition here, while separately identifying HEVs.
1.3 Numbers of EVs in New Zealand
Currently there are approximately 24,500 light EVs in New Zealand, of which 75% are BEVs and
25% PHEVs (Table 1). Of the total, over 12,000 (49%) are Nissan Leafs, 12% are Mitsubishi
Outlanders, 8% are Teslas (Models 3, S and X) and 5% are Toyota Prius PHEVs; there are also
large numbers of Prius HEVs in New Zealand. EVs comprise approximately 0.6% of the total of
just over 4 million light vehicles.
Table 1 EVs in the New Zealand light vehicle fleet
Condition No. in fleet % of % of light Registrations % of % of light
Type
at import (Jan 2021) EVs fleet (2020)c EVs fleet
BEV New 5,612 23% 0.1% 1,529 28% 0.6%
Used 12,862 53% 0.3% 2,466 45% 1.0%
Total 18,474 75% 0.5% 3,995 73% 1.7%
PHEV New 3,717 15% 0.1% 757 14% 0.3%
Used 2,290 9% 0.1% 702 13% 0.3%
Total 6,007 25% 0.1% 1,459 27% 0.6%
BEV + PHEV Total 24,481 100% 0.6% 5,454 100% 2.3%
HEV New 8,017 E 3.3%
Used 14,736 E 6.1%
Total 51,375a 1.3% 22,753 E 9.4%
Light Total 4,028,136 b
100.0% 240,172 100.0%
a2019 total; b Q1 2020 total; c HEV registrations are estimates (E) based on data for the year to September
2020, multiplied by 1.33
Source: MoT fleet statistics
There were 5,454 registrations of EVs in 2020, which is 2.3% of the total light vehicle
registrations; 73% were BEVs.
3 Anecdotally, many people do not plug-in PHEVs, effectively using them as an HEV (Dobson, 2020 and OEM
interview comments). This means real fuel consumption and CO2 emissions are higher than in test cycles.
4 https://www.efuel-alliance.eu/efuels
5 Land Transport (Road User) Rule 2004
2In addition, there were estimated to be 51,375 HEVs in the light fleet in 2019 (the latest year for
which fleet data are published),6 and a further 22,753 HEV registrations estimated for 2020.7
With some expected de-registrations, HEVs are likely to total over 70,000 light vehicles
currently, or approximately 1.7% of the light fleet. The high current growth in HEV registrations,
compared to that for BEVs and PHEVs is shown in Figure 2.
Figure 2 Registrations of new and used HEVs, PHEVs and BEVs
14,736
16,000
2016 2017 2018 2019 2020
12,611
14,000
12,000
10,000
8,017
7,113
8,000
5,863
4,729
6,000
3,525
3,439
2,887
2,529
4,000
2,466
2,114
1,860
1,529
1,487
1,352
2,000
953
757
739
737
702
686
672
548
467
420
340
328
101
51
0
New HEV New PHEV new BEV Used HEV Used PHEV Used BEV
Note: 2020 data for HEVs are data for the year to end of September scaled up (multiplied by 1.33)
Source: MoT fleet statistics
1.4 Policy to Encourage Electric Vehicles
The Government has developed policy to reduce the CO2 intensity of the vehicle fleet and to
encourage EV take-up. In January 2021, the Government agreed to introduce the Clean Car
Standard (CCS), with legislation expected to be introduced later this year. In its current form, it
aims to reduce the average emissions intensity of new cars and SUVs to 105g CO2/km by 2025
and that for utes and vans to 132g/km. The standard is to be met as an average by individual
importers, but importers can combine to meet the standard together. The CCS has lower
penalties for non-compliance for used vehicle imports than for new imports.8
1.5 Approach and Structure
This report describes the results of a rapid examination of supply and demand constraints for
BEVs, PHEVs and HEVs (including MHEVs).
6 Table 6 in MoT Annual Fleet Statistics 2019: Data Spreadsheet
https://www.transport.govt.nz/assets/Uploads/Data/NZVehicleFleet.xlsx
7 MoT has published data to Q3 2020, so these numbers are calculated as 1.33 times the registrations to the end
of Q3.
8 The penalties are lower because used imports are expected to remain in the fleet for a shorter period
(Minister of Transport, The Clean Car Standard Cabinet Paper.
https://www.transport.govt.nz//assets/Uploads/Cabinet/TheCleanCarStandard.pdf)
3The report is based on a combination of a review of relevant literature, including published
studies, company and other websites, along with information obtained from interviews with
industry, industry organisations and others.
1.5.1 Organisations Interviewed
Interviews were held largely over the period 15-26th February 2021 with one or more
representatives from 19 companies and organisations listed in Table 2. These comprised:
• new vehicle importers. These were New Zealand distributors representing original
equipment manufacturers (OEMs);
• used vehicle importers;
• industry organisations representing the new (MIA) and used (VIA) vehicle importers,
and Drive Electric which is a member organisation for EV importers; and
• the Government fleet procurement manager in MBIE.
Table 2 Organisations interviewed
New vehicle importers and Used vehicle Other
distributors (marques if > 1) importers Organisations
• BMW (BMW, Mini) • GVI • Motor Industry Association (MIA)
• European Motor Distributors (VW, • Blue Cars • Vehicle Industry Association (VIA)
Audi, Porsche, SEAT, Skoda) • Good Car Co. • Drive Electric
• Ford (Australia) • Ministry of Business, Innovation &
• Great Lake (Ssangyong, LDV) Employment (MBIE)
• Honda
• Hyundai
• Kia
• Mazda
• Mitsubishi
• Nissan
• Subaru
• Toyota
Interviewees were asked to comment on their perceptions of supply constraints, including
production constraints (for vehicles and batteries), any New Zealand-specific competitive
disadvantages, trends in battery performance (including degradation) and prices, trends in
relative prices for new EVs and when they might become price competitive with internal
combustion engine vehicles (ICEVs).
1.5.2 Structure
In the next two sections we address the issues as supply and demand constraints to increased
imports of EVs. The supply issues discussed are those that affect available models and volumes,
and battery supplies. Demand issues include prices of EVs relative to ICEVs, developments in
kilometre range capability for BEVs and the positive performance attributes of EVs relative to
ICEVs. Section 4 brings together some overall conclusions.
42 EV Supply
2.1 New Vehicle Supply Limits
2.1.1 Historical Imports to New Zealand
Table 3 shows the light vehicle types imported new from the beginning of 2015 to January 2021.
There is most variety in the imports of new BEVs. Of a total of 39 imported models, over 60% of
BEVs are made up of Tesla Models 3, X and S (36%), Hyundai Konas (14%) and Hyundai Ioniqs
(12%). Factory Built Lloyds (8%) are small vehicles used for postal delivery. For PHEVs, there
have been 32 models imported to January 2021, with Mitsubishi Outlanders comprising over
half of imports (51%). Imports of new vehicles to New Zealand come from many different
countries, reflecting the different locations of manufacture. For example, new Nissan Leafs sold
in New Zealand are manufactured in the UK. In 2020 new EVs were imported to New Zealand
from Belgium, China, France, Germany, Japan, the Netherlands, South Korea, Sweden, Turkey,
the UK and the USA.
Table 3 Light New BEV and PHEV registrations in New Zealand (1 Jan 2015 - 31 Jan 2021)
BEV Type Number % PHEV Type Number %
Tesla Model 3 1,195 22% Mitsubishi Outlander 1,782 51%
Hyundai Kona 793 14% Toyota Prius 323 9%
Hyundai Ioniq 653 12% Mini Countryman 269 8%
Factory Built Lloyds 440 8% BMW I 239 7%
Tesla Model X 407 7% Audi A3 179 5%
Tesla Model S 368 7% Hyundai Ioniq 155 4%
Volkswagen E-golf 329 6% Porsche Cayenne 88 2%
Nissan Leaf 271 5% Volvo Xc90 73 2%
Audi E-Tron 191 3% Kia Niro 57 2%
BMW I 180 3% Volvo Xc60 55 2%
Other 706 13% Other 302 9%
Total 5,533 100% Total 3,522 100%
Source: MoT Fleet Statistics (www.transport.govt.nz/statistics-and-insights/fleet-statistics)
2.1.2 Location of Sales
Globally EVs sales reached an estimated 3.24 million in 2020, up 43% on 2019; this represented
4.2% of light vehicle sales, up from 2.5% in 2019 (Figure 3). China has dominated sales and
stocks of EVs but 2020 saw Europe (1.395 million) overtake China (1.337m) in total new sales.
EVs comprised 10.5% of new vehicle sales in the EU in 2020 (up from 3% in 2019) and HEVs
11.9%.9 New Zealand’s imports of 2,286 new EVs in 2020 is less than 0.1% of global sales.
EV-Volumes note the changes in volumes of BEVs versus PHEVs. In 2020 global new registrations
were dominated by BEVs (69%).10 PHEVs decreased in total sales in 2019, partly because of
legislative changes in the EU which meant most PHEVs did not meet CO2 limits making them
eligible for incentives, but changes to the installed batteries meant that they were eligible again
in 2020.
9 ACEA (2021)
10 https://www.ev-volumes.com/
5Figure 3 Annual EV registrations, market share and year-on-year growth
Note: PEV = plug-in EV (BEVs & PHEVs)
Source: https://www.ev-volumes.com/
The IEA (2020) had previously noted the softening overall growth in sales in 2019, which it
suggested was a result of
• slowing in market sales of all vehicles, not just EVs;
• reductions in purchase subsidies in key markets, including China (halving of purchase
subsidy) and the USA; and
• the extension of sales from early adopters to the mass market.
However, the trend reversal in 2020 suggests these issues are no longer significant or are
compensated for by increased incentives.
The IEA (2020) suggests that much of the historical sales growth is in response to policy. It
projects future uptake in the form of scenarios, including a stated policies scenario11 under
which EVs would increase to 12% of light vehicle stocks by 2030, but alternative scenarios in
which they rose to 8% and 16% of stocks. The actual levels depend significantly on policy
settings.
Projections of future sales suggest rapid increases across many markets, particularly Europe and
China (see Figure 4).
11 The likely consequences of existing and announced policy measures
6Figure 4 Electric vehicle sales penetration by region (% of total passenger car sales)
Source: UBS (https://www.ubs.com/global/en/collections/sustainable-investing/latest/2021/trends-electric-
transport.html)
2.1.3 Production Priorities
New Zealand is very small in the context of the global market. This means we only need small
numbers of EVs, but we are also takers of technology produced for other major markets,
especially for EVs for which there are currently relatively few models and limited numbers of
production lines. New Zealand distributors interviewed suggested that large markets with the
most stringent policies encouraging EVs are the focus for supplies12 (hence EV sales totalled
over 10% of new registrations in the EU in 2020 – see above).13 This pattern is not unique to
EVs, OEMs prioritise larger markets when they launch new products and supply to New Zealand
is usually delayed by several months.
For OEMs, with current limited EV production capacity, producing EVs for New Zealand is not a
priority. For many OEMs, supplies to New Zealand are grouped with those to Australia, such
that the same models are made available in the two markets. As the larger market, Australia has
a significant influence on the new vehicle types available for sale in New Zealand.
Globally, between 2010 and 2019, close to 80% of light-duty EVs were sold in the same region
as they were produced, including sales within China, Europe and the USA (Jin et al, 2021). China
exported about 25,000 light-duty EVs, less than 1% of its production, whereas Japan exported
around 451,100 light-duty EVs, or 66% of its production, and South Korea, 204,000, or 74% of
production. The United States (mainly Tesla) exported more than 500,000 (35% of its EV
output), and Europe 227,000 (17%). JATO suggests Chinese BEVs are designed and developed
for local demand, and that many of them would not meet the more complex safety standards of
Europe or the USA.14
Figure 5 illustrates the relative size of domestic and export sales for different producing
countries and regions. New Zealand is included in the Rest of world region which has small
levels of production and sales.
12 Supplying these markets reduces total corporate costs in the face of non-compliance penalties
13 See ACEA (2020) for summary
14 https://www.jato.com/electric-cars-cost-double-the-price-of-other-cars-on-the-market-today/
7Figure 5 Total new 2010–2019 light-duty EV production and sales regions
Source: Jin et al (2021) using data from EV-volumes.com
Figure 6 shows 13 companies that have sold 200,000 or more EVs in 2010-19. The colours of the
bars represent the region of their manufacture location. Four are Chinese brands (BYD, BAIC,
Geely and SAIC), two are from the USA (Tesla and GM), three from Europe (BMW, Volkswagen
and Renault) and three from Japan (Nissan, Mitsubishi and Toyota).
Figure 6 Light EV sales by manufacturer
Source: Jin et al (2021) using data from EV-volumes.com
Sales of the top 20 models are shown in Figure 7. The top five are vehicles which are also
amongst the top new registrations in New Zealand (Table 3). Chinese sales are distributed
across a wider variety of vehicle models. Jin et al (2021) suggest “the China market has far more
companies competing, and major powerful passenger vehicle brands that appeal to both
domestic and global consumers have yet to be formed.” However, they note that Chinese
brands do have international influence in the commercial vehicle market, with BYD accounting
8for more than 20% of the European battery-electric bus market, and nearly 30% of the Japanese
market. BYD is scheduled to establish in New Zealand in 2021.15
Figure 7 Top EV models sold 2010-19
Source: Jin et al (2021) using data from EV-volumes.com
Several distributors interviewed raised the added issue that there is a more limited number of
significant right-hand drive (RHD) markets internationally (although see full list in Table 4). New
Zealand will be dependent on the production of vehicles for these other RHD markets, in the
same way as it is for ICEVs.
Table 4 Right-hand drive countries
Region Countries
Asia Bangladesh, Bhutan, Brunei, East Timor, Hong Kong, Indonesia, India, Japan,
Macau, Malaysia, Nepal, Pakistan, Singapore, Sri Lanka, Thailand
Africa Botswana, Kenya, Lesotho, Malawi, Mozambique, Namibia, South Africa,
Swaziland, Tanzania, Uganda, Zambia, Zimbabwe
Atlantic Ocean Bermuda (UK), Falkland Islands (UK), Saint Helena, Ascension and Tristan da
Islands Cunha (UK), South Georgia and South Sandwich Islands (UK)
Australia and Australia, Christmas Island (Australia), Cocos Islands (Australia), Cook Islands
Oceania (NZ), Fiji, Kirbati, Nauru, New Zealand, Niue, Norfolk Island (Australia), Papua new
Guinea, Pitcairn Islands (UK), Solomon Islands, Tokelau (NZ), Tonga Tuvalu
Europe Cyprus, Guernsey (UK), Ireland, Isle of Man (UK), Jersey (UK), Malta, UK
Indian Ocean Maldives, Mauritius, Seychelles
Islands
South America Guyana, Surinam
& West Indies Anguilla (UK), Antigua and Barbados, Bahamas, Barbados, British Virgin
Islands(UK), Cayman Islands (UK), Dominica, Grenada, Jamaica, Monserrat (UK),
Saint Kitts and Navis, Saint Lucia, Saint Vincent and the Grenadines, Trinidad and
Tobago, Turks and Caicos Islands (UK), Virgin Islands (USA)
Source: http://carsexport.eu/lhdcars.htm
15 Barry (2021)
9The limitations of RHD markets are not regarded as a significant constraint by all OEMs, with
one suggesting that RHD and LHD vehicles can be produced on the same production line, while
others suggest that even if this is so, there are still considerable additional costs associated with
producing both. The additional costs mean that RHD vehicles may not be prioritised, or if they
are produced for the larger markets (such as the UK), New Zealand will expect to be limited to
vehicles supplied to those markets (UK, Japan, Australia particularly).
The market prioritisation suggested by many OEMs interviewed is, first domestic sales, then
international markets with the most stringent policy requirements (ensuring policy costs are
minimised). New Zealand obtains supplies to the extent that there is spare production capacity
and, for many OEMs, it is grouped with Australia for the purpose of decisions on models
supplied.
2.1.4 Capacity Investments
Currently investments in vehicle production capacity are focussed on China and Europe, with
smaller capacity investments in the USA, South Korea and Japan. Table 5 shows announced
industry capacity investments, with the country of origin of the investor represented by the
rows and the columns the destination of investment. German companies are the largest
expected investors, with investments split between China (49%) and Germany (51%). China is
estimated to be receiving US$136 billion in new investments, 50% of which is from Germany
(including Volkswagen/Audi/Porsche with $45.5 billion and Daimler, $22 billion) and 42% from
Chinese companies.
Table 5 Announced industry electric vehicle investments ($billion) by origin (rows) and destination (columns)
Origin China Germany USA S Korea Japan France Other Total
Germany $67.8 $71.7 $139.5
China $57.0 $57.0
USA a
$5.0 $34.0 $39.0
Japan $4.8 $18.9 $0.7 $24.4
S Korea $20.0 $20.0
France $0.4 $10.4 $10.8
India $6.4 $6.4
UK $2.3 $2.3
Sweden $0.7 $0.7
Total $135.7 $71.7 $34.0 $20.0 $18.9 $10.4 $9.4 $300.1
aincludes Fiat Chrysler
Source: Lienert and Chan (2019)
Further detail about announced investments is provided in Table 6, alongside projected sales
and numbers of models.
Based on the announcements summarised in Table 6, Slowik et al (2020) summarise the sales
estimates for the individual manufacturers in Figure 8. The largest sales are estimated from the
Nissan-Renault-Mitsubishi alliance, within which Mitsubishi is specialising in PHEVs, with BEVs
produced by the other two members. Toyota, with Suzuki, Mazda and Subaru are also investing
significantly in EV capacity, despite Toyota’s additional commitment to development of
hydrogen vehicles (see Section 2.2). Volkswagen is investing significantly in EV production and
rapidly increasing sales, including the ID3 which is its rival to the Nissan Leaf.
10Table 6 Manufacturer investment announcements, model offerings and sales targets
Automaker
group Announced investment Electric models Annual global
electric sales
(share)
Volkswagen $40 billion manufacturing 70 electric models by 2028 4–5 million (40%) by
Group plant by 2022 300 electric models by 2030 2030
$60 billion battery
procurement
Nissan- $9.5 billion over 2018–2022 20 electric models by 2022 3 million (30%) by
Renault- (China) (China) 2022
Mitsubishi
Toyota- $2 billion over 2019–2023 in All vehicles hybrid, battery, or 2–3 million (15%) by
Suzuki- Indonesia fuel cell electric by 2025 2025
Mazda-
Subaru
Honda $430 million facility in China 100% hybrid or electric sales in 2 million (30%) by
$300 million for battery plants Europe by 2025 2030
20 electric models in China by
2025
Chongqing 21 electric models by 2025 1.7 million (100%) by
Changan $15 billion by 2025 12 plug-in hybrid models by 2025 2025
Mercedes $13 billion manufacturing 10 electric models by 2022 1.5 million (50%) by
plant 50 electrified models by 2025 2030
$1.2 billion battery
manufacturing
$22 billion battery
procurement
BAIC $1.5 billion by 2022 (not available) 1.3 million (100%) by
$1.9 billion (with Daimler) 2025
Geely $3.3 billion Al models hybrid or electric by 1.1 million (90%) by
2019 (Volvo) 2020
Tesla $5 billion factory in Shanghai 6 all-electric models 1 million (100%) by
$4.4 billion factory in Berlin 2022
Hyundai $16 billion through 2025 23 BEV, 6 PHEV, 2 FCEV by 2025 1 million (15%) by
(Hyundai Motor Group) 2025
BMW $11 billion battery 13 electric models by 2025 900,000 (30%) by
procurement from 2020–2031 12 plug-in hybrid models by 2025 2030
General $2.3 billion battery factory 1 million (12%) by
Motors $2.2 billion electric vehicle 20 electric models by 2023 2026
plant
Kia $25 billion through 2025 11 battery electric vehicles by 500,000 (15%) by
2025 2026
Fiat $22 billion to develop hybrid 30 nameplates will have hybrid or 250,000 (10%) by
Chrysler and electric vehicles through electric options by 2022 2025 in China, North
2022 America
Smart (not available) Only all-electric options from 100,000 (100%)
2020 in Europe and the USA
Ford $11 billion by 2022 16 all-electric models by 2022 (not available)
PSA Group $250 million in electric motors Hybrid or electric options of all (not available)
$90 million in transmissions models by 2025
Great Wall $2–8 billion over 10 years (not available) (not available)
11BYD $3 billion on battery factories (not available) (not available)
by 2020
$1.5 billion Changzhou NEV
factory
Jaguar Land $18 billion over 2019-2022 Hybrid or electric options of all (not available)
Rover models by 2020
Infiniti (not available) All new models plug-in hybrid or (not available)
electric by 2021
Source: Slowik et al (2020)
Figure 8 Annual EV sales (to 2019) and future sales estimates based on manufacturer intentions
Source: Slowik et al (2020)
The implications for New Zealand are that there is significant expected investment in EV
production capacity and significant increases in sales. New Zealand would expect to increase
imports in-line with these global trends. This means that, in the longer run, eg by 2030, there
are expected to be no significant limits to EV supply. However, in the immediate term the
focus of OEMs is likely to be on increasing capacity to meet demand growth in China and
Europe.
2.1.5 Missing Markets
There are expected to be some categories of vehicle that are either unavailable or not readily
available in BEV form. For New Zealand the most widely cited missing type of vehicle is a BEV
ute. Utes are relatively niche vehicles used in the Australasian market. US Pick-up trucks, for
example, are generally larger (and produced as LHD vehicles). Batteries may not provide enough
power to lighter utes as typically sold in New Zealand, if they are carrying heavy loads or towing
significant weights. We also note, because of the absence of demand in Japan, New Zealand
does not import used ICE utes currently.16
Great Wall17 and Tesla cybertrucks18 are some of the only potential EV ute examples, although
neither are currently available. There is thought to be little chance of much else (eg Rivian19)
being produced in RHD vehicles in the near future, although Toyota is talking about producing a
16 Small numbers have been imported from Australia.
17 https://www.driven.co.nz/news/great-wall-s-electric-ute-and-its-new-zealand-power-play/
18 https://www.tesla.com/en_nz/cybertruck
19 https://rivian.com/r1t; https://www.evspecifications.com/en/model/8b4391
12(mild) hybrid Hilux.20 Converting ICEVs to operate as EVs might be an alternative way to produce
electric utes for NZ.21
One interviewee suggested an absence of large EV people carriers, although we note
announcements that include the Citroën eSpace Tourer, which could seat up to nine and with a
maximum range of 230km,22 and the Nissan E-NV200 COMBI, which includes a 7-seater model.23
There are a number of other specialist vehicle demands, eg the space requirements of police
vehicles, and these may not be easily met using the limited number of EVs available in the next
few years.
In the short run, some vehicle categories (utes in particular) will not be available in EV form in
New Zealand. However, the increasing penetration of BEVs into the global vehicle market is
expected to see a multiplication of the varieties available, so that by 2030 it is likely that most, if
not all, vehicle categories will have models available in EV form.
2.1.6 Market Response to Policy
Short run (to 2025) supply limits mean OEMs’ achievement of the CCS requirements will vary
significantly.
Some OEMs are likely to achieve the 105g/km standard and become potential credit sellers in
the system. This includes Tesla (selling only EVs) and Toyota which has HEV, PHEV or BEV
options across much of their fleet.
Others will not produce the right mix of vehicles and may not be able to reach joint
arrangements either. Subaru, for example, has no BEVs planned until 2030. Mitsubishi has an
agreement within its alliance with Nissan and Renault to only supply PHEVs for the immediate
future. These decisions made at a corporate level may affect some companies costs under the
CCS. Some OEMs interviewed suggested this could result in withdrawals from New Zealand,
citing Holden as an example (albeit for quite different reasons).24 They argue that New Zealand
is vulnerable to withdrawals as a small market that contributes little to corporate sales and
profit. The actual response is uncertain currently and we know of no current withdrawal
intentions.
There is some expectation that New Zealand will be able to achieve a rapid transformation to its
import mix because of the stringency of policy elsewhere, eg in the EU where a standard of 95g
CO2/km applies,25 means vehicles are available for sale to enable this fast transition. However,
there are constraints.
20 https://www.driven.co.nz/news/a-hybrid-version-of-the-toyota-hilux-ute-is-on-its-way/
21 We note this company offering a service in NZ: https://www.thesurgery.co.nz/services/electric-vehicle-
conversions/
22 https://www.autofutures.tv/2020/06/12/100-electric-people-carrier-with-up-to-nine-seats-the-new-citroen-
e-spacetourer/
23 https://www.voltvehicles.co.nz/env200/
24 The example was used to suggest even long-established brands might withdraw if unfavourable market
conditions develop.
25 From 2021, and phased in from 2020, the EU fleet-wide average emission target for new cars is 95g CO /km
2
(Regulation (EU) 2019/631 https://eur-lex.europa.eu/eli/reg/2019/631/oj)
13• The EU is starting from a quite different current average emission rate. In New Zealand,
the average emissions rate for imported light vehicles was 167g/km at the end of 2020,
with an average of 176g/km for new vehicles and 158g/km for used vehicles.26 In
contrast, the EU had concentrations at this level 20 years ago; the average emissions
intensity of new passenger cars imported to the EU was 122g CO2/km in 2019,27 down
from 167g/km in 2002.28 Amongst other things, the differences in average emission
rates reflects the demand for a different mix of vehicle categories.
• OEMs have plants and/or production lines dedicated currently to EVs, with others to
ICEs. If the EV production lines are at capacity producing for European markets,
additional supplies may not be available to New Zealand.
Although policy costs may be high initially, high policy costs are expected in other countries
also. Automotive Analyst, David Harrison, estimates OEM compliance costs in the EU of €7.8bn,
with fines of €4.9bn in 2021.29 He suggests this will halve profits, making Europe less attractive
to OEMs.
If there are significant total compliance costs in New Zealand, these would be expected to be
passed on in higher average vehicle import prices, and result in a mix of reduced import
volumes (and to retaining current vehicles for longer) and a shift towards purchase of lower cost
vehicles, including used imports. Ultimately, the response is uncertain currently, but is likely to
become easier and lower cost as the price differentials between EVs and ICEVs narrow; we
address that issue in Section 3.2.
2.2 Battery Supply Limits
Concerns have been raised by OEM interviewees that there may be limits to battery supply,
particularly because of limits to raw materials supply.
2.2.1 Battery Production
Figure 9 shows estimated growth in battery production capacity in different regions. The growth
is expected to be greatest in China and Europe.
There are economies of scale in battery production30 and one industry interviewee suggested
that at-scale production is only occurring in China, because individual OEMs elsewhere (Japan,
Korea, USA, Europe) are specifying battery requirements separately, so that scale economies
are not achieved. It was suggested economies of scale would only be achieved with
standardisation of batteries.
26 MoT Fleet Statistics
27 And reportedly 111g/km in early 2020 (Mathieu and Poliscanova, 2020).
28 https://www.eea.europa.eu/data-and-maps/indicators/average-co2-emissions-from-motor-
vehicles/assessment-2
29 Harrison (2019)
30 Mauler et al (2021)
14Figure 9 Estimated announced battery production capacity for 2019–2025, by region
Source: Jin et al (2021) based on Slowik et al (2020)
McKinsey & Co examine issues facing the European vehicle industry and note the benefits of
integrated supply chains upstream from batteries to mineral production and downstream to
vehicle manufacture, and European vehicle manufacturers reluctance to go down that route.31
They note that “Currently, a handful of Chinese, Japanese, and Korean cell manufacturers
dominate the market and much of the value chain, with control extending, in some cases, as far
as the mines that extract lithium and other key metals.” In the USA, Tesla is also pursuing a
strategy of deep vertical integration into all stages of manufacturing its batteries, including
processing the raw materials and even buying lithium deposits still in the ground.32
McKinsey & Co identify risks for European EV manufacturers from not investing in battery
production, especially for latecomers to production.33 More recently, Mauler et al (2021) list
current announcements of new battery production capacity. There is considerable capacity
planned for Europe, the USA, Korea, Japan and China (Figure 10).
How the battery market develops and the level of integration with EV production is uncertain
currently, let alone the implications for New Zealand supply of EVs or their costs. This is a
rapidly developing market and there may be challenges and reversals of price trends on the way
to a more stable future market with lower battery costs.
Shifts to vertical integration in the industry, and the falling costs that go with this, may lead to
some consolidation in the vehicle supply industry. This may reduce costs of production, with the
offsetting risks of reduced competition, which might mean consumers do not obtain the full
benefits in lower prices, although, some consolidation may occur simply for OEMs to maintain
competitiveness rather than introducing a risk of anti-competitiveness. And we also note the
growing number of Chinese OEMs, some at least of which are expected to export vehicles in the
future; this will increase competition in BEV supply.
31 Eddy et al (2019)
32 Waters (2020)
33 Eddy et al (2019)
15Figure 10 Selected battery cell manufacturing plants announced for 2025
Source: Mauler et al (2021)
2.2.2 Raw Material Prices
Some industry commentators have suggested there are current global capacity limits to battery
production for EVs,34 including via short-run constraints to mineral production.35 Slowik et al
(2020) compared the projected increase in demand for EVs and associated batteries, with the
known reserves of the raw materials. They estimate the main limiting factor will be cobalt. From
2025 to 2035, the cumulative use of cobalt as a percentage of known reserves is forecast to
increase from about 3% to about 14%, whereas demand for lithium and nickel increases from
about 1% of known reserves to about 8%.36 Cobalt is recyclable from batteries, but ex-EV
batteries may also have a long run future for domestic electricity storage, delaying any
recycling. It is not clear at this stage whether raw materials will be limiting, or if changes in
battery technology will keep pace with any decline in reserves.
One way to examine emerging scarcity is via price trends. Noting the importance of raw
materials prices to EV supply costs, the London Metals Exchange (LME) is identifying the key
materials and developing reporting standards and prices. Their “LME Car” lists the key metals
required for vehicle manufacture, with batteries and fuel cells dependent on aluminium, cobalt,
copper, lead, lithium, nickel and tin (Figure 11).37
Cobalt has been suggested as a material in limited supply, but a review of cobalt prices gives a
slightly more complex picture. Benchmark cobalt prices on the London Metal Exchange peaked
in 2018/19 and have fallen since but are now rising again (Figure 12).
34 See for example https://jalopnik.com/the-problem-that-could-derail-the-electric-car-revoluti-1796728488
35 Olivetti et al (2017)
36 ibid
37 LME notes some components found in HEVs and PHEVs are not used in BEVs.
16Figure 11 Metals used in vehicle manufacture
Source: https://www.lme.com/-/media/Files/About/Responsibility/LME-Sustainability-Electric-Vehicles.pdf
Figure 12 London Metal Exchange Benchmark Cobalt price (US$/tonne)
Source: https://tradingeconomics.com/commodity/cobalt
Writing about the 2019 crash in prices from highs in 2018, International Banker suggests this is
because:38
• growth rates for the EV sector have not been as great as the initial ‘hype’ suggested;
• projections of demand led to a significant increase in mining capacity, including
“artisanal mines” in the Democratic Republic of the Congo (DRC), home to more than
60% of the world’s mined cobalt output;
38 https://internationalbanker.com/brokerage/why-have-cobalt-prices-crashed/
17• demand and prices were reduced by assertions made to Tesla shareholders in May
2018 by the company’s founder, Elon Musk, that he believed he could reduce cobalt
content in Tesla EVs to “almost nothing”. And we note Tesla has used cobalt-free
batteries for some of its cars made in Shanghai.39
It is likely that Covid-related impacts on global trade has also been a significant factor in price
movements for Cobalt, and for Lithium, for which prices have also fallen since 2018 but are
currently rising (Figure 13).
Figure 13 Spot prices for Lithium Carbonate (US$/tonne)
Source: https://tradingeconomics.com/commodity/lithium
The commodity price charts are not demonstrating a clear signal of price rises that would affect
the otherwise downward movement in battery costs. This may change if EV demand continues
to rise and developments to increase battery density or to shift to alternative battery
technologies do not keep pace with sales.
Concerns over raw material supplies would be diminished if new battery types (such as cobalt-
free solid-state batteries)40 develop soon. According to some reports, Toyota plans to
commercialise an EV equipped with a solid-state battery in the early 2020s, with other OEMs to
follow.41 And as noted above, Tesla is experimenting with cobalt-free varieties.
2.3 Alternative Technologies
Alternative technologies to that used in BEVs, PHEVs and HEVs are being pursued by some
companies, particularly in Japan. This is of concern in this report only to the extent that these
developments result in more limited supplies of used EVs (as discussed further in Section 2.4.
Several models have been launched and there is a possibility that one or more of these
alternatives may see more widespread sales. The Japanese Government in its recent statements
on pursuit of reduced CO2 emissions has used wording that suggests a mix of technologies for
vehicles.42 And the Ministry of Economy, Trade and Industry (METI) produced a 2018 Long-Term
39 Wong (2020)
40 See Vector Ltd (2019) for a useful summary of battery technologies
41 https://asia.nikkei.com/Spotlight/Most-read-in-2020/Toyota-s-game-changing-solid-state-battery-en-route-
for-2021-debut
42 Government of Japan (2019); Ministry of Economy, Trade and Industry (2021)
18Goal and Strategy of Japanʼs Automotive Industry for Tackling Global Climate Change which
included the expectations of the following diffusion rate of next-generation cars by 2030: HEVs
(30-40%), BEVs and PHEVs (20-30%), Fuel Cell Electric Vehicles (FCEVs) (c.3%) and clean diesel
(5-10%).43 Notably this suggests significant ongoing supply and use of HEVs.
Three companies, Toyota, Honda and Hyundai, have launched FCEV models, which are available
for sale in California as well as Japan.44 Other companies are pursuing different technologies.
• Nissan has developed and used its hybrid, e-power technology.45 Nissan launched the
e-power Note in 2016 with a theoretical range of 1300 km and a fuel economy of as
little as 2.9L/100km.46 Nissan has suggested there has been a recent shift towards
purchasing e-power vehicles and away from EVs (and from the Leaf in particular), partly
because of limits to the practical use of EVs in Japan where many residents do not have
a garage or easy ability to charge vehicles at home and where public charging
infrastructure is still not widespread. The recently (December 2020) relaunched Note
has seen significantly higher sales than expected.47 An e-power version of the Qashqai
compact SUV has recently been launched in the USA;48 it is expected in New Zealand in
18 months or so.
• Mazda is developing e-fuel as part of the European e-fuels alliance.49 eFuels are
hydrocarbons made from hydrogen obtained from water by means of electrolysis,
which is combined with CO2 in a Fischer-Tropsch process to produce a liquid fuel. This
produces a fuel which could be used in a conventional ICE but with no net CO2
emissions (the emissions that do occur are from carbon recently absorbed from the
atmosphere).
Representatives from the different companies all see these alternative fuels and technologies as
having a potential future, and that all have the potential to be at least a significant component
of sales in the longer run. This introduces some risk for supplies of BEVs and PHEVs in Japan,
and for supplies of used EVs to New Zealand.
Although European countries, including the RHD UK and Irish markets, appear more likely to
invest in EV infrastructure, Japan appears to be keeping options open. And some of the issues
raised by Nissan about the difficulties of access to home-charging facilities in urban areas where
there is no off-street parking apply in other countries also, although we also note examples such
as the roll-out of on-street public charging scheme in the UK, funded by Government grants of
up to £7,500 (c.NZ$15,000) per charge point.50 At the moment, the development of alternatives
does not appear to be a significant enough trend to have a major impact on used EV supplies.
43 Available at: https://policy.asiapacificenergy.org/node/4191; and https://www.eu-
japan.eu/sites/default/files/imce/meti.pdf
44 Toyota Mirai (https://www.toyota.com/mirai/), Honda Clarity (https://automobiles.honda.com/clarity-fuel-
cell) and Hyundai Nexo (https://www.hyundaiusa.com/us/en/vehicles/nexo)
45 https://www.nissan-global.com/EN/TECHNOLOGY/OVERVIEW/e_power.html
46 https://www.autocar.co.nz/car-reviews-app/quick-ev-drive-2017-nissan-note-e-power
47 https://www.greencarcongress.com/2021/02/20210202-epower.html
48 https://www.driving.co.uk/news/new-cars/nissan-reveals-2021-qashqai-suv/
49 https://www.efuel-alliance.eu/
50 https://pod-point.com/guides/business/on-street-chargepoint-scheme
192.4 Used EV Supply Limits
2.4.1 Historical Imports
Used EV imports are dominated by the Nissan Leaf (91% of BEV imports), Mitsubishi Outlander
(48% of PHEV imports) and Toyota Prius (34% of PHEVs) (Table 7). Supplies are not for all vehicle
types, and as noted for new vehicles, to date there are no available supplies of utes, for
example (and no supplies of used ICE utes either).
Table 7 Used BEV and PHEV registrations (1 Jan 2015 - 31 Jan 2021)
BEV Type Number % PHEV Type Number %
Nissan Leaf 11,820 91% Mitsubishi Outlander 1,108 48%
Nissan E-NV200 529 4% Toyota Prius 781 34%
BMW I3 133 1% BMW I3 253 11%
Renault Zoe 106 1% Volkswagen E-golf 32 1%
Mitsubishi I-Miev 91 1% BMW 330e 32 1%
Mitsubishi Minicab 43 0% Mercedes-Benz C350 23 1%
Tesla Model S 40 0% BMW I8 19 1%
Smart Fortwo 35 0% BMW 330 9 0%
Kia Soul 26 0% Audi A3 9 0%
Volkswagen E-Golf 13 0% BMW 530e 8 0%
Other 91 1% Other 34 1%
Total 12,927 234% Total 2,308 42%
Source: MoT Fleet Statistics (www.transport.govt.nz/statistics-and-insights/fleet-statistics)
Used vehicle imports to New Zealand are very largely from Japan, with some also from the UK
and Thailand (see Figure 14). In 2020, 98% were from Japan.
Figure 14 Sources of used EVs imported to New Zealand
4,500
Japan UK Other
4,000
3,500
Numbers imported
3,000
2,500
2,000
1,500
1,000
500
0
2013 2014 2015 2016 2017 2018 2019 2020
Source: MoT fleet statistics
2.4.2 Sales in Japan
In the year to September 30th 2020, there were 122,257 used light passenger vehicles (LPVs)
imported, 58% of total LPV imports (211,999). Used imports have been 62% of EV registrations
to date and 70% of BEV registrations. If this pattern continues, total New Zealand EV
20registrations will be highly dependent on numbers available from Japan and other used vehicle
exporting countries.
To estimate the percentage of Japanese sales that New Zealand importers are taking, we
compare annual imports to New Zealand of used BEVs and PHEVs with the average number sold
in the 4, 5 and 6 years previously (Table 8).51 Incentivised by subsidies,52 Japan registered
38,890 EVs in 2019/20 (55% of which were BEVs), which is approximately 1% of total light
vehicle sales that year of 3.8 million.53 New Zealand imports of BEVs are over 20% of average
annual historical sales of BEVs in Japan, while used PHEV imports are approximately 5% of Japan
sales. These numbers are significant, in the face of competition from domestic Japanese
consumers and other countries, including Australia, Sri Lanka and Russia.
Table 8 NZ used imports as % of earlier Japanese sales
Japanese sales of new vehicles NZ Used imports (# and % of Japan)1
Year BEVs PHEVs Fuel cell Hybrids BEVs PHEVs BEVs PHEVs
2009/10 1,078 0 0 347,999 1 0
2010/11 2,442 0 0 481,221 1 0
2011/12 12,607 15 0 451,308 4 0
2012/13 13,469 10,968 0 887,863 4 0
2013/14 14,756 14,122 0 921,045 41 2
2014/15 16,110 16,178 7 1,058,402 116 4 6.6%
2015/16 10,467 14,188 411 1,074,926 391 23 7.3%
2016/17 15,299 9,390 1,054 1,275,560 1,255 189 13.2% 5.2%
2017/18 18,092 36,004 849 1,385,343 2,979 458 21.9% 5.5%
2018/19 26,533 23,230 612 1,431,980 3,810 508 25.8% 3.7%
2019/20 21,281 17,609 685 1,472,281 2,878 666 20.9% 4.5%
1The percentages are NZ imports as a percentage of sales in Japan 4-6 years earlier, eg 20.9% for BEVs in
2019/20 is 2878/((14756+16110+10467)/3)
Source: MoT Fleet data
To date, over 90% of the imports of used BEVs to New Zealand have been Nissan Leafs. There is
currently a risk of fewer Leafs entering the market as Nissan has seen a recent shift in demand
towards HEV (e-power)54 vehicles in Japan (as discussed in Section 2.3 above). It is currently too
early to tell whether this represents a more widespread shift away from BEVs towards other
technologies. The Japanese Government has set a target of between 50% and 70% of new
vehicles using electric, fuel cell or other non-gasoline engines by 2030,55 or approximately 2.0 to
2.8 million annually (based on assumed total sales of 4 million). A Green Growth Strategy
released in 2021 suggested Japan aims to: 56
51 For example, 20.9% for BEVs in 2019/20 is 2878/((14756+16110+10467)/3)
52 BEVs: maximum of ¥400,000 (NZ$5,333); PHEVs: maximum of ¥200,000 (NZ$2,667); FCEV: maximum of
¥2,250,000 (NZ$30,000). Subsidy levels for BEVs and PHEVs are expected to double (temporarily), and those for
FCEVs to rise by several hundred thousand Yen: https://www.electrive.com/2020/12/16/japan-doubles-electric-
vehicle-subsidies/
53 http://jamaserv.jama.or.jp/newdb/eng/index.html
54 https://www.nissan-global.com/EN/TECHNOLOGY/OVERVIEW/e_power.html
55 Government of Japan (2019)
56 Ministry of Economy, Trade and Industry (2021); and Reuters Factbox-Japan's green growth strategy to help
achieve carbon neutral goal (https://www.reuters.com/article/us-japan-economy-green-factbox/factbox-
japans-green-growth-strategy-to-help-achieve-carbon-neutral-goal-idINKBN28Z0IR)
21You can also read